11email: peirani@iap.fr 22institutetext: GEPI, Observatoire de Paris, CNRS, University Paris Diderot, 5 place Jules Janssen, 92190 Meudon, France
33institutetext: LAM, UMR6110, CNRS/Université de Provence, Technopôle de Marseille-Etoile, 38 rue Frédéric Joliot Curie, 13388 Marseille Cédex 20, France
A giant bar induced by a merger event at z=0.4?
Abstract
Context. Disk galaxies are the most frequent objects among the galaxy population in the local universe. However, the formation of their disks and substructures – in particular their bars – is still a matter of debate.
Aims. We present a physical model of the formation of J033239.72-275154.7, a galaxy observed at and characterized by a big young bar of size kpc. The study of this system is particularly interesting for understanding the connection between mergers and bars as well as the properties and fate of this system as it relates to disk galaxy formation.
Methods. We compare the morphological and kinematic properties of J033239.72-275154.7, the latter obtained by the GIRAFFE spectrograph, to those derived from the merger of two spiral galaxies described by idealized N-body simulations including a star formation prescription.
Results. We found that the general morphological shape and most of the dynamical properties of the object can be well reproduced by a model in which the satellite is initially put in a retrograde orbit and the mass ratio of the system is 1:3. In such a scenario, a bar forms in the host galaxy after the first passage of the satellite where an important fraction of available gas is consumed in an induced burst. In its later evolution, however, we find that J033239.72-275154.7, whose major progenitor was an Sab galaxy, will probably become a S0 galaxy. This is mainly due to the violent relaxation and the angular momentum loss experienced by the host galaxy during the merger process, which is caused by the adopted orbital parameters. This result suggests that the building of the Hubble sequence is significantly influenced by the last major collision. In the present case, the merger leads to a severe damage of the disk of the progenitor, leading to an evolution towards a more bulge dominated galaxy.
Key Words.:
Galaxies: evolution – Galaxies: kinematics and dynamics – Galaxies: interactions – Methods: N-body simulations1 Introduction
The formation of disk galaxies remains an outstanding puzzle in contemporary astrophysics (see Mayer et al. 2008 for a review). According to hierarchical models of structure formation, mergers and interaction of galaxies are an essential ingredient of galaxy formation and evolution. Earlier works and numerical simulations show that the remnants of mergings of purely stellar progenitors are more likely to be elliptical galaxies (Toomre 1977; Barnes 1988; Barnes & Hernquist 1992; Hernquist 1992; Lima-Neto & Combes 1995; Balcells & González 1998; Naab et al. 1999 etc.) and recent studies extended this result to gas-rich progenitors (Springel & Hernquist 2005; Robertson et al. 2006; Hopkins et al. 2008). Whether this is compatible, or incompatible, with the fraction of disk galaxies present in the local universe depends on the typical number of expected mergers by galaxy (see for instance Kazantzidis et al. 2007). Such predictions seems to be incompatible with observations which suggest that disk galaxies represent the majority (70%) of the galaxy population observed in the local universe (see Hammer et al. 2005; Nakamura et al. 2004 and references therein). To help resolve such issues, Hammer et al. (2005) suggested that disks can be rebuilt during the encounters of gas rich spirals. Indeed such proposition was guided by the remarkable coincidence of the redshift increase, up to z=1, of the merger rate, of the fraction of actively star forming galaxies (including luminous IR galaxies, LIRGs), of the fraction of galaxies with peculiar galaxies (including those with compact morphologies) etc… This has been followed by simulations of gas rich mergers (Springel & Hernquist 2005; Robertson et al. 2006; Governato et al. 2007; Hopkins et al. 2008), evidencing that under certain conditions, a disk may be re-built after a merger. Indeed such a conclusion had been already reached by Barnes (2002), but these simulations are less convincing since they do not include a prescription for star formation. Lotz et al. (2006) have also analysed a large suite of simulated equal mass rich mergers and find that most merger remnants appear disc-like and dusty. Moreover, this scenario is also consistent with results of other simulations and semi-analytical models which claim that, without merger processes, most of galaxies and their host dark matter halos cannot acquire the required angular momentum to form disks (see Peirani et al. 2004; Puech et al. 2007 and references therein). The formation of bars is also a fundamental issue in the evolution of disk galaxies, particularly since it has now been shown that only about one third of them were in place at = 0.8 (Sheth et al. 2008).
Our aim here is to reproduce with numerical modelling the general morphology (presence of a bar, of substructures, etc…), the dynamical properties of the gas component (velocity fields), the photometric properties of stars (colors, star formation rate, etc…) of J033239.72-275154.7, a galaxy located at for which we have high quality imaging and kinematics. This work will also provide useful input to disk formation models, since it gives information on potential progenitors of the present-day galaxy disks, as well as constraints on their formation (initial orbital configuration, mass ratio of the system, etc…) and possible fate. This work is an offspring of a VLT large program entitled IMAGES (“Intermediate-MAss Galaxy Evolution Sequence”, Yang et al. 2008) which gathers high quality kinematics for a representative sample of massive galaxies at and with . Using the GIRAFFE spectrograph at the VLT, the kinematic properties of 65 of these galaxies, J033239.72-275154.7 for instance, have been derived. This galaxy lies at , is classified as a merger from analysis lead by Neichel et al. (2008) and presents a big, young bar. This bar has a size of 6 kpc, i.e. is quite big since 72% of barred galaxies from a sample of 2000 galaxies from the SDSS have a size lower than this (Barazza et al. 2008). This bar has also an extremely blue color, consistent with a starburst, i.e. with ages well below few 100s of Myr. This contrasts with many bars in the local universe which are known to include relatively old and red stars (Sheth et al. 2003). This paper is organized as follows: in Section 2 we present the general morphological and kinetic properties of J033239.72-275154.7 and in Section 3 a short description of the numerical modelling and of the results obtained. We conclude in Section 4.
2 General properties of J033239.72-275154.7
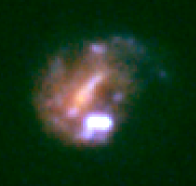
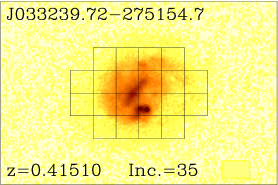
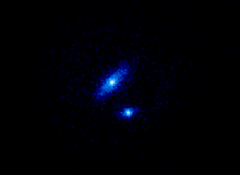
J033239.72-275154.7 has been presented first by Yang et al. (2008). Table 1 summarizes its overall properties, including photometry, morphological parameters and kinematics measurements (provided by the IMAGES data basis and can be retrieved from Yang et al. 2008, Neichel et al. 2008 and Puech et al. 2008). This object has a stellar mass of , a K-band magnitude of and shows a peculiar morphology and kinematics. Its center is dominated by an elongated structure, most likely a giant thin bar of semi-major axis 0.85 arcsec or about 6 kpc. Neichel et al. (2008) found that its color is roughly b-z=0.8, i.e. typical of starburst (see their figures 8 and 12). This bar is embedded into a diffuse region, which is probably a disk, as argued e.g. by features which look like tidal arms (one very blue at the upper right and another on the left). It is, nevertheless, very irregular, with several blue clumps. Roughly at its center, there is a strong light condensation which we will sometimes refer to as the core, and which is probably a small bulge Its color is roughly b-z=1.8, i.e. as found in galaxies of late type to Sbc (Neichel et al. 2008). The bar is asymmetric, extending spatially much more towards the upper-right side of the core. On the other side of the core, the bar is redder and a part of it disappears at UV wavelengths. The discrepancy in color between the two sides is roughly 0.3 magnitudes, as shown by the CDFS-GOODS observations (b band observations, thus UV rest-frame at z=0.4). On the bottom of the galaxy, there are two bright adjacent knots, which dominate the rest-frame UV light. These knots have the color of a pure starburst and could be hardly resolved. Due to the irregularity of the disk and to the existence of the bright tidal arms, it is difficult to measure accurately its position and inclination angle. From the shape of the outer isophotes we find that the photometric major axis is roughly in the upper-right lower-left direction and the inclination should lie between and . The star formation rate (SFR) is moderate (, ) and the dust does not affect much the overall color. Note that SFRs have been estimated using the 2800A and 15 micron luminosities, respectively. Those have been converted to SFR using the method described in Kennicutt (1998). Luminosities have been estimated using interpolations between observed photometric points provided by HST/ACS, EIS and Spitzer/MIPS, using the method described in Hammer et al. (2001 & 2005). The ratio SFR of the SFR is consistent with Av=0.22 (standard extinction curve) which is very low. Finally, the electron density is modest, including at the very blue knots.
| Multi wavelength photometry, stellar mass and SFR | |||||||
|---|---|---|---|---|---|---|---|
| M2800 | MB | MV | MJ | MK | SFR2800 | SFRIR | |
| log(M⊙) | M⊙/yr | M⊙/yr | |||||
| -19.56 | -20.10 | -20.62 | -21.04 | -20.94 | 10.31 | 4.2 | 6.6 |
| Morphology and Kinematics | |||||||
| (from GIRAFFE measurements, Puech et al. 2008; Yang et al. 2008) | |||||||
| Vflat | rhalf | size of the bar | |||||
| km/s | kpc | deg. | kpc | ||||
| 30 | 3.5 | 35.4 | |||||
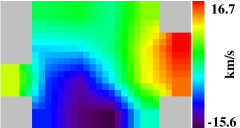
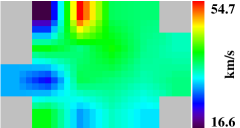
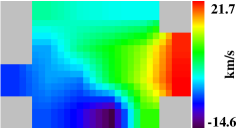
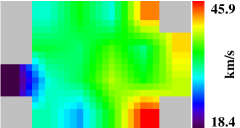
The velocity field (VF) is obviously complex (see Fig. 1). The kinematical major axis is almost parallel to the bar and it is offset by more than one GIRAFFE pixel from the bulge, towards the prominent blue knots (in the bottom). The pixel scale is 0.52 arcsec and the full width half maximum spectral resolution is 23 km/s. Details on the GIRAFFE instruments can be found in Flores et al. (2006) and Yang et al. (2008). The small VF amplitude is dominated by the two star-bursting clumps and by the blue arm/giant tidal tail. Even so, the velocity amplitude is relatively small, of the order of 30 km/s. The velocity dispersion map is nearly featureless at a value of 30-40 km/s over most of the galaxy. It has, nevertheless, a clear, localised sigma peak (50 km/s), which is offset by 2 GIRAFFE pixels from the bulge and could coincide (to within half a GIRAFFE pixel) with a small and relatively blue clump on the upper-right located roughly where the blue tidal arm joins the disk. The signal to noise ratio in this pixel is quite high ().
All the evidence argues that strong interaction and/or merging is at work in this system. Indeed, the dynamical axis is off-centered and passes through the region where the two bright knots lie. Moreover, there are strong tidal arms, and the value of / is small (about 1-2 depending on the exact value of the inclination). Indeed, the velocity dispersion is about 30-40 km/s over most of the galaxy. Given the VF values and the measured inclination, the rotational velocity is far below the value expected from the Tully-Fisher (TF) relation, which is km/s. This value has been taken from Hammer et al. (2007) who have carefully estimated the various samples used to derive this relationship. Given the spatial resolution, it is not easy to derive a rotation curve. Nevertheless, thorough modelling of the velocity fields have been done by Puech et al. (2008), who investigate the evolution of the Tully Fisher relation. Given its kinematical and morphological properties, it is thus unlikely that J033239.72-275154.7 can be a rotating disk hosting two giant HII regions because: (1) the two knots have a z band luminosity corresponding to one third of the total z luminosity (the relative photometry has been done using apertures, scaled to the full width half maximum of the knot luminosity, using the IRAF/DAOPHOT/ package) ; (2) the dynamical axis is strongly off-centered; (3) the value of is high and that of low.
Could merging of the two bright knots with J033239.72-275154.7 be compatible with the formation of a giant bar with a relatively blue color? -body simulations have shown that a small companion merging with a disk galaxy could, depending on its density and its orbit, either destroy a pre-existing bar (Athanassoula 1999; Berentzen et al. 2003), or trigger its formation (Walker et al. 1996; Berentzen et al. 2004).
3 Simulations
We briefly describe the numerical methodology used to model J033239.72-275154.7. We use idealized N-body simulations of the merger of two spiral galaxies. One of the most difficult part of this work results from the huge number of free parameters in the initial conditions, for instance related to the mass ratio and the orbital configuration of the system or the star formation prescription. We have performed more than 100 simulations and we present in this section our fiducial modelling. First, as mentioned in section 2, the dynamical axis of the system is off-centered and the velocity field strongly indicates that the satellite is falling down toward the main object. Then, by trying different orbital configurations, we found that retrograde orbits for the satellite are more plausible regarding the orientation of the tidal arms of the main galaxy (in the left and upper right parts) and the specific position of the accreted satellite. Second, different mass ratios of the system, different inclinations between the two orbit planes and different pericentric distances have been tested at the same time in order to match the amplitudes of the observed VF and map. For instance, since the VF amplitudes are small, the inclination between the two orbital planes should be small. It is also worth mentioning that we restricted our study to parabolic orbits (Khochfar & Burkert 2006) to reduce the number of free parameters. Finally, different parameters related to the star formation recipes (see below) have also been tested in order to obtain results consistent with the observations.
3.1 Initial conditions and numerical method
Our galaxies are composed of a spherical dark matter halo (with a Hernquist profile, Hernquist 1990), a disk, composed of stars and gas, and a bulge. In both objects, the disk and the bulge represent respectively 15% and 5% of the total mass. The baryon fraction used here is slightly higher than the cosmic baryon fraction (%) derived by Komatsu et al. 2008 in order to compare to and match the results from Barnes (2002). It’s worth mentioning that the gas fraction in the disk is 25% in the host galaxy, whereas it is 50% in the accreted satellite. These gas fractions are consistent with the estimation of Liang et al. (2006) Gavazzi et al. (2008) and Rodrigues et al. (2008). Note that the Gavazzi et al. (2008) measurements have been made in the local universe, while Liang et al. (2006) using the M-Z relationship, were able to estimate the evolution of the gas phase in z=0.6 galaxies, and found that, on average, galaxies at z=0.6 have two times more gas than at present days. The host galaxy has a stellar mass of and is more likely a Sab galaxy. Galaxies are created following Springel et al. (2005). Dark matter haloes have a concentration parameter of and for the host and the satellite, respectively, in good agreement with Dolag et al. (2004). Their spin parameter, defined by where is the angular momentum, is the total energy of the halo and is its mass, is in order that the rotation curves of the galaxies are closed to the baryonic TF relation (McGaugh 2005). Indeed, their maximum circular velocity is 140 km/s and 98 km/s, respectively. In our fiducial model, the satellite is put on a retrograde parabolic orbit (Khochfar & Burkert 2006) with a pericentric distance kpc and initial separation of kpc. The inclination between the two orbit planes is and the galaxy spins are opposed. Note that the initial separation between the two galaxies is quite small in order to reduce the high computational cost of all experiments. A higher distance would decrease the halos overlap at the beginning of the simulation, but this should not change the main results and conclusions of this paper.
The simulation is performed using GADGET2 (Springel 2005) with added prescriptions for cooling, star formation and feedback from Type Ia and II supernovae (SN). Approximately particles are used for the experiment and the masses (), gravitational softening lengths () and number of particles () of each component involved are summarized in table2.
| DM | gas | star (disk) | star (bulge) | |
| () | 6.60 | 0.31 | 0.93 | 0.41 |
| () | 2.20 | 0.21 | 0.21 | 0.14 |
| (kpc) | 0.1 | 0.2 | 0.2 | 0.1 |
| 100000 | 48000 | 25714 | 24000 | |
| 33333 | 32000 | 5714 | 8000 |
The cooling and star formation (SF) recipes follow the prescriptions of Thomas & Couchman (1992) and of Katz et al. (1996), respectively. Gas particles with K cool at constant density for the duration of a timestep. Gas particles with , number density , overdensity and form stars according to the standard SFR prescription: , where refers to the stellar density, is the dynamical timescale of the gas and is the SF efficiency. Assuming a constant dynamical time across the timestep, the fractional change in stellar density is . For each gas particle, we draw a random number () between 0 and 1 and convert it to a star if .
Instead of assuming ‘instantaneous’ energy injection, we include the effective lifetime of SN progenitors using the rate of energy injection . For this, we consider stellar lifetimes in the mass ranges and for Type Ia and Type II progenitors respectively. Using a Salpeter initial mass function for Type II SN gives:
| (1) |
where erg, is the mass of the stellar population and Myr. For Type Ia SN, the heating is delayed, since they appear Gyr after the onset of star formation. Following de Freitas Pacheco (1998), the probability of one event in a timescale after the onset of star formation is given by:
| (2) |
Eqns (1) and (2) are used to compute the energy released by SN derived from a star particle (). A fraction of this energy is deposited in the jth neighbour gas particle by applying a radial kick to its velocity with a magnitude , where is the weighting based on the smoothing kernel and is the mass of gas particle j. We note that all gas neighbours are located in a sphere of radius , centered on the SN progenitor, to avoid spurious injection of energy outside the SN’s region of influence. In the following, we use the following standard values: , kpc and .
3.2 Results
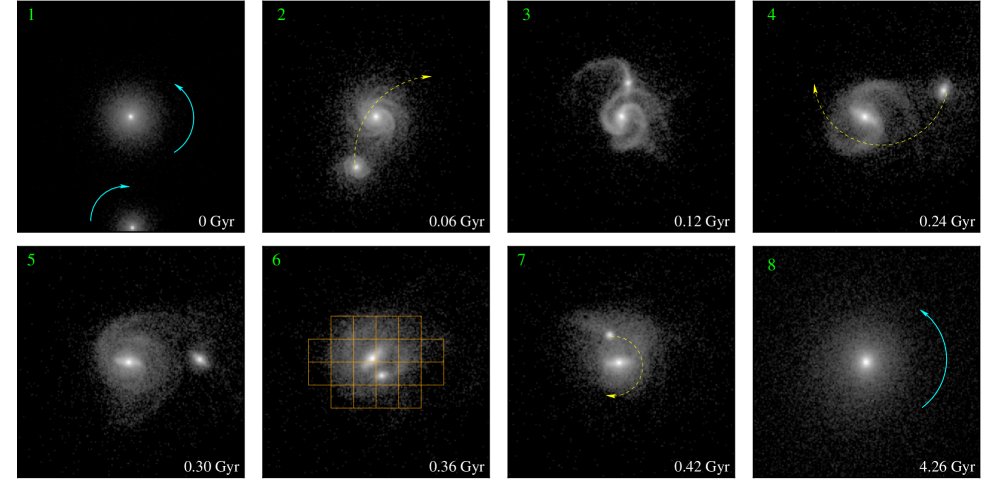
Figure (2) shows the time evolution of the projected stellar number density of the system. After Gyr from the beginning of the simulation, the system has a stellar mass of and presents, from a morphological point of view, a general shape and patterns similar to the observed ones. The disc of the more massive galaxy has not been destroyed yet, reflecting the very early stage of the dynamical process, and is viewed in Figs 2 and 3 at an inclination of , as found from its outer isophote. The bar of the host galaxy has roughly the right orientation and length ( kpc) and the projected position of the satellite remnant is in rough agreement. However, many difficulties remain e.g. in reproducing the blue arm or tidal tail on the upper right and the fact that the companion should be split into two distinct bright knots.
In the present scenario, the bar is forming after the first encounter with the satellite, since at that time there is a very strong triggering. In good agreement with the observations, it is particularly clear in the newly formed stars, since those, being on near-circular orbits, are more prone to the bar instability. Also in good agreement is the fact that the newly formed stars are also located in the satellite remnant (fig. 3). Moreover, according to our model, J033239.72-275154.7 is observed when the satellite is about to have the second encounter with the host. At this specific time, the SFR is (fig. 3) in good agreement with the observational estimation.

The VF and map of the gas component derived from our numerical model are represented in the GIRAFFE format in Fig.4. The determination of the radial velocities has been realized at the orientation of Figs 2 and 3. The observed VF and its amplitude are faithfully reproduced and show that the initial inclination between the two orbital planes is consistent. The map is relatively flat around a mean value of km/s, in good agreement with the observations. It presents two maxima of roughly the correct value, but located at positions other than those observed. However, these two maxima are located in regions which are not well resolved in gas particles and thus the resulting pixel values are not significant.
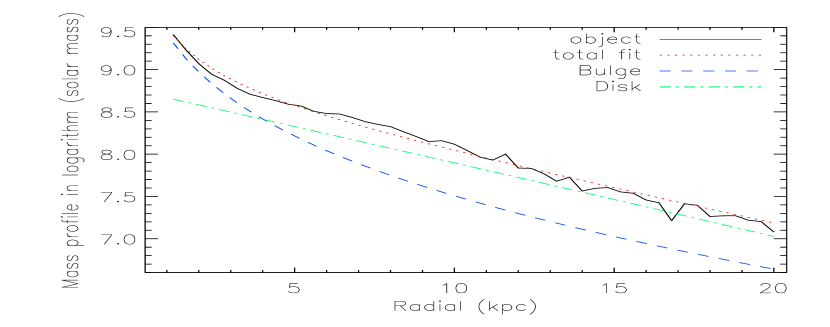
After 4.26 Gyrs, corresponding to the present time , the final object is characterized by a bulge-to-disk ratio close to 1.04, as derived from the mass profile decomposition along the major axis of the final product (see Fig. 5). For this decomposition, we used standard models for the disk and bulge, namely an exponential disk (Sérsic profile with index ) and a bulge following de Vaucouleurs law (Sérsic profile with index ), in which the free parameters are the bulge and disk radius and the bulge and disk flux. The rotational support parameter , where is the maximum of the major axis rotation speed and the central velocity dispersion. This latter is estimated by considering all star particles in a sphere of radius 0.5 kpc. These previous values obtained highly suggest the formation of a S0 galaxy.
4 Discussion and Conclusions
In this paper, we presented photometric and kinematic data of J033239.72-275154.7 and made a detailed comparison with an -body simulation. A first interesting and important result is that among all the simulations that we have realized with specific orbital parameters and progenitor mass ratios, the combination of parameters such as the star formation history, the VF and map put strong constraints on models and can remove the degeneracy of good candidates based on morphological criteria only.
We found that our fiducial model can roughly reproduce the general morphological shape and the total stellar mass of the object as well as the observed SF rate, VF and intensity of the map. This specifically includes the reproduction of the giant young bar, its location and shape, the relative projected location of the companion, the overall morphological shape of the galaxy, its low rotation and its off-center dynamical axis. The model predicts a slow-down of the velocity of the host galaxy due to exchanges of angular momentum with the companion (see Fig. 2). However, using such idealized simulations, we were unable to reproduce many features, such as the blue arm or tidal tail on the upper right part, the morphological patterns of the two bright knots of the satellite remnant and the location of the peaks. Such discrepancies with observations can be easily understood as due to the huge parameter space to be covered by the simulations. These include the properties of the progenitors (halo:disk:bulge:gas mass ratios and relative extents, shape of their density profiles and kinematics), the geometry of the encounter and of the viewing, the gas properties, the SF, cooling and feedback modeling. On the other hand, the discrepancies with observations may also have astrophysical origin and/or be due to a more complex formation scenario. Several such possibilities – such as multiple encounters or progenitors with specific properties – come to mind, but would increase substantially the already too large free parameter space.
In spite of these difficulties, it’s encouraging to note that our simple numerical modelling is able to build a consistent picture of the formation of J033239.72-275154.7. This system is consistent with having been formed from a merger of two objects with a mass ratio 1:3. The simulation indicates that a bar is forming in the host galaxy after the first passage of the satellite where an important fraction of available gas is consumed in the induced burst giving a plausible explanation of the observed blue colors of the bar and of the satellite remnant. Moreover, both VF and map derived from the simulation match with the observational values and thus support this scenario. In its later evolution, we found that J033239.72-275154.7 may become a S0 galaxy, as suggested by the results of our simulations. This is mainly explained by the fact that the host galaxy experiences a violent relaxation and looses some angular momentum during the merger process due to the retrograde orbit of the satellite. Moreover, by loosing some angular momentum, some of the gas can sink toward the center of the galaxy where it can be converted into new stars and then accelerate the growth of the bulge.
To finish, it is interesting to point out that recent numerical studies have demonstrated that gas-rich mergers can produce remnant disks provided strong feedback processes and also if both stellar and gas component do not experience a significant angular momentum loss (Springel & Hernquist 2005; Robertson et al. 2006; Governato et al. 2007, Hopkins et al. 2008). We propose in this work an extreme example where i) the initial orbital configuration of the merger event do not permit to satisfy the latter criteria and ii) the progenitors of the system (in our numerical model) may not be sufficiently gas rich to reform a significant disk according those past studies. However, the present results are consistent with the previous ones in the emphasis on the fundamental role played by the last major event in building the Hubble sequence (see e.g. Hammer et al., 2005 and 2007). It would thus be interesting to determine the frequency of each orbital configuration during a merger event and to compare with the galaxy population in the local universe to confirm this galaxy formation scenario.
Acknowledgements.
S. P. acknowledges the financial support through a ANR grant. E. A. from ANR-06-BLAN-0172. We warmly thank the referee Brant Robertson for an insightful review that considerably improved the quality of the original manuscript. S. P. also warmly thank Y. Kakazu for interesting conversations and for her moral support.References
- (1) Athanassoula, E. 1999, in ‘Galactic discs’, J. Sellwood and J. Goodman, PASP Conf. Ser. 160, 351
- (2) Balcells, M., & González, A. C. 1998, ApJL, 505, L109
- (3) Barazza, F. D., Jogee, S., & Marinova, I. 2008, ApJ, 675, 1194
- (4) Barnes, J. E. 1988, ApJ, 331, 699
- (5) Barnes, J. E., & Hernquist, L. 1992, ARA&A, 30, 705
- (6) Barnes, J. E. 2002, MNRAS, 333, 481
- (7) Berentzen, I., Athanassoula, E., Heller, C., Fricke, K.J. 2003, MNRAS, 341, 343
- (8) Berentzen, I., Athanassoula, E., Heller, C., Fricke, K.J. 2004, MNRAS, 347, 220
- (9) de Freitas Pacheco, J. A. 1998, AJ, 116, 1701
- (10) Dolag, K., Bartelmann, M., Perrotta, F., Baccigalupi, C., Moscardini, L., Meneghetti, M., & Tormen, G. 2004, A&A, 416, 853
- (11) Flores, H., Hammer, F., Puech, M., Amram, P., & Balkowski, C. 2006, A&A, 455, 107
- (12) Gavazzi, G., et al. 2008, A&A, 482, 43
- (13) Governato, F., Willman, B., Mayer, L., Brooks, A., Stinson, G., Valenzuela, O., Wadsley, J., & Quinn, T. 2007, MNRAS, 374, 1479
- (14) Hammer, F., Gruel, N., Thuan, T. X., Flores, H., & Infante, L. 2001, ApJ, 550, 570
- (15) Hammer, F., Flores, H., Elbaz, D., Zheng, X. Z., Liang, Y. C., & Cesarsky, C. 2005, A&A, 430, 115
- (16) Hammer, F., Puech, M., Chemin, L., et al. 2007, ApJ, 662, 322
- (17) Hernquist, L. 1990, ApJ, 356, 359
- (18) Hernquist, L. 1992, ApJ, 400, 460
- (19) Hopkins, P. F., Cox, T. J., Younger, J. D., & Hernquist, L. 2008, astro-ph/0806.1739
- (20) Katz, N., Weinberg, D. H., & Hernquist, L. 1996, ApJS, 105, 19
- (21) Kazantzidis, S., Bullock, J. S., Zentner, A. R., Kravtsov, A. V., & Moustakas, L. A. 2007, astro-ph/0708.1949
- (22) Kennicutt, R. C., Jr. 1998, ApJ, 498, 541
- (23) Khochfar, S., & Burkert, A. 2006, A&A, 445, 403
- (24) Komatsu, E., et al. 2008, astro-ph/0803.0547
- (25) Liang, Y. C., Hammer, F., & Flores, H. 2006, A&A, 447, 113
- (26) Lima-Neto, G. B., & Combes, F. 1995, A&A, 294, 657
- (27) Lotz, J. M., Madau, P., Giavalisco, M., Primack, J., & Ferguson, H. C. 2006, ApJ, 636, 592
- (28) McGaugh, S. S. 2005, ApJ, 632, 859
- (29) Mayer, L., Governato, F., & Kaufmann, T. 2008, astro-ph/0801.3845
- (30) Naab, T., Burkert, A., & Hernquist, L. 1999, ApJL, 523, L133
- (31) Nakamura, O., Fukugita, M., Brinkmann, J., & Schneider, D. P. 2004, AJ, 127, 2511
- (32) Neichel, B., et al. 2008, A&A, 484, 159
- (33) Peirani, S., Mohayaee, R., & de Freitas Pacheco, J. A. 2004, MNRAS, 348, 921
- (34) Puech, M., et al. 2008, A&A, 484, 173
- (35) Puech, M., Hammer, F., Lehnert, M. D., & Flores, H. 2007, A&A, 466, 83
- (36) Rodrigues, M., et al. 2008, astro-ph/0810.0272
- (37) Robertson, B., Bullock, J. S., Cox, T. J., Di Matteo, T., Hernquist, L., Springel, V., & Yoshida, N. 2006, ApJ, 645, 986
- (38) Sheth, K., Regan, M. W., Scoville, N. Z., & Strubbe, L. E. 2003, ApJL, 592, L13
- (39) Sheth, K. et al. 2008, ApJ, 675, 1141
- (40) Springel, V., & Hernquist, L. 2005, ApJ, 622, L9
- (41) Springel, V., Di Matteo, T., & Hernquist, L. 2005, MNRAS, 361, 776
- (42) Springel, V. 2005, MNRAS, 364, 1105
- (43) Thomas, P. A., & Couchman, H. M. P. 1992, MNRAS, 257, 11
- (44) Toomre, A. 1977, Evolution of Galaxies and Stellar Populations, 401
- (45) Walker, I. R., Mihos, J. C., & Hernquist, L. 1996, ApJ, 460, 121
- (46) Yang, Y., et al. 2008, A&A, 477, 789