Scaling of Clusters and Winding Angle Statistics of Iso-height Lines in two-dimensional KPZ Surface
Abstract
We investigate the statistics of Iso-height lines of (2+1)-dimensional Kardar-Parisi-Zhang model at different level sets around the mean height in the saturation regime. We find that the exponent describing the distribution of the height-cluster size behaves differently for level cuts above and below the mean height, while the fractal dimensions of the height-clusters and their perimeters remain unchanged. The winding angle statistics also confirms again the conformal invariance of these contour lines in the same universality class of self-avoiding random walks (SAWs).
pacs:
89.75.Da, 68.00.00, 11.25.HfThe study of surfaces, their static statistical properties, as well
as growth and evolution dynamics and their morphological properties,
has been attracting an ever increasing amount of interest over the
last two decades.
A method of characterizing surfaces is by
looking at their iso-height contour lines and the islands that are
generated by a cut through the surface at a certain constant height.
Such a situation can be found in the patterns exhibited by
topographical islands and continents. These islands and their
coastlines have some fractal features with a fractal dimension
related to the roughness exponent , given by the structure
function , where
is the height of interface as a function of its position.
Theoretical modeling of the growth processes started with the work by Edwards and Wilkinson (EW) EW who suggested that one might describe the dynamics of the height fluctuations by a simple linear diffusion equation. Kardar, Parisi, and Zhang (KPZ) Kardar realized that there is a relevant term proportional to the square of the height gradient which represents a correction for lateral growth. The KPZ equation is given by
| (1) |
The first term on the r.h.s describes relaxation of the interface caused by a surface tension , and the nonlinear term is due to the lateral growth. The noise is uncorrelated Gaussian white noise in both space and time with zero average i.e., and .
In (1+1)-dimension the roughness and growth exponents were exactly obtained, and respectively stanley , while for the (2+1)-dimensional case there are just numerical evidence and predictions Parisi .
The KPZ equation is invariant under translations along both growth direction and perpendicular to it, as well as time translation and rotation. Despite these symmetries, the existence of driving force perpendicular to the interface (due to the nonlinear term), breaks the up-down symmetry () stanley . In two dimensions these symmetries and growth dynamics can affect the statistics of the iso-height lines (island coastlines) at different level sets, which is the main subject of the present work.
In our previous paper saberi we have focused on zero iso-height lines of the (2+1)-dimensional KPZ model in the saturation regime (mean height was set to zero). Using the theory of Schramm-Loewner evolution (SLE), we have numerically shown that the contour lines of zero height behave statistically like self avoiding walks (SAWs) and they can be defined by the family of conformally invariant curves i.e., SLEκ curves with diffusivity . The statistics of these objects for the EW model has been shown to be the same as the interfaces in the model, and can be described by SLE4.
The SLE process, introduced by Schramm schramm describes the scaling limit of a variety of statistical mechanical models in two dimensions (some review articles are given in cardy ). Schramm and Sheffield showed that the contour lines in a two-dimensional discrete Gaussian free field are statistically equivalent to Schramm-Sheffield . Moreover, it is shown that the restriction property only applies in the case for Schramm-Lawler . Since self-avoiding random walk (SAW) satisfies the restriction property, it is conjectured that in the scaling limit it falls in the SLE class with Tom-Kennedy . The scaling limit of SAW in the half-plane has been proven to exist G. Lawler but there is no general proof of its existence.
The theory of SLE has recently been applied to many experimental and
physical systems. It is shown that the statistics of the
zero-vorticity lines in inverse cascade of two dimensional (2D)
Navier-Stokes turbulence is conformally invariant and belongs to the
percolation universality class bernard1 . The same issue has
been studied for zero-temperature isolines in the inverse cascade of
surface quasigeostrophic turbulence bernard2 , domain walls of
spin glasses spin glass and the nodal lines of random wave
functions Keatin . Moreover, it has been shown recently that
the statistics of the iso-height lines on the experimentally grown
WO3 surface is the same as domain walls statistics in the
critical Ising model WO3 . Avalanche frontiers in sandpile
models have been shown to be conformally invariant and in the same
universality class of loop erased
random walks ASM .
Here we briefly review the results obtained in saberi for
zero height level cuts, and then extend them for cuts
made at different heights.
We have integrated the discretized KPZ equation on a square lattice
of size , with periodic boundary conditions. The details of
numerical integration and simulation are given in saberi .
Consider an ensemble of 2D-KPZ saturated surfaces and a cut is made
at specific height say , where
the symbol denotes spatial averaging.
Then we define each island (cluster height) as a set of connected
sites with positive height which were identified by the
Hoshen-Kopelman algorithm.
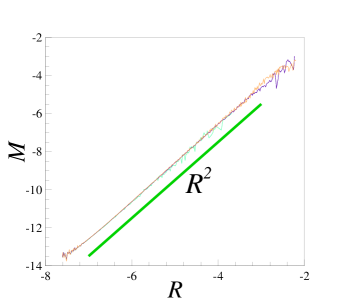
The scaling of the mass of a
cluster with the radius of gyration , behaves like , where is the fractal dimension of the cluster which
is in this case. As shown in Fig. 1, this fractal
dimension remains unchanged
for different .
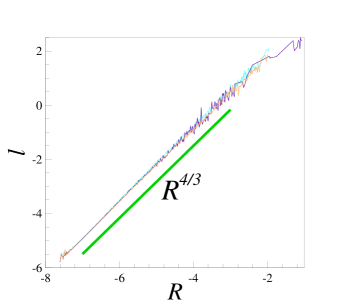
The fractal dimension of a coastline (or loop because of periodic
boundary conditions), can be obtained with the scaling relation
between the average length of a loop , and the radius of gyration
, as . This fractal dimension remains also fixed,
within numerical errors, for cuts made at different . The
best fits to data shown in Fig. 2, yields the fractal
dimension of a contour line in the range of (Fig. 2).
Powerful scaling arguments made by Kondev and Henley kondev ,
connect the fractal dimension of a contour line to the roughness
exponent of the surface,
| (2) |
where is the loop correlation exponent. Although
the exact value of is for and ,
kondev1 but it is conjectured that its value is super
universal and is independent of for Gaussian surfaces.
In the case of 2D-KPZ surface the finite size scaling for the
interface width yields the roughness exponent saberi
, which is in mild conflict of Eq.
(2). This may be because the field does not follow
a Gaussian distribution. In other words, the fractal dimension
obtained for contour lines of 2D-KPZ
surface, is equal to what one obtains for Gaussian surfaces with
.
The island size distribution has also a power-law behavior. As can be seen in Fig. 3, there are two distinct scaling regions for the distribution of the island size. We find that the small size islands are distributed according to a power-law distribution , with a same exponent for level cuts at different .
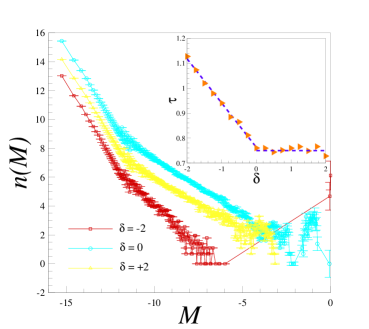
For the other region with larger island size dominant, the power-law
behavior is held, but with different exponents at different level
cuts.
For cuts made at lower values of , percolative
height clusters appear dominantly which their sizes are in the order
of sample size. Inside these percolative islands there are some
lakes (negative height clusters) which can also contain smaller
islands with the distribution as shown in Fig. 3 (for
). Increasing in the height of the cut, tends to a
continuous distribution of islands with different sizes and
different scaling behavior. We find that for cuts below the mean
height (i.e., ), the island-size distribution exponent
takes different values for different , while it takes
almost a same value (within statistical error) for positive height
cuts. This behavior is shown in the inset of Fig. 3, which
attributes two different regimes for level cuts i.e., and
. For level cuts made at , the island-size
distribution exponent decreases linearly with the slope of
, while it takes values around within
statistical errors for . This asymmetrical behavior of
the exponent around the mean height may be interpreted as the
breakdown of the up-down symmetry under changing in
the KPZ equation (1). This asymmetry in the dynamics of
the growth process can tend to an asymmetry in the statistics and
the distribution of valleys and overhangs.
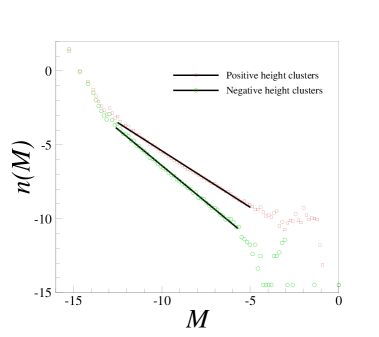
In a system with up-down symmetry it is expected that the valleys and overhangs have the same statistical behavior with same distribution. This behavior is not seen in the mean-height cuts of the 2D-KPZ surface. The size distribution of the islands with positive and negative heights differ. As shown in Fig. 4, the exponents defining these two distributions are quite different with values and for positive and negative height-clusters, respectively.
Although the exact cause for the behavior of the exponent as
function of the height of the cut eludes us, but it may be possible
to guess its behavior around the mean height kondev (a
slightly different problem has been investigated in Olami for
random Gaussian surfaces).
Using scaling arguments, it is shown in
kondev that the average number density of contour lines (the
coastlines here), scales with the radius of gyration as
. Since the dimension of the islands in our
case is (see Fig. 1), one can expect that the radius of
gyration for the perimeter of the islands and the islands themselves
have the same statistical behavior. So, the average number density
of the islands of size , is given by .
Within an uncertainty in determining the roughness exponent
, it yields an approximated value for the exponent which works here for the height cuts around and above the mean
height.
In the rest of the paper we investigate the conformal symmetry of
the coastlines of cuts made at different heights of two dimensional
saturated KPZ surface. Theory of SLE provides an appropriate
approach to check conformal properties of the geometrical features
of such systems. Looking at the fractal dimension obtained for the
KPZ coastlines at different level sets, it agrees with the SLE
curves of fractal dimension , with ,
conjectured to describe the scaling limit of SAWs. In saberi ,
we checked various consistencies between the coastlines and both
SAWs and SLE8/3. Such coastlines can statistically be defined
as the outer boundary of the random walk and of percolation
clusters. In our case, since the dimension of the islands is , it
suggests that they are compact unlike the clusters in critical
percolation.
Statistical behavior of the coastlines here is similar to the
statistics of rocky shorelines studied recently in Boffetta .
The winding angle statistics of the shorelines is consistent with
the prediction of SLE8/3. To be more serious about the
similarities between the 2D-KPZ coastlines and rocky shorelines and,
moreover, giving another justification for conformal invariancy, we
compute the winding angle statistics for the contour lines of 2D-KPZ
surface.
Duplantier and Saleur studied in Duplantier the winding angle between the two endpoints of a finite SAW in two dimensions. Using Coulomb gas methods, they found that the distribution of winding angle is Gaussian with the winding variance of , where is the distance between the endpoints and is Coulomb gas coupling parameter which is related to by . They have also shown that the winding angle at a single endpoint relative to the global average direction of the curve is a Gaussian with variance of . Wieland and Wilson found in Wilson that the variance in the winding at typical points along the curve is as large as the variance in the winding at the endpoints.
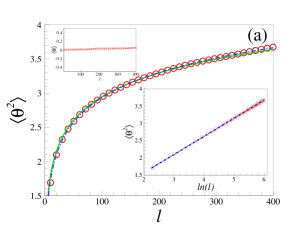
We define the winding angle (as used in Boffetta ), as the angle between the line joining two points separated by a length along the curve and the local tangent in the reference point, measured counterclockwise in . For conformally invariant curves of diffusivity , its variance behaves like Boffetta
| (3) |
where the average is taken over an ensemble of curves by moving the reference point along each curve.
As shown in Fig. 5(a), the variance of winding angle for
iso-height lines at a cut made at mean height has a logarithmic
behavior. The best fit (dotted dashed lines), corresponds to
which is compared with the fit by setting
for SAWs (solid line). The length scale , , is
measured in units of lattice spacing which is set to unity, on
square sample size of . For each configuration the largest
loop is selected, so within the length scale , the curves do not
have a preferred direction and the mean winding angle is zero
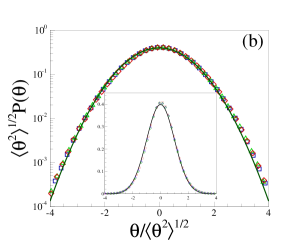
(upper-left inset in Fig. 5(a)). The rescaled probability
density function of the winding angle at different lengths is shown
in Fig. 5(b), which converges to a standard Gaussian
density. The results are consistent with saberi . We find no
changes in the winding statistics of contour lines at different
level sets.
In conclusion, studying the statistics of iso-height lines of
saturated 2D-KPZ surface at different level sets we find that the
fractal dimensions of cluster heights and their perimeter remain
unchanged when changing the height of the cut. We also find that the
exponent associated with the distribution function of the cluster
size (the mass of clusters is considered here) changes as a function
of the height of the cut. It linearly decreases for cuts made below
the mean height and crosses over to an almost linear fluctuation
around a specific value above the mean height. We also tested
another exponents related to the distribution of length of the
loops, the area of the loops and the radius of gyration which all
change at different level cuts (the results are not included in this paper).
The winding angle statistics of the contour lines also suggests that
their statistics is comparable to that of SAWs. This confirms that
the conformal invariant property of the contour lines are given by
SLE8/3.
References
- (1) S.F. Edwards, D.R. Wilkinson, Proc. R. Soc. London A 381, 17 (1982).
- (2) M. Kardar, G. Parisi and Y.-C. Zhang, Phys. Rev. Lett. 56, 889-892 (1986).
- (3) A.L. Barab si and H.E. Stanley, Fractal Concepts in Surface Growth (Cambridge University Press, Cambridge, 1995).
- (4) J.G. Amar, F. Family, Phys. Rev. A 41, 6, 3399 (1990); E. Marinari, et al., J. Phys. A: Math. Gen. 33, 8181 (2000).
- (5) A.A. Saberi, et al., Phys. Rev. E, 77, 051607 (2008).
- (6) O. Schramm, Isr. J. Math. 118, 221 (2000).
- (7) J. Cardy, Ann. Physics 318, 81 (2005); M. Bauer and D. Bernard, Phys. Rep. 432, 115 (2006); I. A. Gruzberg, J. Phys. A: Math. Gen. 39, 12601 (2006); H. C. Fogedby, [cond-math/0706.1177].
- (8) O. Schramm and S. Sheffield, [Math.PR/0605337] (2006).
- (9) G.F. Lawler, et al., J. Amer. Math. Soc. 16, 917 (2003).
- (10) T. Kennedy, Phys. Rev. Lett. 88, 130601 (2002).
- (11) G.F. Lawler, et al., arXiv:math/0204277.
- (12) D. Bernard, et al., Nature Phys. 2, 124 (2006).
- (13) D. Bernard, et al., Phys. Rev. Lett. 98, 024501 (2007).
- (14) C. Amoruso, et al., Phys. Rev. Lett. 97, 267202 (2006); D. Bernard, et.al, Phys. Rev. B 76, 020403(R) (2007).
- (15) J.P. Keating, et al., Phys. Rev. Lett. 97, 034101 (2006); E. Bogomolny, et al., [nlin/0609017].
- (16) A.A. Saberi, et.al, Phys. Rev. Lett, 100, 044504 (2008).
- (17) A.A. Saberi, et.al, (Submitted).
- (18) J. Kondev, C.L. Henley, Phys. Rev. Lett, 74, 23, 4580 (1995).
- (19) J. Kondev, et.al, Phys. Rev. E, 61, 1, 104 (2000).
- (20) Z. Olami and R. Zeitak, Phys. Rev. Lett, 76, 2, 247 (1996).
- (21) G. Boffetta, et.al, Geophys. Research Lett., 35, L03615 (2008).
- (22) B. Duplantier and H. Saleur, Phys. Rev. Lett. 60, 2343 (1988).
- (23) B. Wieland and D. B. Wilson, Phys. Rev. E, 68, 056101 (2003).