A Chandra X-ray view of Stephan’s Quintet: Shocks and Star-formation
Abstract
We use a deep Chandra observation to examine the structure of the hot intra–group medium of the compact group of galaxies Stephan’s Quintet. The group is thought to be undergoing a strong dynamical interaction as an interloper, NGC 7318b, passes through the group core at . Previous studies have interpreted a bright ridge of X–ray and radio continuum emission as the result of shock heating, with support from observations at other wavelengths. We find that gas in this ridge has a similar temperature ( keV) and abundance () to the surrounding diffuse emission, and that a hard emission component is consistent with that expected from high–mass X–ray binaries associated with star–formation in the ridge. The cooling rate of gas in the ridge is consistent with the current star formation rate, suggesting that radiative cooling is driving the observed star formation. The lack of a high–temperature gas component is used to place constraints on the nature of the interaction and shock, and we find that an oblique shock heating a pre–existing filament of Hi may be the most likely explanation of the X–ray gas in the ridge. The mass of hot gas in the group is roughly equal to the deficit in observed Hi mass compared to predictions, but only of the gas is contained in the ridge. The hot gas component is too extended to have been heated by the current interaction, strongly suggesting that it must have been heated during previous dynamical encounters.
Subject headings:
galaxies: clusters: individual (Stephan’s Quintet; HCG 92) — galaxies: intergalactic medium — galaxies: interactions — X-rays: galaxies1. Introduction
Stephan’s Quintet, also known as HCG 92 (catalog HCG92) (Hickson, 1982, hereafter SQ), was discovered roughly 130 years ago (Stephan, 1877) and is perhaps the most extensively studied compact galaxy group. Several factors contribute to the interest shown in the system. Of the original five galaxies identified as part of the group, one (NGC 7320 (catalog NGC7320)) has a discordant redshift and is now recognised as a superimposed foreground object; attempts to determine the true distances of the various members motivated much early work. Among the remaining galaxies, three (NGC 7317 (catalog NGC7317), NGC 7318a (catalog NGC7318a) and NGC 7319 (catalog NGC7319)) form a central kernel with similar recession velocities, while the fifth (NGC 7318b (catalog NGC7318b)) appears to be passing through the group core with a velocity of 850. The group shows signs of complex past tidal interactions, including stellar and Hi tidal tails (Arp, 1973; Shostak et al., 1984; Sulentic et al., 2001; Williams et al., 2002) hosting ongoing star formation (Xu et al., 1999; Gallagher et al., 2001; Mendes de Oliveira et al., 2004; Xu et al., 2005), and possible tidal dwarf galaxies (Xu et al., 2003). These features were probably formed during one or more passages through the group by the nearby NGC 7320c (catalog NGC7320c) (Shostak et al., 1984; Moles et al., 1997).
However, perhaps the most interesting aspect is the evidence of ongoing interactions as NGC7318b passes through the group. 1.4 GHz radio continuum observations reveal a ridge of emission lying along the eastern edge of NGC 7318b (Allen & Hartsuiker, 1972; van der Hulst & Rots, 1981) which has been shown to correspond to similar features in (Sulentic et al., 2001), UV (Xu et al., 2005), H2 (Appleton et al., 2006), 15m IR (Xu et al., 1999) and X-ray (Pietsch et al., 1997) emission. This structure has been widely interpreted as a shock caused by the collision of NGC 7318b with a pre-existing IGM or tidally stripped material (e.g., Sulentic et al., 2001; Xu et al., 2003). As such, it may serve as an example of the process by which the X-ray emitting IGM seen in more evolved groups is formed.
SQ has been observed previously by both Chandra and XMM-Newton (Trinchieri et al., 2003, 2005). Unfortunately the IGM is not particularly bright in X-rays (21041 for the shock/ridge region), the Chandra pointing was relatively short (20 ks) and the group is quite compact compared to the XMM field of view and imaging resolution. Spectral fitting of the ridge suggested a multi-temperature model was needed but did not strongly constrain the shock properties. The data did show the presence of substructures within the ridge, and indicated the possibility of temperature differences between these structures.
In this paper we combine a new, deeper Chandra exposure with the previous short observation to provide stronger constraints on the properties of the ridge and associated shock, and the surrounding IGM. SQ is an exceptionally complex system, with X-ray emission arising from many other sources, including the individual galaxies, tidal features and star forming regions. We will discuss these in detail and compare them with results from our own observations in other wavebands, which will in turn be described in detail in future papers.
2. Observations and Data Analysis
SQ was first observed by the Chandra ACIS instrument during Cycle 1 on 2000 July 09 (ObsId 789 (catalog ADS/Sa.CXO#obs/789)), for 20 ks, and then again during Cycle 8, on 2007 August 17-18 (ObsId 7924 (catalog ADS/Sa.CXO#obs/7924)) for 95 ks. A summary of the Chandra mission and instrumentation can be found in Weisskopf et al. (2002). In both cases the S3 CCD was placed at the focus of the telescope. For the first observation the instrument operated in faint mode, while the second was performed in very faint mode to take advantage of the superior background cleaning. We have reduced the data from both pointings using CIAO 4.0.1 and CALDB 3.4.5 following techniques similar to those described in O’Sullivan et al. (2007) and the Chandra analysis threads111http://asc.harvard.edu/ciao/threads/index.html. The level 1 events files were reprocessed, bad pixels and events with ASCA grades 1, 5 and 7 were removed, and the cosmic ray afterglow correction was applied. The data were corrected to the appropriate gain map, the standard time-dependent gain and charge-transfer inefficiency (CTI) corrections were made, and a background light curve was produced. Neither observation suffered from significant background flaring, and the final cleaned exposure times were 19.7 and 93.2 ks respectively. In general the observations were combined for imaging analysis, but spectra were extracted from the longer observation only.
Point source identification was performed using the ciao task wavdetect, with a detection threshold of 10-6, chosen to ensure that the task detects 1 false source in the field, working from a 0.3-7.0 keV image and exposure map from the combined observations. Source ellipses were generated with axes of length 4 times the standard deviation of each source distribution. These were then used to exclude sources from most spectral fits.
Spectra were extracted using the specextract task. Background spectra were drawn from a rectangular region of size 120x900 pixels, running parallel to the detector boundary north of the group emission. The region was selected to lie 120 pixels from the CCD edge, so as to avoid areas where the contaminant on the optical filter could produce increased absorption at low energies. A local background is preferred when fitting spectra where energies 1 keV are of interest, as it will have the correct hydrogen column (whereas blank-sky data are assembled from observations with a range of columns) and will correctly subtract any contamination from solar wind charge exchange emission. However, to ensure that our local background region contained no source emission, we extracted alternate background spectra from the blank-sky events lists, scaled to match the data in the 9.5-12.0 keV band and corrected by comparing the source and blank-sky spectra on the source-free S1 chip. We found no significant difference in our results when using either method, and conclude that our choice of local background region is satisfactory. Spectral fitting was performed in XSPEC 11.3.2ag. Abundances were measured relative to the abundance ratios of Grevesse & Sauval (1998). A galactic hydrogen column of 6.17 was assumed in most fits. 90% errors are reported for all fitted values. For calculation of luminosities and scales, we adopt a distance to the group of 85 Mpc.
2.1. Temperature Mapping
To examine the spatial variation of temperature in the gas, we prepared a temperature map using the technique developed by David et al. (in prep.), which takes advantage of the close correlation between the strength of lines in the Fe-L complex and gas temperature in 1 keV plasma. Most of the emission from such gas arises from the L–shell lines from Fe-XIX (Ne–like) to Fe-XXIV (He–like). For CCD resolution spectra, these lines are blended to form a single broad peak between approximately 0.7 and 1.2 keV. The centroid or mean photon energy of this peak increases with the temperature of the gas as the dominant ionization state of Fe shifts from Fe XIX in 0.5 keV gas to Fe XXIV in 1.2 keV gas. Since Li–like Fe is the highest ionization state that can produce L–shell lines, the mean photon energy of the blended L–shell lines is independent of energy above 1.2 keV.
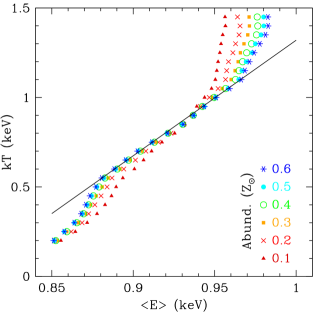
We can thus estimate the temperature distribution of the gas by mapping the mean photon energy in the 0.7-1.2 keV band. The relationship between kT and mean photon energy was determined by simulating spectra based on an absorbed vapec model with redshift set to that of SQ (), abundance fixed at a typical value determined from spectral fitting (0.3 ) and the hydrogen column set to the galactic value. These showed that for temperatures between 0.5 and 1.0 keV, the relationship is approximately linear (). We expect the correlation to be insensitive to global abundance variations, and test this by repeating the simulations with a range of abundances. Figure 1 shows that within our temperature bounds the relation remains reasonably accurate across a range of abundances. There is significant deviation only at the lowest abundances (0.1) and temperatures (0.5 keV), where the relation may overestimate the true temperature by 0.1 keV. The relationship should not be affected by variations in abundance ratio. While the 0.7-1.2 keV band contains some emission from O, Ne and Mg, at solar abundance ratios 93% of the emission arises from Fe, so exceptionally strong changes of abundance ratio (which would be obvious in spectra) would be required to affect affect the mean photon energy. We also expect the correlation to be only mildly sensitive to changes in hydrogen column. Simulations using a fixed temperature (0.6 keV, typical of SQ) but variable show that changing the column by a factor 2 alters the map temperature by 0.02-0.04 keV, an acceptable uncertainty for our purposes. The maximum column due to Hi within SQ has been measured to be (Williams et al., 2002); this would increase the estimated temperature to 0.67 keV, still a relatively small change.
This technique has the advantage of allowing the creation of maps with much finer resolution, or for regions with fewer detected counts, than would be possible using spectral fitting. In this case we have adaptively smoothed the map using the CIAO task csmooth, with smoothing scales based on the 0.7-1.2 keV image. Comparisons show that temperatures derived from such maps generally agree well with spectral fits, but we emphasize that we use the map only as a diagnostic tool, to give a general impression of the relative temperature structure and help select regions for further investigation.
3. Imaging Analysis
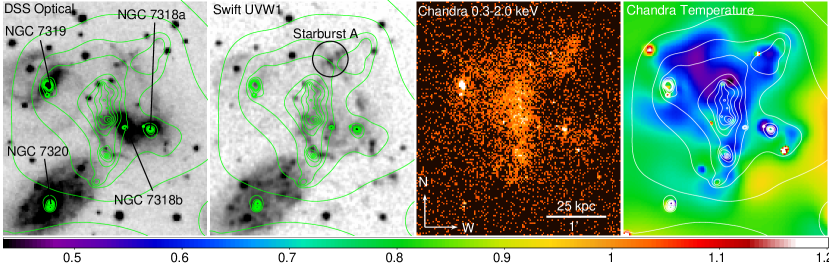
Figure 2 shows images of the core of SQ in the optical, near-UV, and soft (0.3-2.0 keV) X–ray band, and an X–ray temperature map. The images are centered on the emission ridge, which extends north-south along the eastern edge of NGC 7318b. There is some variation in X–ray brightness along the ridge, with the northern regions and the southern tip being brightest, with a fainter region between them. Several X-ray point sources are also identified in the ridge. The X-ray image shows several other features reported in previous studies of SQ: point sources associated with the centres of the four galaxies in the field of view, diffuse emission extending from the ridge towards NGC 7319, knots of emission northwest of the ridge and fainter emission coincident with and to the southwest of NGC 7318a/b.
The temperature map generally agrees with the image in identifying regions where gas is present. However, the temperature structure does not directly match the surface brightness structure. This is most notable in two regions: 1) the coolest gas is found to the northeast of the ridge region, possibly extending around its northern tip, and 2) the temperature of the ridge does not appear to be significantly raised above the surrounding emission, particularly that of the gas between the ridge and NGC 7319. At its southern end, the ridge is in fact cooler than the surrounding emission. In general, the ridge is not visible as a distinct structure in the temperature map.
It is also clear that the temperature is not strongly affected by absorption effects, as there is little correlation between map features and the known positions of Hi clouds. The highest hydrogen column in the group is found around the Starburst A region, and here we see a decrement in X–ray emission, with brighter regions to the southeast and northwest. The map temperature is also higher, but only by a marginal amount (0.05 keV). We therefore conclude that the map is a reliable guide to the temperature structure, particularly in the ridge where observations show there to be little or no Hi.

Figure 3 shows the radio continuum emission from the ridge, measured at 610 MHz using the Giant Metrewave Radio Telescope. A detailed analysis of these data will be presented in a later paper (Giacintucci et al., in prep), but the contours confirm the general structure seen at 1.4 GHz (e.g., Allen & Hartsuiker, 1972; Williams et al., 2002; Xu et al., 2003). The radio and X–ray emission generally agree, with most emission arising from the ridge or the active nuclei of the galaxies. The brightest area of radio emission associated with the ridge is the southern knot which is also a region of bright X–ray emission, next to two bright optical and UV clumps in the southern spiral arm of NGC 7318b. Outside the southern knot, the radio and X–ray peaks are more poorly matched. The brightest X–ray emission is found in the northern part of the ridge, whereas the radio is brighter to the south, overlapping with the X-ray where the spiral arm turns south, to the east of the core of NGC 7318b. This again is a UV bright region, so it appears that the areas of strongest radio emission in the ridge may be spatially correlated with star–forming regions. The 610 MHz radio emission also extends into the “starburst A” star forming region (see Figure 2) identified by Xu et al. (1999), where X–ray emission is faint, but is anti-correlated with the X–ray clump to the northwest of that region.
4. Spectral Analysis
In order to determine the properties of the gas in the ridge, and test the accuracy of the temperature map, we extracted spectra from a number of regions, shown in Figure 4. Region R is a ′′ rectangle which covers the entire ridge, and region C, ′′, is chosen to match the coolest region of the temperature map. For region R, fitting an APEC model with galactic absorption we find a temperature of 0.609 keV and abundance of 0.266, agreeing well with the temperature map. There is no evidence of excess absorption; freeing the hydrogen column does not improve the quality of the fit, and does not significantly alter the temperature or abundance. The parameters also agree with those found by Trinchieri et al. (2003) for an equivalent region in the earlier Chandra observation, and the central part of the ridge from the XMM-Newton observation (Trinchieri et al., 2005). However, while the fit is statistically acceptable ( for 70 degrees of freedom), the spectrum shows some evidence of an excess above 2 keV. Trinchieri et al. (2005), fitting XMM-Newton spectra for the ridge as a whole, found that a second component was required. For region C, we find that a powerlaw component is required in addition to the plasma model, probably arising from X-ray binaries in the spiral arms of NGC 7319, which the region overlaps. The gas temperature, 0.490 keV again agrees with the temperature map and is significantly cooler than the ridge emission. The abundance is poorly constrained (0.273).
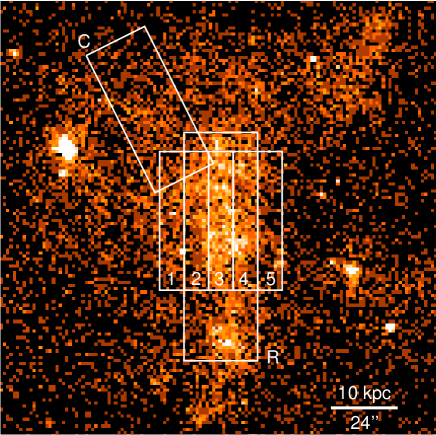
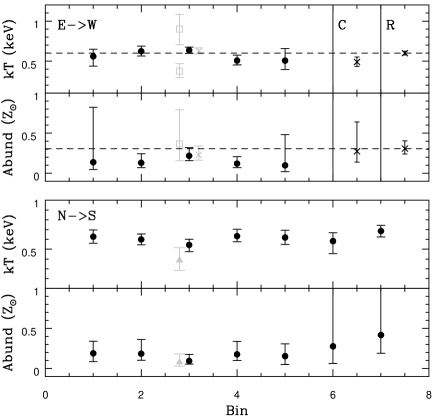
To search for any spatial variations in properties in the ridge, we derived spectral profiles across and along the region. Figure 4 shows five narrow rectangular regions spaced across the brightest part of the ridge. Fitting spectra extracted from these with absorbed APEC models, we find the temperatures and abundances shown in the upper panel of Figure 5. The only statistically significant difference is between the temperatures in bins 3 and 4, which becomes less than 90% significant if hydrogen column is allowed to vary. Bin 3 shows some evidence of an excess of hard emission, which can be modelled by either a power law or by using a two-temperature plasma model; either provides a statistically acceptable fit. The remaining bins have fewer counts (200-400, compared to the 870 net counts in region 3) so we cannot be certain that the hard excess arises only from this region. To measure variation along the length of the ridge, we split region R into seven equal bins. Results of absorbed APEC model fits to these regions is shown in the lower panels of figure 4. We find consistent temperatures and abundances along the length of the ridge, the only variation being the poorly constrained abundances in bins 6 and 7, which cover the southern knot and the fainter region immediately north of it. One notable feature is that the fit for bin 3 is significantly improved if hydrogen column is allowed to vary, in which case its temperature is significantly cooler than the other bins. This is the only region for which we find evidence of excess absorption, with a best fit column of 20.1, compared to the galactic column of .
The ridge overlaps an extended region of star formation in the southeast spiral arm of NGC 7318b and in the arm–like feature extending north to Starburst A, and we therefore expect a hard contribution from High-Mass X-ray Binaries (HMXBs). The star forming regions can be traced in the ultraviolet (see Figure 2) and Xu et al. (2005) estimate the star formation rate (SFR) in various parts of SQ based on the GALEX extinction corrected FUV magnitude. Our region R overlaps the most of their region V, so we adopt the SFR for this region and convert it to an expected 0.2-10 keV flux from high mass X-ray binaries (HMXBs) using the relation of Grimm et al. (2003). We assume a power law spectrum with for the HMXBs, with normalisation fixed to produce the expected flux. The resulting fit is somewhat under-constrained (red. =0.845 for 71 d.o.f.) but the temperature and abundance (shown in Figure 5) are similar, within the uncertainties, to those measured previously. The power law provides a good match to the expected hard component and if the normalisation is freed, the predicted flux is within the 90% uncertainty bounds. We therefore conclude that the hard emission observed in the ridge probably arises from HMXBs rather than a higher temperature gas component. Although there are insufficient counts in region 3 to definitely characterise the hard excess as a powerlaw, it seems reasonable to assume that it also arises from HMXB emission.
To estimate the mean gas density and total gas mass in the ridge we model the ridge as a cylinder described by region R ( kpc radius, 28.5 kpc length). We can measure the gas mass in the brightest (and as temperature is roughly constant, densest) part of the ridge using region 3 of the profile taken across the ridge, approximating the contribution from foreground and background emission by using region 2 as a background and again assuming a cylindrical distribution. While there is clearly variation in density within these regions, these estimates provide a measure of the mean density and a basis from which to examine the origins of the gas. We include a powerlaw component to represent the HMXB population and found spectral properties very similar to those described above. The gas density in the ridge was found to be 1.167 and the total mass 5.35. The peak density is 2.34, corresponding to a mass of . This is similar to the density found by Trinchieri et al. (2003).

To estimate the mass of gas in the group halo, we first fit a surface brightness profile in the 0.3-2.0 keV band, where gas emission should dominate (Figure 6). We center the profile at the midpoint of the northern section of the ridge, roughly on a line between the nuclei of NGC 7319 and NGC 7318a. We exclude regions corresponding to the cores of the galaxies as well as a wedge chosen to remove the tail of emission extending southeast (Trinchieri et al., 2003). As expected for such a disturbed system, the profile is not well described by simple beta model, but if an annulus between 30′′ and 80′′ is excluded a reasonable fit is achieved. The resulting model underestimates the surface brightness in the excluded region, which contains most of the lower luminosity diffuse structures around the galaxies and ridge. The best fitting parameters are R′′ and . From these parameters and the peak density we can determine the density profile of the gas, and numerical integration produces a gas mas of 2.84 within 200′′ ( kpc), approximately 50 times the mass of gas in the ridge. Within the central 35 kpc (85′′), the approximate limit of diffuse structures associated with the galaxies, we find a gas mass of 1.04. There are clearly considerable uncertainties in these values, as we do not know the true distribution of gas in the group, but they provide a useful estimate.
5. Discussion
There are three potential sources for the X–ray gas in SQ: accretion and shock heating of primordial gas; star formation and the associated stellar winds and supernovae; and shock heating of cold gas by the infall of NGC 7318b. The latter suggestion has received the most support in the literature, owing to evidence of shocks at other wavelengths (Shostak et al., 1984; Xu et al., 2003; Appleton et al., 2006). The presence of optical and Hi tidal tails has lead to the suggestion that the hot gas in the group core and particularly in the bright ridge is the product of shock–heating of an Hi filament created by previous tidal interactions between the group and NGC 7320c (Sulentic et al., 2001; Xu et al., 2003). SQ contains of Hi (Williams et al., 2002) but is Hi deficient, compared to predictions, by a factor 3 (Verdes-Montenegro et al., 2001). Our estimated total X–ray gas mass would be sufficient to make up this lack, again suggesting that the lost Hi has been heated prior to the current interaction. However, given the conflicting indicators from various observations, we consider all three possibilities.
5.1. Accretion of primordial gas
We would expect the temperature of accreted primordial gas to correspond to the Virial temperature of the system, which can be estimated from the velocity dispersion of the group galaxies. Unfortunately the small number of galaxies and uncertainty over which galaxies are actually gravitationally bound make this a difficult quantity to estimate. Osmond & Ponman (2004), using an iterative technique to determine group members and including a correction for the effects of biasing in systems with small numbers of galaxies, find a velocity dispersion for five galaxies (NGC 7317, 7318a, 7318b, 7319, 7320c), equivalent to a virial temperature T keV. If, as the observations suggest, NGC 7318b is passing through the group for the first time, it should not be included in the estimate. We therefore recalculate using the same methods as Osmond & Ponman (2004),
| (1) |
where is the recession velocity of the individual galaxy, is the mean recession velocity of the group and is the number of galaxies. We adopt velocities NGC 7317, NGC 7138a and NGC 7319 from Moles et al. (1997), and take the velocity of NGC 7320c from the HyperLeda database222http://leda.univ-lyon1.fr/. We find , equivalent to T keV. This is somewhat hotter than the temperatures seen in the group core, but is in reasonable agreement with the temperature map at larger radii. XMM-Newton imaging shows that SQ possesses a moderately extended (130-150 kpc) diffuse halo, whose extent strongly argues that it must predate the current interaction (Trinchieri et al., 2005). A spectrum extracted from an 85-135′′ annulus confirms the higher temperatures seen in the map, with kT=0.83 keV. This agrees reasonably well with the expected Tvir for four galaxies. However, we note that this value depends primarily on the recession velocity of NGC 7320c, since the other three galaxies have almost identical velocities. The inherent uncertainties in such a measurement therefore make this result inconclusive.
5.2. Star formation and Supernovae
A possible source for some of the emission in the group core and ridge is star formation and the resulting supernovae. Our spectral fitting results suggest that the hard component is consistent with emission from HMXBs in the young stellar populations of the star forming regions of NGC 7318b which the ridge overlaps. It is very noticeable that many of the brightest regions of the X–ray and radio emission in the ridge correspond to UV–bright knots in NGC 7318b, which are likely to be sites of star formation either now or in the recent past. The best example is the southern knot marked in Figure 3, which lies between and just outside two of the brightest UV regions in the southern part of NGC 7318b. This region is also associated with emission at the velocity of NGC 7318b (Sulentic et al., 2001) and hosts emission line features which indicate the presence of shocks (Xu et al., 2003). It therefore seems likely that both star formation and shock heating may be involved in the X–ray emission of this region, and perhaps the ridge as a whole. It is notable that if we assume simple radiative cooling and fit the spectrum for region R with a cooling flow model, we find a mass deposition rate of 1-4 yr-1, quite consistent with the star formation rate of 1.5/yr (Xu et al., 2005).
The starburst A region is a notable counterexample. Its SFR is similar to that of the ridge as a whole (Xu et al., 2005), but its X–ray emission is considerably fainter. In principle this may be in part due to absorption by the of Hi associated with the region (Williams et al., 2002). X–ray spectral fits for this region show no evidence of excess absorption, but the number of detected counts is low and the uncertainties on measured necessarily large. Similarly, the X–ray and radio emission to the southeast of the southern knot, extending toward NGC 7320, cannot be associated with star formation, suggesting shock heating must be important there. Accurate abundance measurements on small scales might help resolve this issue by allowing us to identify regions where rapid star formation has enriched the X–ray gas, but unfortunately even our deep Chandra observation contains too few counts for such detailed mapping.
We can also estimate the soft emission likely to arise from star formation activity. Ranalli et al. (2003) propose a correlation between SFR and 0.5-2 keV X-ray emission, in the absence of uncorrected absorption. Based on this correlation and the FUV SFR, we would expect a luminosity L, a factor 8.5 less than the observed gas luminosity in region R, L. However, comparisons of the X-ray and UV SFRs of star-forming galaxies in the Chandra deep field south show a scatter of a factor 10 or greater between the two wavebands (Rosa-González et al., 2007). It therefore seems likely, but not certain, that some other source of soft emission beyond the star formation in the region is required.
Another approach is to consider the energy available from the stellar population. A simple approximation would be to assume that one supernova will be produced per 100 of stars formed, and that each supernova yields approximately 1051 erg, in which case we would expect an energy injection rate in the ridge of . However, the lifespan of stars capable of producing supernovae is comparable to that of the collision ( yr compared to 2-8 yr), so it is likely that a significant fraction of the expected supernovae have yet to occur, if the star formation was triggered or enhanced by the infall of NGC 7318b into SQ. An alternative method is to estimate the supernova rate from the FIR luminosity of the ridge using the relation of Cappellaro et al. (1999). The available 60 m and 100 m fluxes are likely to be overestimates, since they are derived from low resolution Infrared Space Observatory (ISO) observations and include emission from NGC 7318a/b (Xu et al., 2003). Based on these fluxes, we find an expected SN rate of 4.9 yr-1. We would thus expect of energy to be injected into the gas in the ridge. These values are comparable to the reported IR and H2 luminosities (2.5 and 8.4 respectively, Appleton et al., 2006), but a significantly larger value would be required to explain all emission from the ridge.
Supernovae will also inject metals into the gas in the ridge. Assuming only type II supernovae and an elemental yield of 0.09 SN-1 of iron (Nomoto et al., 1997), we find an expected abundance in the ridge of 0.267, in good agreement with measured values. However, this is rather surprising given the multi–phase nature of the gas in the ridge; we might have expected the enriched material to be poorly mixed, and for multi–temperature emission to lead us to underestimate the abundance. In general, it seems clear that while star–formation and supernovae play a role in producing the ridge emission, they are unlikely to be the dominant source of energy.
5.3. Shock heating
The remaining alternative is that the infall of NGC 7318b into the group core has caused shock heating in a pre-existing intergalactic medium. Several of our X–ray results support this hypothesis and indeed it is difficult to imagine circumstances in which the interaction would not produce shocks. The low measured abundances (0.3or less) would be expected for gas originally in the extended Hi disks in the outskirts of spiral galaxies. Our estimated total mass of X-ray emitting gas in the central 35 kpc, , is comparable with the masses of Hi in the tidal tail () and starburst A regions (, Williams et al., 2002), which would have been linked by the now–heated Hi filament. The lack of excess absorption along the filament indicates that there is little Hi now in the region, suggesting it has been efficiently shocked or removed by some other means.
However, the lack of evidence for a significantly hotter gas component is problematic. We can estimate the post-shock temperature of the gas based on some simple assumptions about its pre-shock state. We consider three scenarios: 1) the pre-shock gas was Hi, 2) the 0.4 keV component of the multi-temperate fit to region 3 represents the pre-shock state, or 3) the 0.6 keV gas represents the pre-shock material. We assume a shock velocity of 850-900, based on the relative velocity of NGC 7318b with respect to the three galaxies in the group kernel. While the inclusion of NGC 7320c would lower the velocity difference to 700 we note that the higher value is supported by estimates from Hi velocities (Williams et al., 2002) and emission line studies (Appleton et al., 2006; Ohyama et al., 1998).
For scenario 1, this would yield a strong shock, heating the Hi to 1.2 keV. Scenarios 2 & 3 produce weaker shocks with mach numbers and expected post-shock temperatures of 1.3-1.5 keV. Our spectral fits suggest that all hard emission in the ridge is likely to arise from HMXBs, ruling out any such high-temperature component. Even if we assume that HMXB emission is unimportant and instead use an additional plasma model, the upper limit on the temperature is lower than that predicted for shock heating, and only a small fraction of the gas would be in the higher temperature component, very unlikely if the shock is ongoing.
Several possible explanations of these lower temperatures can be suggested: 1) the shock might be oblique rather than perpendicular, 2) the gas has cooled through adiabatic expansion, 3) rapid gas cooling via collisional heating and sputtering of dust would allow the temperature to drop swiftly after the shock passed, or 4) the shocked gas is not in ionisation equilibrium, leading us to underestimate its temperature.
Adiabatic expansion of the gas would explain both its cool temperature and the small mass of X-ray gas in the ridge compared to that expected in a pre-existing Hi filament. We can estimate an expansion timescale from the speed of sound in the gas, 390for the gas in the ridge and 310for the cooler material in region C. At such velocities, the sound crossing time for a distance of 35 kpc (from the ridge to the edge of region H) is 88 Myr. This is similar to the estimated total timescale of the encounter between NGC 7318 and SQ (20-80 Myr, Sulentic et al., 2001) and the synchrotron decay timescale of the radio emission associated with the ridge (80 Myr, van der Hulst & Rots, 1981), and longer than the estimated ages of the stellar populations in Starburst A (10-20 Myr, Xu et al., 1999) and the bluest star clusters in SQ (5-7 Myr, Sulentic et al., 2001). It is also notable that the temperature map shows a temperature rise with distance from the ridge, rather than the decline that would be expected. As the interaction is thought to be ongoing, this strongly suggests that adiabatic expansion cannot have greatly cooled the gas, and that the X-ray emitting gas we observe cannot arise entirely from shock–heating of a pre–existing Hi filament. This suggests either that some other source of gas has created the large scale X–ray halo, or that some prior interaction caused heating of part of the Hi in the group at an earlier epoch. The Hi distribution in NGC 7318b has been interpreted as supporting a past interaction with SQ (Williams et al., 2002), and the presence of X–ray emission coincident with the tidal tails (Trinchieri et al., 2005) provides further support.
Xu et al. (2003) suggest the possibility that the shocked X–ray gas is efficiently cooled on short timescales by collisional heating of dust. They estimate a cooling timescale for this mechanism of only yr and find a close match between the expected and observed FIR luminosities in the shock region. They also point out that the FIR luminosity is about an order of magnitude greater than the X-ray luminosity, supporting dust as the dominant source of energy loss. Comparison of Spitzer Space Telescope 160 m images with the XMM data confirms the presence of FIR emission in the general area of the X-ray/radio ridge (Xu et al., 2008). However, this scenario may not be able to explain the consistent 0.6 keV temperatures across the shock. The dust cooling timescale is so short that we would expect the shock to move only a few arcseconds, but we would expect to see a strong temperature gradient across this region, from high temperature gas at the shock front to very cool gas further downstream. There is no reason to expect cooling to stop at the observed temperature, so a coincidence would be required for us to find the gas in the ridge at the same temperature as its surroundings. An initial comparison between the Spitzer 160 m data and Chandra imaging suggests that X-ray ridge is offset slightly to the west of the FIR emission, most notably in the southern part of the ridge. Unfortunately the lower resolution of the Spitzer image and the presence of bright sources associated with star-forming regions, NGC 7319 and NGC 7320 make detailed examination of any offset difficult.
An alternative view is presented by (Guillard et al., 2009) who suggest that variations in the pre-shocked material will lead to a multi–phase post–shock environment. The least dense pre–shock gas will be heated to the highest temperatures and although collisional heating of dust will initially be the most efficient cooling mechanism, the dust will be rapidly destroyed by sputtering before the gas cools by more than 0.1 keV. Denser pre-shock regions will experience slower shock velocities, be heated to lower temperatures, and rapidly cool to form clouds of molecular gas. This scenario has the advantage of explaining the high H2 luminosity of the ridge (Appleton et al., 2006) while not requiring a coincidence of timing to produce the observed temperature distribution. Taking into account the initial cooling by dust grains, Guillard et al. find that the observed temperature of 0.6 keV would be produced by shock of velocity 800, similar to the observed velocity difference. The scenario does not explain why the ridge has such a similar temperature to its surroundings, and it is unclear what relationship should be expected between the X-ray and FIR emission; dust associated with gas which is being shocked now should be highly luminous, but if most of the dust is associated with the Hi filament then we might expect the FIR morphology to follow that structure.
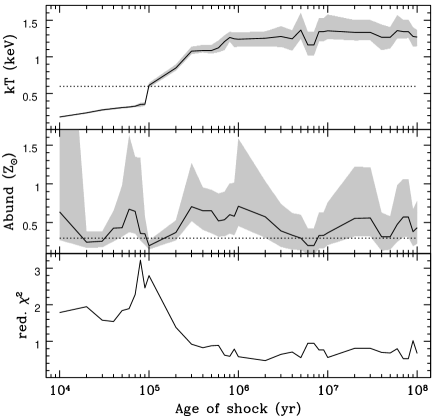
To test the possibility that the gas might be out of ionisation equilibrium, we followed the example of Graham et al. (2008) and simulated the expected spectrum of the gas at various times after the shock, assuming a post–shock density equal to that measured in the ridge, a true post-shock temperature of 1.35 keV and an abundance of 0.3. We also assume the density determined for region R, 1.167, but note that the model uses a parameter , so increasing density by a factor of 2 simply shifts our results by a factor of 2 in age. We included a powerlaw component to account for HMXBs, and fitted the resulting spectra with APEC+powerlaw models. We find that after 1 Myr the fitted temperature is an accurate measure of the true temperature of the gas. To produce the temperature and abundance we observe, a post-shock age of only yr is required, and at this stage the spectrum clearly deviates from that expected for an equilibrium plasma (reduced ). It therefore seems unlikely that a significant fraction of the gas is out of ionisation equilibrium.
The possibility that the shock is largely oblique is perhaps more promising. If NGC 7318b is moving primarily along the line of sight with the eastern or north–eastern edge of its disk leading (Sulentic et al., 2001), then some degree of obliquity would be expected for all parts of the galaxy except the leading edge. The region producing a perpendicular shock might be relatively small, producing only a minor contribution to the gas temperature along the line of sight, with other regions, including the section of the disk responsible for shocking the ridge, producing less energetic heating. Using our assumed velocity of 900 and post–shock temperature 0.6 keV, we find that for a strong shock (i.e., if the pre–shock material is Hi) an angle of 34∘ would be required (as compared to 90∘ for a perpendicular shock), in close agreement with the estimate of Trinchieri et al. (2003). For weak shocks, obliquity is clearly unhelpful if the pre-shock gas had a temperature of 0.6 keV, but for 0.4 keV material a similar angle, 31∘ would produce a post–shock temperature of 0.6 keV. These angles are comparable to the angle of the disk of NGC 7318b to the line of sight, 30-40∘, estimated from optical imaging (Sulentic et al., 2001).
However, it is worth noting two potential problems with this scenario. Firstly, the angle of the shock will be larger than the angle of the galaxy to the line of sight, owing to the opening angle of the shock cone. For a strong shock this angle will be narrow, but for a weak shock it is likely to be quite wide, 70∘ for the shock expected in 0.4 keV gas. Secondly, while the interaction which has produced the ridge may have involved Hi or 0.4 keV gas, NGC 7318b must have passed through higher temperature as on the far side of SQ as it fell into the core, and should have shocked this material. While the angle of infall is very unfavourable for detecting this shocked material, it seems surprising that we do not see some evidence of hotter gas around NGC 7318b.
We can estimate the thermal energy available from a shock if it does heat pre-existing Hi to 0.6 keV. If we conservatively assume that a region approximately the size of the brightest section of the ridge is directly affected by the shock ( kpc), and assume the peak density to be representative of the post–shock gas, we expect to be injected into the gas. For an area equal to the whole of region R with the average density determined for that region, about twice this energy would be available. The energy available from a shock is thus about an order of magnitude greater than that available from star formation and supernovae. While we do not fully understand how such a shock can produce the observed conditions, it seems likely that shock–heating must play an important role in heating the gas in SQ.
6. Conclusions
Stephan’s Quintet provides a rare opportunity to observe a galaxy group in the process of development from an X–ray faint spiral–rich system to a more evolved, elliptical–dominated, X–ray bright state. The possibility that a significant fraction of the cold gas in the group is being heated by the ongoing dynamical interactions has an obvious importance for our understanding of the origins of the hot gas halos of X-ray luminous groups. We have analysed a deep, 95 ks Chandra observation of SQ with the goal of placing strong constraints on the nature of the interactions in the system and improving our understanding of the origin of the emission ridge. Our results can be summarized as follows:
-
1.
The X–ray emission in the ridge is well described by a plasma of temperature 0.6 keV and abundance 0.3 plasma, with a powerlaw component consistent with that expected from HMXBs associated with the star formation in this region. The fitted temperature and abundance are very similar to the values found for the diffuse emission surrounding the ridge. This strongly suggests that the gas cannot be the product of a normal shock driven by the interaction with NGC 7318b. An oblique shock with an angle of ∘ could produce the temperatures we observe if the pre–shock material were Hi or keV gas. This angle matches that of the disk of NGC 7318b, suggesting that the shock heating of an Hi filament is a viable mechanism to produce much of the X–ray gas observed in the emission ridge. However, for 0.4 keV or hotter gas, the opening angle of the shock would be wide, and the interactions with the surrounding, pre–existing X–ray halo must at some point produce a normal shock. It is therefore unclear why no high–temperature plasma component, associated with shocking of the pre–existing hot gas, is observed.
-
2.
The total mass of X–ray emitting gas in SQ is similar to the deficit in Hi compared to expected values. It is therefore possible that the hot gas component of the group halo arises entirely from shock heating of Hi. However, the extent of X-ray emission is large compared to the expected rate of expansion of a shock heated filament of Hi. This strongly suggests that a hot intra–group medium was already present in the group before the current interaction. This could have arisen during previous dynamical interactions, for which there is plentiful evidence, in particular multiple tidal tails pointing roughly toward the nearby galaxy NGC 7320c. Alternatively, the hot gas component could be primordial material shock heated during its accretion into the group. The expected Virial temperature of SQ, based on the group velocity dispersion excluding NGC 7318b, is similar to the observed gas temperature outside the group core, though with large uncertainties owing to the small number of galaxies involved and the dynamical state of the group.
-
3.
Some of the brightest X-ray and radio emission regions in the ridge appear to be spatially correlated with star forming regions, identified by UV emission. The southern knot and the point at which the eastern spiral arm of NGC 7318b turns south are both bright in X–ray and radio. However, outside these regions there are significant disagreements between radio and X–ray distributions. This supports the idea that a combination of emission mechanisms is required to produced the structures observed.
-
4.
The cooling rate of hot gas in the ridge is consistent with the current star formation rate, suggesting that star formation in this region may be largely driven by radiative cooling. The mass of metals expected from the predicted number of supernovae also provides a good match to the observed gas abundance. However the soft X–ray luminosity expected from supernovae and star formation is smaller than that observed by a factor and the energy available from supernovae associated with star formation is also too small to support the emission observed at various wavelengths. The energy available from shock heating is probably sufficient to produce the observed luminosities.
-
5.
Efficient energy loss from the hot gas via collisional heating of dust appears unlikely to be the dominant source of cooling at present, since it would be expected to introduce strong temperature gradients which are not observed in the temperature map. Assuming that an Hi filament has been shocked, the dust associated with this filament would now be in the emission ridge, and would most effectively cool the gas in the densest parts of the ridge. As the ridge has a similar (or slightly warmer) temperature to its surroundings, a coincidence would be required for us to observe the gas at just this point in its cooling. Dust may have been a more important factor in cooling the gas immediately after the passage of the shock, but must have been rapidly destroyed by sputtering.
-
6.
It seems unlikely that our measured temperatures are being biased by the presence of non-equilibrium ionisation gas. Testing suggests that a non-equilibrium plasma capable of producing the temperature and abundance we observe would be very poorly described by an APEC model and would have to have been shocked within the last yr. By yr after shocking we would expect spectral fitting to accurately reproduce the plasma temperature. We therefore conclude that our measured temperatures are correct and that the great majority of the gas is in ionisation equilibrium.
In general, we conclude that the source of much of the X–ray gas in the ridge, and the majority of the energy powering the multi–wavelength emission from this region, arises from shocks driven by the infall of NGC 7318b. However, star formation plays an important role in determining the exact morphology of the ridge and is responsible for the majority of the hard emission via HMXBs. Considering the ridge in isolation, it appears possible that Hi in a pre–existing filament and in the disk of NGC 7318b has been shock heated by the interaction, with additional heating and enrichment by supernovae and stellar winds. However, this scenario cannot explain the larger X–ray halo of SQ, which may be evidence of shock–heating during previous dynamical interactions.
References
- Allen & Hartsuiker (1972) Allen, R. J., & Hartsuiker, J. W. 1972, Nature, 239, 324
- Appleton et al. (2006) Appleton, P. N., Xu, K. C., Reach, W., Dopita, M. A., Gao, Y., Lu, N., Popescu, C. C., Sulentic, J. W., Tuffs, R. J., & Yun, M. S. 2006, ApJ, 639, L51
- Arp (1973) Arp, H. 1973, ApJ, 183, 411
- Cappellaro et al. (1999) Cappellaro, E., Evans, R., & Turatto, M. 1999, A&A, 351, 459
- Gallagher et al. (2001) Gallagher, S. C., Charlton, J. C., Hunsberger, S. D., Zaritsky, D., & Whitmore, B. C. 2001, AJ, 122, 163
- Graham et al. (2008) Graham, J., Fabian, A. C., & Sanders, J. S. 2008, MNRAS, 349
- Grevesse & Sauval (1998) Grevesse, N., & Sauval, A. J. 1998, Space Sci. Rev., 85, 161
- Grimm et al. (2003) Grimm, H.-J., Gilfanov, M., & Sunyaev, R. 2003, MNRAS, 339, 793
- Guillard et al. (2009) Guillard, P., Boulanger, F., Pineau des Forets, G., & Appleton, P. N. 2009, ArXiv e-prints
- Hickson (1982) Hickson, P. 1982, ApJ, 255, 382
- Mendes de Oliveira et al. (2004) Mendes de Oliveira, C., Cypriano, E. S., Sodré, Jr., L., & Balkowski, C. 2004, ApJ, 605, L17
- Moles et al. (1997) Moles, M., Sulentic, J. W., & Marquez, I. 1997, ApJ, 485, L69
- Nomoto et al. (1997) Nomoto, K., Hashimoto, M., Tsujimoto, T., Thielemann, F.-K., Kishimoto, N., Kubo, Y., & Nakasato, N. 1997, Nuclear Physics A, 616, 79
- Ohyama et al. (1998) Ohyama, Y., Nishiura, S., Murayama, T., & Taniguchi, Y. 1998, ApJ, 492, L25+
- Osmond & Ponman (2004) Osmond, J. P. F., & Ponman, T. J. 2004, MNRAS, 350, 1511
- O’Sullivan et al. (2007) O’Sullivan, E., Vrtilek, J. M., Harris, D. E., & Ponman, T. J. 2007, ApJ, 658, 299
- Pietsch et al. (1997) Pietsch, W., Trinchieri, G., Arp, H., & Sulentic, J. W. 1997, A&A, 322, 89
- Ranalli et al. (2003) Ranalli, P., Comastri, A., & Setti, G. 2003, A&A, 399, 39
- Rosa-González et al. (2007) Rosa-González, D., Burgarella, D., Nandra, K., Kunth, D., Terlevich, E., & Terlevich, R. 2007, MNRAS, 379, 357
- Shostak et al. (1984) Shostak, G. S., Allen, R. J., & Sullivan, III, W. T. 1984, A&A, 139, 15
- Stephan (1877) Stephan, M. 1877, MNRAS, 37, 334
- Sulentic et al. (2001) Sulentic, J. W., Rosado, M., Dultzin-Hacyan, D., Verdes-Montenegro, L., Trinchieri, G., Xu, C., & Pietsch, W. 2001, AJ, 122, 2993
- Trinchieri et al. (2003) Trinchieri, G., Sulentic, J., Breitschwerdt, D., & Pietsch, W. 2003, A&A, 401, 173
- Trinchieri et al. (2005) Trinchieri, G., Sulentic, J., Pietsch, W., & Breitschwerdt, D. 2005, A&A, 444, 697
- van der Hulst & Rots (1981) van der Hulst, J. M., & Rots, A. H. 1981, AJ, 86, 1775
- Verdes-Montenegro et al. (2001) Verdes-Montenegro, L., Yun, M. S., Williams, B. A., Huchtmeier, W. K., Del Olmo, A., & Perea, J. 2001, A&A, 377, 812
- Weisskopf et al. (2002) Weisskopf, M. C., Brinkman, B., Canizares, C., Garmire, G., Murray, S., & Van Speybroeck, L. P. 2002, PASP, 114, 1
- Williams et al. (2002) Williams, B. A., Yun, M. S., & Verdes-Montenegro, L. 2002, AJ, 123, 2417
- Xu et al. (1999) Xu, C., Sulentic, J. W., & Tuffs, R. 1999, ApJ, 512, 178
- Xu et al. (2008) Xu, C. K., Appleton, P. N., Dopita, M., Gao, Y., Lu, N. Y., Popescu, C., Reach, W. T., Sulentic, J., Tuffs, R., & Yun, M. 2008, in Astronomical Society of the Pacific Conference Series, Vol. 381, Infrared Diagnostics of Galaxy Evolution, ed. R.-R. Chary, H. I. Teplitz, & K. Sheth, 88
- Xu et al. (2005) Xu, C. K., Iglesias-Páramo, J., Burgarella, D., Rich, R. M., Neff, S. G., Lauger, S., Barlow, T. A., Bianchi, L., Byun, Y.-I., Forster, K., Friedman, P. G., Heckman, T. M., Jelinsky, P. N., Lee, Y.-W., Madore, B. F., Malina, R. F., Martin, D. C., Milliard, B., Morrissey, P., Schiminovich, D., Siegmund, O. H. W., Small, T., Szalay, A. S., Welsh, B. Y., & Wyder, T. K. 2005, ApJ, 619, L95
- Xu et al. (2003) Xu, C. K., Lu, N., Condon, J. J., Dopita, M., & Tuffs, R. J. 2003, ApJ, 595, 665