XMM-Newton discovery of 2.6 s pulsations in the soft gamma-ray repeater SGR 1627–41**affiliation: Based on observations obtained with XMM-Newton, an ESA science mission with instruments and contributions directly funded by ESA Member States and NASA.
Abstract
After nearly a decade of quiescence, the soft gamma-ray repeater SGR 1627–41 reactivated on 2008 May 28 with a bursting episode followed by a slowly decaying enhancement of its persistent emission. To search for the still unknown spin period of this SGR taking advantage of its high flux state, we performed on 2008 September 27–28 a 120 ks long X-ray observation with the XMM-Newton satellite. Pulsations with s were detected at a higher than 6 confidence level, with a double-peaked pulse profile. The pulsed fraction in the 2–12 keV range is and for the fundamental and the second harmonic, respectively. The observed 2–10 keV flux is erg cm-2 s-1, still a factor of 5 above the quiescent pre-burst-activation level, and the spectrum is well fitted by an absorbed power law plus blackbody model (photon index , blackbody temperature keV, and absorption cm-2). We also detected a shell of diffuse soft X-ray emission which is likely associated with the young supernova remnant G337.0–0.1.
Subject headings:
ISM: individual (G337.0–0.1) — stars: neutron — supernova remnants — X-rays: individual (SGR 1627–41) — X-rays: stars1. Introduction
Two classes of young isolated neutron stars, the anomalous X-ray pulsars (AXPs) and the soft gamma-ray repeaters (SGRs) are currently believed to host magnetars, i.e. isolated neutron stars endowed with ultra-strong magnetic fields, – G on the surface and one (or more) order of magnitude higher in the interior (Duncan & Thompson, 1992; Thompson & Duncan, 1993, 1995). SGRs and AXPs share a number of properties, including rotation periods in the 2–12 s range, large period derivatives (– s s-1), inferred surface magnetic dipole field strength G, large and variable X-ray luminosities (exceeding that available from the braking of their rotation), and the emission of short bursts (see Woods & Thompson 2006 and Mereghetti 2008 for recent reviews).
The five known Local Group SGRs were discovered as sources of short (1 s) and intense (– erg s-1) bursts of gamma rays that they emit during sporadic periods of activity interrupted by long stretches of quiescence. Once localized through their bursts and flares, all of them were found to be persistent X-ray emitters, with luminosities of about – erg s-1. In four SGRs, SGR 1627–41 being the exception, pulsations were detected with periods from 5 to 8 s and period derivatives of – s s-1.
SGR 1627–41 was discovered in 1998 June by the Compton Gamma Ray Observatory thanks to the intense bursts it emitted at that time, about 100 in six weeks (Woods et al., 1999). Soon after the discovery of the bursts, its persistent X-ray emission was detected by BeppoSAX at a flux level of erg cm-2 s-1 (unabsorbed, 2–10 keV), corresponding to a luminosity of erg s-1 for a source distance kpc (Corbel et al., 1999). This led to the possible association of the SGR
with the young supernova remnant (SNR) G337.0–0.1 in the CTB 33 complex (Woods et al., 1999; Hurley et al., 1999).
In the following 10 years no further bursting activity was reported while the persistent emission steadily decayed to about erg s-1 (for kpc; Corbel et al. 1999), the lowest value ever observed from an SGR. At the same time the spectrum softened (Kouveliotou et al., 2003; Mereghetti et al., 2006).
The long-term fading of SGR 1627–41 was suddenly interrupted by its burst reactivation in 2008 May. This episode was associated with a temporary enhancement of the persistent X-ray flux and a marked spectral hardening (Esposito et al., 2008).
The detection of SGR-like bursts from SGR 1627–41 made it a bona fide member of the SGR class. However, two strong pieces of evidence in favor of this identification, the measure of the source period and period derivative, were still missing.999Woods et al. (1999) reported a candidate periodicity of marginal significance at 6.41 s, but the signal was not confirmed by subsequent observations.
In order to search for pulsations taking advantage of the enhanced flux after the reactivation, we requested a Target of Opportunity XMM-Newton observation, that was performed as soon as the satellite visibility constraints allowed it.
2. Observation, data analysis, and results
Our deep XMM-Newton observation of SGR 1627–41 started on 2008 September 25 at 00:51:02 UT and lasted about 120 ks,
occupying the whole satellite revolution number 1611. The data were collected with the EPIC instrument, which consists of two MOS (Turner et al., 2001) and one pn (Strüder et al., 2001) CCD cameras sensitive to photons with energies between 0.1 and 15 keV. The EPIC pn was operated in full frame mode (time resolution 73 ms) while both MOS units were in small window mode (time resolution 0.3 s). All the detectors mounted the thick optical blocking filter.
The raw observation data files (ODF) were processed with the XMM-Newton Science Analysis Software101010See http://xmm.esac.esa.int/external/xmm_data_analysis/ (SAS version 8.0.0) and the calibration files released in 2007 August using standard pipeline tasks (epproc and emproc for the pn and MOS, respectively). The source photons for the timing and spectral analysis were accumulated from a circular region ( arcsec radius) centered on SGR 1627–41. The background events were extracted from source-free regions of the same chip as the source.
We selected events with pattern 0–4 and pattern 0–12 for the pn and the MOS, respectively. For the timing analysis, the photon arrival times were converted to the solar system barycenter using the SAS task barycen. Photons having energies below 2 keV and above 12 keV were ignored, owing to the very few counts from SGR 1627–41. A total of about counts above the background were collected from SGR 1627–41 by the pn detector in the 2–12 keV range, by the MOS 1 detector, and by the MOS 2 detector.
2.1. Timing analysis
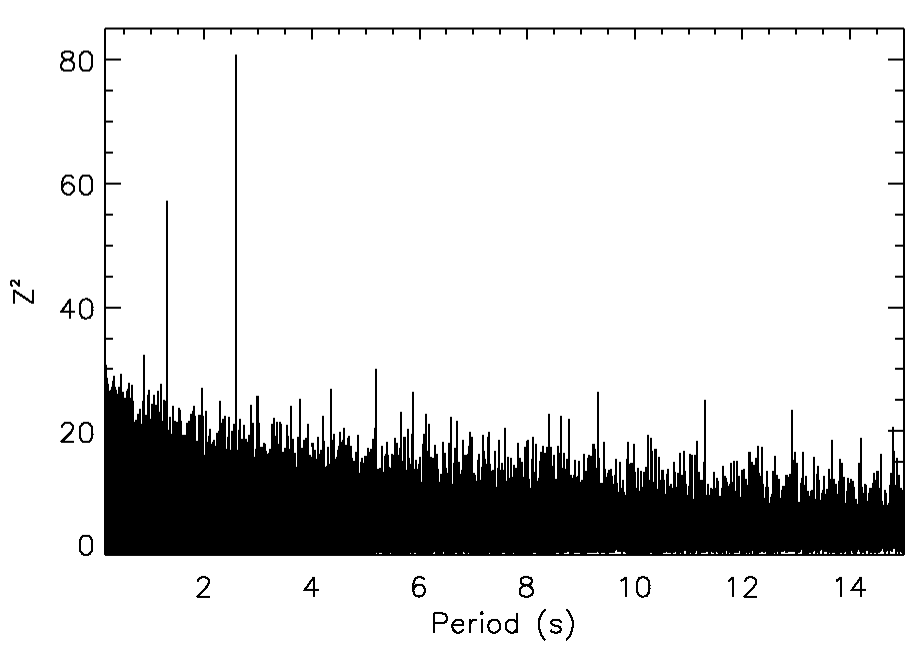
For the timing analysis we started with the high time-resolution pn data. We searched for pulsations in the 0.15–15 s range111111The frame time of the pn in full frame mode implies a Nyquist limit of about 146.6 ms. using the test (Buccheri et al., 1983), with the number of harmonics being varied from 1 to 5. The most significant peak occurred at about 2.6 s for (see Figure 1). Taking into account the number of searched harmonics and periods (1,647,257), the value of 80.72 for this peak corresponds to a chance probability of (that is a 6 detection).
We refined the period measurement by folding the pn plus MOS data at the best period inferred through the test and studying the phase evolution by means of a phase-fitting technique (see Dall’Osso et al. 2003 for more details). The resulting best-fit period was s (epoch 54734.0 MJD; hereafter all uncertainties are at 1 confidence level, unless otherwise specified). The current data set a 3 upper limit on the period derivative of s s-1.
The background-subtracted lightcurves folded at the best period are shown in Figure 2. The pulse profile is double peaked, with a pulsed fraction (semiamplitude of sinusoidal modulation divided by the mean source count rate; see Israel & Stella 1996 for more details) of and for the fundamental and the second harmonic, respectively (the above values correspond to in terms of root mean square, consistently with the 10% upper limit reported in Woods & Thompson 2006).

Within the statistical uncertainties the pulsed fraction is energy independent and no significant pulse shape variations as a function of energy were found by dividing the counts in soft and hard energy intervals. To assess this, we compared the folded lightcurves in various energy ranges using a two-dimensional Kolmogorov–Smirnov test (Peacock, 1983; Fasano & Franceschini, 1987). The results show that the probability that they come from the same underlying distribution is always larger than 30%.
Knowing the spin period, we went back to archival data and looked for pulsations with enhanced sensitivity. However, our searches in the previous XMM-Newton observations, as well as in BeppoSAX, ASCA and RossiXTE data,121212Public available Chandra data of SGR 1627–41 could not be used owing to their inadequate frame times. were inconclusive. The most constraining limits on the pulsed fraction were obtained from BeppoSAX (1998 August) and ASCA (1999 February) archival observations of SGR 1627–41. A Fourier analysis of the background-subtracted light curves was performed by means of the method described in Israel & Stella (1996) and no significant periodicity was found in the period interval 2.4–2.8 s (identified by considering the 3 upper limit on inferred above). The 3 upper limits on the pulsed fraction (as defined above), computed according to Vaughan et al. (1994), are about 63% and 51% for the BeppoSAX and ASCA data sets, respectively.131313These limits do not take into account the contribute from the diffuse structures described in Section 2.3, that are not resolved in the BeppoSAX and ASCA data.
2.2. Spectral analysis
For the spectral fitting (with XSPEC version 12.4; Arnaud 1996), data were grouped so as to have at least 30 counts per energy bin. The ancillary response files and the spectral redistribution matrices were generated with the SAS tasks arfgen and rmfgen, respectively. We jointly fitted the spectra by pn, MOS 1, and MOS 2 to blackbody, power law, and blackbody plus power law models, all corrected for interstellar absorption (see Table 1 for the best-fit model parameters).
The data disfavor the blackbody model ( for 152 degrees of freedom (dof)) and also the power-law fit yields a relatively high value (, 152 dof) with structured residuals (see Figure 3). A better fit is obtained by a power law plus blackbody model (, 150 dof). The best-fit parameters are photon index , blackbody temperature keV, and absorption cm-2. For a distance of 11 kpc (Corbel et al., 1999) this corresponds to a luminosity of erg s-1 (2–10 keV, unabsorbed).
| Parameter | Value | ||
|---|---|---|---|
| BB | PL | PL+BB | |
| ( cm-2) | |||
| (keV) | |||
| (km) | |||
| /dof | 1.38/152 | 1.19/152 | 1.07/150 |
| FluxaaObserved flux in the 2–10 keV range. ( erg cm-2 s-1) | 3.3 | 3.3 | 3.4 |

We compared the current spectral shape of SGR 1627–41 with those inferred from the latest observations by means of simultaneous fits. Apart from an overall normalization factor (to account for the different luminosities), the current spectrum is consistent with that observed by Swift/XRT during the onset of the 2008 May outburst, while it is significantly harder than that observed by XMM-Newton before the outburst, in 2008 February (Esposito et al., 2008).
2.3. Imaging analysis
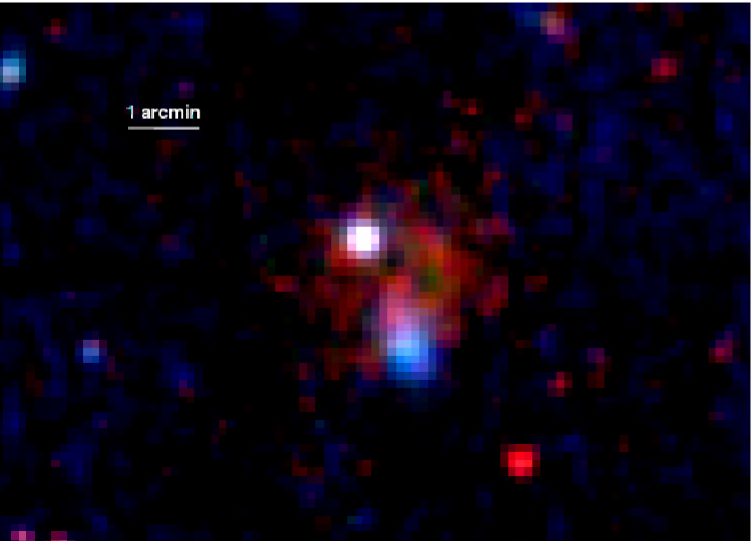
The energy-coded image of the field around SGR 1627–41 (Figure 4) shows that the source is embedded in a complex region of diffuse emission. A shell-shaped structure ( 2 arcmin diameter) with a softer spectrum than that of the SGR, as well as a bright spot of remarkably hard diffuse emission ( 2 arcmin to the southwest of SGR 1627–41) are apparent in Figure 4, where red and blue correspond to soft and hard X-ray photons, respectively. The combination of large absorption, source confusion and small photon statistics makes spectral analysis of such diffuse structures rather difficult. Selecting photons from a rectangular region located between SGR 1627–41 and the hard spot, we observe the emission of the very faint diffuse shell to peak between 2 and 3 keV. Using Chandra imaging data of the field, we estimated the contribution of unresolved point-like sources to the diffuse shell to be of order 30% in the 1.7–3.1 keV energy range. The brightest point sources in the region are also resolved in the EPIC data below 1.7 keV, where the diffuse emission is not seen. The spectrum of the shell is adequately described (, 106 dof) by an absorbed ( cm-2) hot plasma model (pshock in XSPEC, keV), with clear indications for emission lines from S (at 2.46 and 3.10 keV) and possibly from Fe (at 6.4 keV) and is therefore consistent with emission from a very absorbed SNR. The net (point source subtracted) surface brightness of the structure is of erg cm-2 s-1 arcmin-2 in the 1.7–3.1 keV band.
The spectrum of the second, harder, diffuse structure was extracted using a 20 arcsec radius circle around the apparent centroid of the feature. The source emission emerges from background above 2 keV and peaks around 5 keV. Significant signal is detected up to 12 keV. A thermal plasma model (mekal in XSPEC, abundance parameter left free) yields an acceptable description of the data (, 53 dof), although the absorbing column and the temperature are not well constrained ( cm-2, keV at 90% confidence level for a single parameter). The possible presence of an emission feature at 6.2 keV makes the fit improve after freeing the redshift parameter (, 52 dof; best-fit , pointing to Fe emission at 6.9 keV in the source frame). The 2–10 keV flux of the source within the aperture is of erg cm-2 s-1. A possible interpretation is that this source is a background cluster of galaxies. We note that a simple absorbed ( cm-2) power law () also yields an acceptable fit (, 53 dof). Thus, the source could also be a pulsar wind nebula, unrelated to SGR 1627–41.
3. Discussion and conclusions
We have discovered pulsations with period of 2.6 s in SGR 1627–41, which was the only known magnetar with no spin period yet measured. The pulse shape is double peaked, with pulsed fractions of and in the two harmonics. No dependence of the pulse profile on the energy band has been found. Among the known magnetars, only 1E 1547.0–5408 has a shorter period (2.07 s; Camilo et al. 2007) than that of SGR 1627–41.
We searched for a similar periodicity in all available archival data with sufficient time resolution, but no pulsation was found. Relying only on the last XMM-Newton observation we could set an upper limit on the period derivative, s s-1 which is not particularly constraining for a magnetar, and yields G. Based on the peak luminosities of bursts observed from SGR 1627–41, its dipole magnetic field was estimated to be G (Woods et al., 1999; Esposito et al., 2008). This limit can be used to infer a period derivative s s-1, a spin-down luminosity erg s-1, and a characteristic age kyr. Overall, and lacking any information on the pulsation period and profile in the past, we can only conclude that the timing properties of SGR 1627–41 reported here appear quite typical of a member of the SGR class.
Our observation caught SGR 1627–41 at a flux of erg cm-2 s-1, the highest seen with XMM-Newton and a factor of 5 above the level preceding its 2008 May burst activation (see Figure 1 of Esposito et al. 2008 for a complete flux history of the source). Its spectrum was well fitted in earlier data by a single-component model, either a heavily absorbed power law or a blackbody (Mereghetti et al., 2006). The higher-quality spectrum of the new data cannot be adequately fitted by these simple models, while it is consistent with a power law plus blackbody model, and it is significantly harder than in any observation of SGR 1627–41 taken before 2008 May (Kouveliotou et al., 2003; Mereghetti et al., 2006). The presence of a soft thermal component and the spectral hardening as the source moves from a quiescent to a (burst) active phase makes SGR 1627–41 akin to other SGRs and AXPs (e.g. Mereghetti et al. 2005; Rea et al. 2005). This latter behavior can be interpreted in the framework of the “twisted-magnetosphere model” as due to a progressive growth of the shear in the magnetosphere as magnetic helicity is transferred from the internal to the external field (Thompson et al., 2002; Fernández & Thompson, 2007; Nobili et al., 2008).
SGR 1627–41 has been proposed to be associated (Woods et al. 1999; Hurley et al. 1999, but see also Gaensler et al. 2001) to the radio SNR G337.0–0.1 (Frail et al., 1996; Whiteoak & Green, 1996). The shell of diffuse soft radiation (Section 2.3), consistent with emission from a young SNR at the distance of SGR 1627–41, is likely to be the first detection of this SNR in X-rays. Due to the complexity of the region, the extension of the SNR at radio frequencies is debated: Sarma et al. (1997) claimed a diameter of 95 arcsec with SGR 1627–41 outside the shell, while Brogan et al. (2000) proposed a different morphology extending the SNR size towards the southwest and encompassing the SGR. The position and extension of the diffuse X-ray emission are consistent with the latter hypothesis, supporting the possible association between SGR 1627–41 and G337.0–0.1.
References
- Anders & Grevesse (1989) Anders, E. & Grevesse, N. 1989, Geochim. Cosmochim. Acta, 53, 197
- Arnaud (1996) Arnaud, K. A. 1996, in ASP Conf. Ser. 101, Astronomical Data Analysis Software and Systems V, ed. G. Jacoby & J. Barnes (San Francisco, CA: ASP), 17
- Balucinska-Church & McCammon (1992) Balucinska-Church, M. & McCammon, D. 1992, ApJ, 400, 699
- Brogan et al. (2000) Brogan, C. L., Frail, D. A., Goss, W. M., & Troland, T. H. 2000, ApJ, 537, 875
- Buccheri et al. (1983) Buccheri, R., et al. 1983, A&A, 128, 245
- Camilo et al. (2007) Camilo, F., Ransom, S. M., Halpern, J. P., & Reynolds, J. 2007, ApJ, 666, L93
- Corbel et al. (1999) Corbel, S., Chapuis, C., Dame, T. M., & Durouchoux, P. 1999, ApJ, 526, L29
- Dall’Osso et al. (2003) Dall’Osso, S., Israel, G. L., Stella, L., Possenti, A., & Perozzi, E. 2003, ApJ, 599, 485
- Duncan & Thompson (1992) Duncan, R. C. & Thompson, C. 1992, ApJ, 392, L9
- Esposito et al. (2008) Esposito, P., et al. 2008, MNRAS, 390, L34
- Fasano & Franceschini (1987) Fasano, G. & Franceschini, A. 1987, MNRAS, 225, 155
- Fernández & Thompson (2007) Fernández, R. & Thompson, C. 2007, ApJ, 660, 615
- Frail et al. (1996) Frail, D. A., Goss, W. M., Reynoso, E. M., Giacani, E. B., Green, A. J., & Otrupcek, R. 1996, AJ, 111, 1651
- Gaensler et al. (2001) Gaensler, B. M., Slane, P. O., Gotthelf, E. V., & Vasisht, G. 2001, ApJ, 559, 963
- Hurley et al. (1999) Hurley, K., Kouveliotou, C., Woods, P., Mazets, E., Golenetskii, S., Frederiks, D. D., Cline, T., & van Paradijs, J. 1999, ApJ, 519, L143
- Israel & Stella (1996) Israel, G. L. & Stella, L. 1996, ApJ, 468, 369
- Kouveliotou et al. (2003) Kouveliotou, C., et al. 2003, ApJ, 596, L79
- Mereghetti (2008) Mereghetti, S. 2008, A&A Rev., 15, 225
- Mereghetti et al. (2006) Mereghetti, S., et al. 2006, A&A, 450, 759
- Mereghetti et al. (2005) Mereghetti, S., et al. 2005, ApJ, 628, 938
- Nobili et al. (2008) Nobili, L., Turolla, R., & Zane, S. 2008, MNRAS, 386, 1527
- Peacock (1983) Peacock, J. A. 1983, MNRAS, 202, 615
- Rea et al. (2005) Rea, N., Tiengo, A., Mereghetti, S., Israel, G. L., Zane, S., Turolla, R., & Stella, L. 2005, ApJ, 627, L133
- Sarma et al. (1997) Sarma, A. P., Goss, W. M., Green, A. J., & Frail, D. A. 1997, ApJ, 483, 335
- Strüder et al. (2001) Strüder, L., et al. 2001, A&A, 365, L18
- Thompson & Duncan (1993) Thompson, C. & Duncan, R. C. 1993, ApJ, 408, 194
- Thompson & Duncan (1995) —. 1995, MNRAS, 275, 255
- Thompson et al. (2002) Thompson, C., Lyutikov, M., & Kulkarni, S. R. 2002, ApJ, 574, 332
- Turner et al. (2001) Turner, M. J. L., et al. 2001, A&A, 365, L27
- Vaughan et al. (1994) Vaughan, B. A., et al. 1994, ApJ, 435, 362
- Whiteoak & Green (1996) Whiteoak, J. B. Z. & Green, A. J. 1996, A&AS, 118, 329
- Woods et al. (1999) Woods, P. M., et al. 1999, ApJ, 519, L139
- Woods & Thompson (2006) Woods, P. M. & Thompson, C. 2006, in Compact Stellar X-ray Sources, ed. W. H. G. Levin and M. van der Klis (Cambridge: Cambridge Univ. Press), 547