Cooling and aggregation in wet granulates
Abstract
Wet granular materials are characterized by a defined bond energy in their particle interaction such that breaking a bond implies an irreversible loss of a fixed amount of energy. Associated with the bond energy is a nonequilibrium transition, setting in as the granular temperature falls below the bond energy. The subsequent aggregation of particles into clusters is shown to be a self-similar growth process with a cluster size distribution that obeys scaling. In the early phase of aggregation the clusters are fractals with , for later times we observe gelation. We use simple scaling arguments to derive the temperature decay in the early and late stages of cooling and verify our results with event-driven simulations.
pacs:
45.70.-n, 47.57.-s, 61.43.HvGranular systems have encountered strongly increasing interest within recent years Jaeger et al. (1996); Duran (2000) as they are both close to industrial applications and relevant as model systems for collective systems far from thermal equilibrium. Most research has focused on dry granulates resulting in rich non-equilibrium phenomena Brilliantov and Pöschel (2004). The dramatic change of mechanical properties due to some wetting liquid additive is apparent, when we compare the fluid-like state of dry sand flowing through an hourglass with the shapeable plastic state of wet sand, which is suitable for molding a sandcastle. This change in bulk properties can be attributed to the differences in the underlying particle interactions Willett et al. (2000); Herminghaus (2005). Whereas in collisions of dry particles, a certain fraction of the initial kinetic energy is dissipated into the atomic degrees of freedom of the particles, in the wet case, the interaction is mainly due to the interfacial forces exerted by liquid capillary bridges which form between adjacent particles and dissipate energy upon rupture.
More recently, the dynamics of wet granular media has been addressed in several studies Thornton et al. (1996); Lian et al. (1998); Huang et al. (2005); Herminghaus (2005); Zaburdaev et al. (2006); Fingerle et al. (2008), focusing on nonequilibrium phase transitions Fingerle et al. (2008), agglomeration Thornton et al. (1996); Lian et al. (1998), shear flow Huang et al. (2005) and cooling in one dimension Zaburdaev et al. (2006). A particularly important aspect of free cooling in cohesive gases is the structure of the emerging clusters. It pertains to the formation of dust filaments and the microscopic mechanisms of cloud formation as well as to the size distribution and impact probability of planetesimals in accretion discs. Structure formation in wet granulates during free cooling has hardly been studied yet and is the central theme of our paper. We suggest a very simple model for the interaction of two wet grains, which only takes into account the essential features of a capillary bridge: hysteresis and dissipation with a well defined energy loss. Cooling is controlled by the probability for a bridge to rupture and hence logarithmically slow in the long time limit, when a percolating structure has been formed. For smaller times the structure is characterized by coexisting fractal clusters of all sizes, whose size distribution is shown to scale.
Model—Consider a gas of hard spheres of diameter in a volume . Each particle is covered with a thin liquid film. When two particles collide, a liquid bridge forms between the two spheres and induces an attractive force by virtue of the surface tension of the liquid Willett et al. (2000); Herminghaus (2005). As the spheres withdraw from each other and their separation increases, the bridge continues to exert a capillary force, , up to some critical distance, , where the bridge ruptures and liberates the particles. Thus there is a hysteretic interaction between the grains. Each rupture of a liquid bridge gives rise to dissipation of a fixed amount of energy, . Note that during each collision the total momentum of the impact partners is conserved. If the relative velocity of the impacting particles is insufficient to rupture the liquid bridge, (where is the reduced mass), they form a bounded state and continue their motion with the center of mass velocity.
We have simulated the above model with an event driven algorithm, assuming the force between two colliding particles to be zero, except when they touch – such that their relative distance is equal to – or recede beyond the critical distance for bridge rupture. When the particles touch, they are elastically reflected (complete restitution). When the colliding particle move apart and cross the critical distance , the energy is taken out of the motion of the impact partners - provided . Otherwise the particles are elastically reflected and remain in the bounded state. In a realistic model of wetted grains (thin film), the capillary film is infinitesimally thin, so that it is justified to assume that a bridge is only formed, if the particles actually touch. This implies that energy is removed at only, if the grains have touched each other before. In an alternative model (thick film) one assumes that a bridge is formed, if the particles approach closer than . The difference between the two models is insignificant for our results and is discussed in more detail in Ulrich et al. . We use dimensionless units such that , particle mass and particle diameter . The bond-breaking distance is chosen as and volume fraction is varied from up to . We use periodic boundary conditions in the - and -direction and hard walls in -direction.
Cooling—We define the granular temperature and investigate its decay in time from a given initial value . In each collision an amount of energy is lost with probability , the probability to break a capillary bridge. Hence the average loss of energy per time is given by
| (1) |
where denotes the collision frequency. In the early phase of cooling , so that every collision also leads to a rupture of the created capillary bond and . The collision frequency, is well established for a dilute system, with the particle density , the scattering cross section and the pair correlation function at contact . For the latter we use the Carnahan-Starling approximation Carnahan and Starling (1969). The simplified cooling equation is easily solved by
| (2) |
with a characteristic time scale
| (3) |
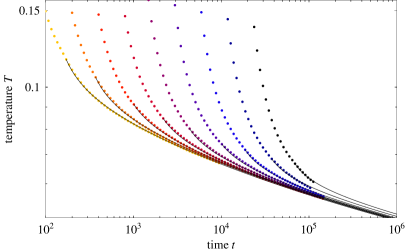
In Fig. 1 the evolution of the granular temperature from the simulation (dots) is compared to the analytic result (full lines) for different volume fractions . The main dependence on is contained in the timescale . Hence the different curves can be approximately collapsed onto a single curve, if is plotted versus scaled time (see inset).
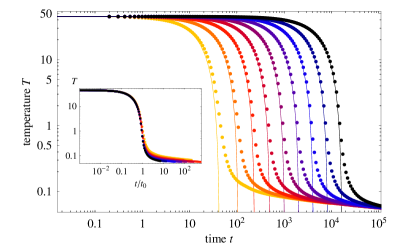
The agreement between theory and simulation is quite good up to , when the assumption contained in eq. (1) that every collision causes an energy loss breaks down. Yet the timescale has a clear physical relevance. At the temperature is comparable to the bond-breaking energy and for persistent clusters will form with important consequences for the cooling dynamics. Thus the timescale separates two regimes with qualitatively different structural and dynamic properties.
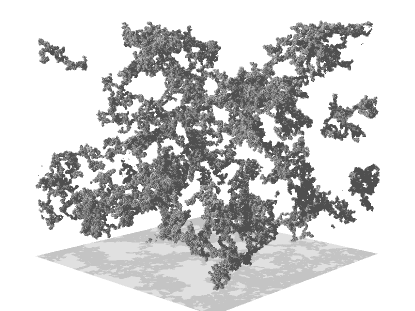
Aggregation—For the system starts to form aggregates, which grow in a self-similar process, reminiscent of ballistic cluster-cluster aggregation Jullien and Botet (1987). For even longer times we observe a spanning or percolating cluster for all finite densities and ultimately all particles and clusters have merged into a single cluster. In Fig. 2 we show such a cluster which has attracted of all particles.

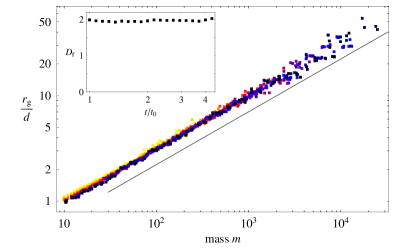
The structure of the aggregates in the early stage of aggregation, sometimes called flocculation regime, is characterized by the fractal dimension . It is easily determined from the radius of gyration, which is expected to scale with the cluster mass like , defining . In Fig. 3 we show the radius of gyration for a system of particles at volume fraction . Several snapshots of the ensemble of growing clusters have been taken at times (nonpercolating regime). The data scale well according to the above relation, some scatter is observed for the largest masses, corresponding to times close to the percolation transition. Since our clusters are not completely static, we plot the fractal dimension for each snapshot separately in the inset of Fig. 3. The variation is very small so that we conclude that does not depend on time.
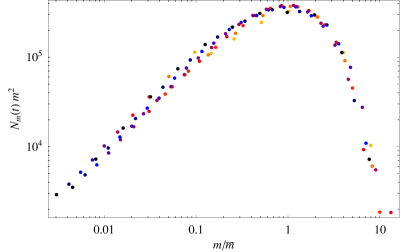
All information about the connectivity of the clusters is contained in the cluster size distribution, , the number of clusters of size at time . For aggregating systems the mass distribution is expected to evolve towards a self-preserving scaling form (e.g. Meakin, 1991), independent of the initial distribution:
| (4) |
where the time dependence is only contained in the mean cluster mass . Mass conservation requires Meakin (1991). We plot in Fig. 4 the scaling function for the data from eight snapshots taken at times between and . The data are seen to scale well in this regime, in which the mean cluster mass increases roughly by a factor of .
The asymptotic cluster, which contains all the particles, is compact on large scales. However, its structure at smaller length scale may well be fractal. To investigate the Hausdorff dimension of the largest cluster at intermediate length scales, we use the box counting algorithm Grassberger (1983); Hentschel and Procaccia (1983) and determine the number of boxes of edge length , needed to cover the whole cluster 111For the evaluation we use a slightly different algorithm, where particles are assumed to be point-like. A difference, however, would only be observable in the irrelevant regime .. On length scales much smaller than the particle diameter, , the system obviously behaves three-dimensionally and . Since our system is finite and contains a system-spanning cluster, the scaling behavior on large length scales should also be three-dimensional: for . Only in the intermediate regime, whose size is proportional to , can we expect to find a nontrivial such that .
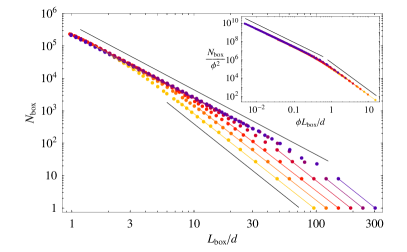
Results of the box counting algorithm for different densities (all in the percolating regime) are presented in Fig. 5. One can clearly distinguish two scaling regimes: at intermediate length scales a nontrivial slope of is observed, before the crossover to the expected value of on the largest scales takes place. The size of the nontrivial regime shrinks with increasing density according to . Thus the crossover length scales as and the number of boxes at this length scales is . Hence if we plot versus , the data should collapse onto a single universal curve. This is indeed the case, as can be seen in the inset of Fig. 5.
Long time asymptotics—In the late stage of cooling the probability to break a bond is given by the probability to find a kinetic energy larger than :
| (5) |
We approximate the velocity distribution, , by a Maxwellian of width and evaluate the above integral in the limit . The probability to break a bond becomes exponentially small in that limit
| (6) |
dramatically slowing down the decay of the kinetic energy according to Eq.(1): , predicting a logarithmic decay of for asymptotically large times. The full solution of the above equation is in good agreement with the simulation data as shown in Fig. 6. The proportionality constant in the rate equation is fitted, because the collision frequency is not known in this highly clustered state.
Conclusions—The characteristic energy loss of wet granulates gives rise to a well defined dynamic transition at time , when the kinetic energy is equal to . For very few collisions give rise to bound pairs of particles and cooling proceeds according to . For the particles aggregate into clusters with a flocculation regime in the early stages of aggregation and subsequent percolation. Cluster growth is a self similar process with a cluster size distribution that obeys scaling. The asymptotic time decay is logarithmically slow, because bond-breaking becomes a very unlikely process.
Acknowledgements.
We gratefully acknowledge financial support by the Deutsche Forschungsgemeinschaft (DFG) through Grant SFB 602/B6.References
- Jaeger et al. (1996) H. M. Jaeger, S. R. Nagel, and R. P. Behringer, Rev. Mod. Phys. 68, 1259 (1996).
- Duran (2000) J. Duran, Sands, Powders and Grains, vol. 1 (Springer, New York, USA, 2000).
- Brilliantov and Pöschel (2004) N. V. Brilliantov and T. Pöschel, Kinetic Theory of Granular Gases, vol. 1 (Oxford University Press, Oxford, 2004).
- Willett et al. (2000) C. D. Willett, M. J. Adams, S. A. Johnson, and J. P. K. Seville, Langmuir 16, 9396 (2000).
- Herminghaus (2005) S. Herminghaus, Advances in Physics 54, 221 (2005).
- Thornton et al. (1996) C. Thornton, K. K. Yin, and M. J. Adams, J. Phys. D 29, 424 (1996).
- Lian et al. (1998) G. Lian, C. Thornton, and M. J. Adams, Chem. Eng. Sci. 53, 3381 (1998).
- Huang et al. (2005) N. Huang, G. Ovarlez, F. Bertrand, S. Rodts, P. Coussot, and D. Bonn, Phys. Rev. Lett. 94, 028301 (2005).
- Zaburdaev et al. (2006) V. Y. Zaburdaev, M. Brinkmann, and S. Herminghaus, Phys. Rev. Lett. 97, 018001 (2006).
- Fingerle et al. (2008) A. Fingerle, K. Röller, K. Huang, and S. Herminghaus, New J. Phys. 10, 053020 (2008).
- (11) S. Ulrich, T. Aspelmeier, A. Zippelius, K. Röller, A. Fingerle, and S. Herminghaus, in preparation.
- Carnahan and Starling (1969) N. F. Carnahan and K. E. Starling, J. Chem. Phys. 51, 635 (1969).
- Jullien and Botet (1987) R. Jullien and R. Botet, eds., Aggregation and Fractal Aggregates (World Scientific, Singapore, 1987).
- (14) See EPAPS Document No. E-PRLTAO-102-003917 for a movie showing the asymptotic cluster for a system with volume fraction and particles. For more information on EPAPS, see http://www.aip.org/pubservs/epaps.html.
- Meakin (1991) P. Meakin, Reviews of Geophysics 29, 317 (1991).
- Grassberger (1983) P. Grassberger, Physics Letters A 97, 224 (1983).
- Hentschel and Procaccia (1983) H. G. E. Hentschel and I. Procaccia, Physica 8D, 435 (1983).