Suzaku Observations of extreme MeV blazar SWIFT J0746.3+2548
Abstract
We report the observations of the high luminosity blazar SWIFT J0746.3+2548 (J0746) conducted in November 2005. This object, with , is the highest redshift source observed in the Guaranteed Time Observer (GTO) period, is likely to show high gamma-ray flux peaking in the MeV range. As a result of the good photon statistics and high signal-to-noise ratio spectrum, the observation clearly confirms that J0746 has an extremely hard spectrum in the energy range of 0.3–24 keV, which is well represented by a single power-law with a photon index of and Galactic absorption. The multiwavelength spectral energy distribution of J0746 shows two continuum components, and is well modeled assuming that the high-energy spectral component results from Comptonization of the broad-line region photons. In this paper we search for the bulk Compton spectral features predicted to be produced in the soft X-ray band by scattering external optical/UV photons by cold electrons in a relativistic jet. We discuss and provide constraints on the pair content resulting from the apparent absence of such features.
Subject headings:
galaxies:active, quasars:individual (J0746.3+2548), X-rays:galaxies1. Introduction
Blazars are a sub-category of Active Galactic Nuclei (AGN) whose jet emission is pointing close to our line of sight (e.g., Urry & Padovani, 1995; Ulrich, Maraschi & Urry, 1997). Generally, the overall spectra of blazar sources (plotted in the log-log plane, where is the observed spectral flux energy density) have two pronounced continuum components: one peaking between IR and X-rays and the other in the -ray regime (see, e.g., Kubo et al., 1998; Ghisellini et al., 1998). The lower energy component is believed to be produced by the synchrotron radiation of relativistic electrons accelerated within the outflow, while inverse Compton (IC) emission by the same electrons is most likely responsible for the formation of the high energy -ray component. The spectral energy distributions (SEDs) of blazars form a sequence in luminosity, with more luminous sources having both peaks at lower energies than their fainter counterparts (Fossati et al., 1998; Ghisellini et al., 1998). In this sequence, flat-spectrum radio quasars (FSRQs) are the most luminous objects. It is widely believed, in addition, that the IC emission from FSRQs is dominated by the scattering of soft photons external to the jet (external Compton process, ERC). Those photons, in turn, are produced by the accretion disk, and interact with the jet either directly or indirectly, after being scattered or reprocessed in the broad-line region (BLR) or a dusty torus (see, e.g., Dermer & Schlickeiser, 1993; Sikora et al., 1994). Other sources of seed photons can also contribute to the observed IC component; in particular, those can be the synchrotron photons themselves, radiating via the synchrotron self-Compton (SSC) process (Sokolov & Marscher, 2005). In FSRQs, the synchrotron emission peaks around IR frequencies, and thus the nonthermal X-ray emission is relatively weak compared to that of other types of blazar sources. These spectral features suggest that FSRQs are well-suited for searching for the bulk Compton (BC) spectral component, which is produced by Comptonization of external UV radiation by cold electrons in a jet (Begelman & Sikora, 1987; Sikora & Madejski, 2000; Moderski et al., 2004; Celotti, Ghisellini & Fabian, 2007). Using data of PKS1510089, Kataoka et al. (2008) argued that the observed soft X-ray excess below 1 keV and the plausible one at keV may be such bulk-Compton features produced by inhomogeneities prior to their collision and shock formation (the latter being the site of particle acceleration and production of the nonthermal radiation).
SWIFT J0746.3+2548 (J0746) was identified with an optically faint quasar at detected in the 15–200 keV energy band the Burst Alert Telescope (BAT; Barthelmy et al., 2005) on board the satellite. Its broadband spectrum is representative of other FSRQs, which have two continuum components: one peaking at IR wavelengths and the other at MeV energies. This qualifies J0746 as a likely new member of the MeV blazar class (Sambruna et al., 2006). The X-ray spectrum observed by XRT was hard in the 0.5–8 keV with a photon index . Moreover, data showed spectral hardening at energies 1 keV, which Sambruna et al. (2006) interpreted as an excess absorption over the Galactic value, or a flatter power-law component, implying a sharp () spectral break at 4 keV. It has been argued that a clear distinction between the two possibilities can be made by , due to its broad bandpass, good photon statistics and low background data.
In 2005 November, simultaneous observations were performed with the Very Large Array (VLA; radio), the 26 m diameter University of Michigan Radio Astronomy Observatory (UMRAO; radio), the 14 m diameter Metshovi radio-telescopes (radio), the Hobby-Eberly Telescope (HET; optical), the 2.56m Nordic Optical Telescope(NOT; optical), XRT and UVOT (optical-UV, X-ray) and (X-ray). Sambruna et al. (2006) presented some of the simultaneous observations in addition to the description of J0746 discovery with . In this paper, we report a detailed analysis of the ks observation of J0746 as a part of the SWG (science working group) program. Moreover, we present the multiband analysis using all simultaneous observations. This paper is organized as follows. In 2, we described the observation and data reduction. In 3, we report the optical and radio results, which were not reported in Sambruna et al. (2006). In 4, we present the spectral analysis of the X-ray data as well as multiband analysis. Finally, we discuss the constraints on the content of the jet inferred from the X-ray spectrum in 5. Throughout this paper, we adopt the cosmological parameters km s-1 Mpc-1, and .
2. Suzaku Observation and Data Reduction
2.1. Observation
J0746 was observed with (Mitsuda et al., 2007) from 2005 November 4 at 08:20 UT until November 6 14:04 UT, during the performance verification (PV) phase. Table 1 summarizes the start and end times, and the exposures of the observation (sequence number 700011010). has four sets of X-ray telescopes (Serlemitsos et al., 2007) each with a focal-plane X-ray CCD camera (X-ray Imaging Spectrometer(XIS); Koyama et al., 2007) that are sensitive in the energy range of 0.3–12 keV. Three of the XIS (XIS 0, 2, 3) detectors have front-illuminated (FI) CCDs, while the XIS 1 utilizes a back-illuminated (BI) CCD. The merit of the BI CCD is its improved sensitivity in the soft X-ray energy band below 1 keV. also features a non-imaging collimated Hard X-ray Detector (HXD; Takahashi et al., 2007), which covers the 10–600 keV energy band with Si PIN photodiodes and GSO scintillation detectors. has the two default pointing positions, XIS nominal position and HXD nominal position. In this observation, we used the HXD nominal position, in which the effective area of the HXD is maximized, whereas that of the XIS is reduced to 88% on the average.
2.1.1 XIS Data Reduction
The XIS data used in this paper were version 1.2 of the cleaned data. The screening is based on the following criteria: (1) ASCA-grade 0, 2, 3, 4, and 6 events were accumulated, and the CLEANSIS script was used to remove hot or flickering pixels, (2) data collected within 256 s of passage through the South Atlantic Anomaly (SAA) were discarded, and (3) data were selected to be 5° in elevation above the Earth rim (20° above the day-Earth rim). After this screening, the net exposure for good time intervals is 100.5 ksec.
The XIS events were extracted from a circular region with a radius of 2.6′ centered on the source peak, whereas the background was accumulated in an annulus with inner and outer radii of 2.6′ and 4.3′, respectively. The response (RMF) files used in this paper are the standard RMF files (ae_xi{0,1,2,3}_20060213.rmf), provided by the XIS instrumental team. The auxiliary (ARF) files are produced using the analysis tool XISSIMARFGEN developed by the team, which is included in the software package HEAsoft version 6.2.
2.1.2 HXD/PIN Data Reduction
The PIN source spectra were extracted from cleaned version 1.2 HXD/PIN event files. Data were selected according to the following criteria: (1) More than 500 s from a South Atlantic Anomaly passage, (2) cut-off rigidity above 8 GV, and (3) day- and night-Earth elevation angles each 5°. After this screening and the dead time correction using ”pseudo-events” (Kokubun et al., 2007), the net exposure for good time intervals becomes 74.0 ksec.
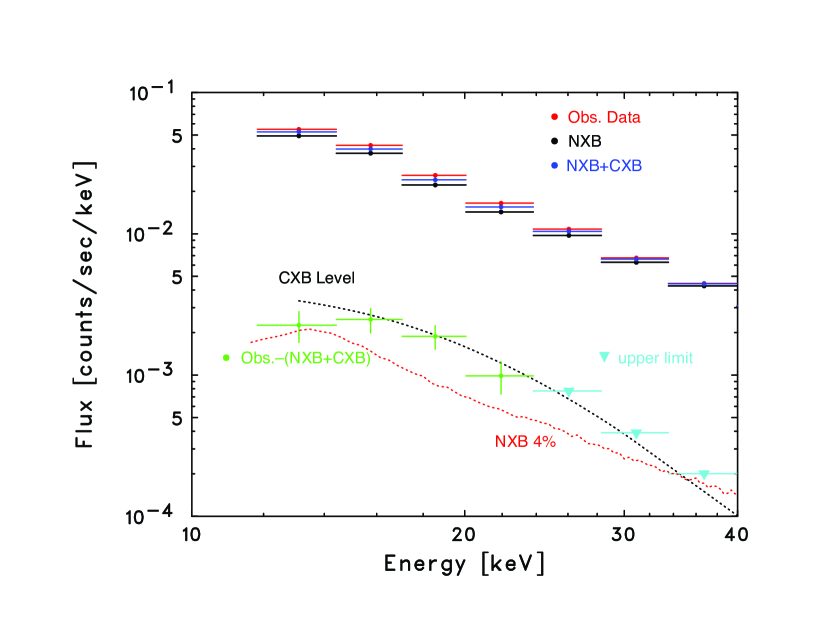
The PIN spectrum is dominated by the time-variable instrumental background induced by cosmic-rays and trapped charged particles in the satellite orbit. The HXD instrument team has developed an effective method (Watanabe et al., 2007) of modeling the time-dependent non-X-ray background (NXB) by making use of the PIN upper discriminator (UD) signal that monitors passing charged particles through the silicon PIN diode. The background spectrum is generated based on a database of NXB observations accumulated to date during night- and day-earth observations. The current NXB model is shown to be accurate within 4%. (Mizuno et al., 2006).
Another component of the HXD PIN background is the Cosmic X-ray background (CXB). The form of the CXB was taken as 9.010-9(E/3 keV)-0.29(E/40 keV) erg cm-2 s-1 (Gruber et al., 1999). The CXB spectrum observed with HXD/PIN was simulated by using a PIN response file for isotropic diffuse emission (ae_hxd_pinflat_20060809.rsp). However, Kokubun et al. (2007) reported that the PIN returns a 13–15% larger normalization than the XIS based on the most recent calibration using the Crab Nebula. Additionally, it was reported that the XIS normalization of the Crab Nebula agrees with the conventional Crab Nebula flux derived from previous satellites. Therefore, we introduced a scaling factor of 1.13 to normalize the CXB spectrum.
We used the response files version ae_hxd_pinxinom_20060814.rsp, provided by the HXD instrumental team. As reported in Kokubun et al. (2007), the response file returns 15% larger flux at the HXD nominal position pointing than the XIS flux. Therefore, we corrected the normalization of the HXD/PIN in the spectral analysis (3.2).
Figure 1 shows the time averaged HXD/PIN spectrum. The NXB model, the CXB model and the 4% level of the NXB are also plotted in the spectrum. The hard X-ray emission of J0746 was detected in the energy range from 12 keV to 24 keV, assuming the 4% accuracy of the current NXB model. Above 24 keV, the upper limit of flux could be derived from the accuracy of the NXB model. We also note here that the source was not detected in the GSO data.
3. Optical and Radio Observations
3.1. Hobby-Eberly Telescope (HET)
The optical spectra were obtained with the 9.2m Hobby-Eberly telescope (HET; Ramsey et al., 1998) Marcario Low Resolution Spectrograph (LRS; Hill et al., 1998). Observations were made from 2005 November 5 to November 6 covering 420–1000 nm at 1.6 nm resolution. The seeing was variable during the integrations and so spectrophotometry was not attempted. However, observations were taken with the slit along the parallactic angle and at constant air mass and, using white-light pre- and post- spectrum direct images, indicating that the source faded by 0.17 magnitudes between the observations. Using this information, we correct for the differential slit losses, adjusting the first (worse-seeing) spectrum to that of November 6. The resulting spectra are shown in Figure 2, after standard calibrations and correction for an estimated Galactic extinction of E(BV)=0.07.
Overall, the spectra do not differ dramatically from the spectrum of the blazar available from the SDSS archive. However, there is clearly a fading component in the continuum. In the first spectrum, a power-law fit to the continuum to the red of Ly gives ; during the second observation the continuum flux was , the residual slit losses leave a % uncertainty in the absolute fluxes. The broad-line flux is, as expected, nearly constant on this timescale, confirming the relative spectral normalization estimated from the direct images. The difference spectrum between the two epochs is nearly pure continuum, with a spectral index of 2–2.5, suggesting that a fading synchrotron component is contributing to the optical flux during the tail of the outburst. These two observations were obtained only a month after the observations reported by Sambruna et al. (2006), conducted on 2005 October 10 - also with the LRS on the HET - reported by Sambruna et al. (2006), and the continuum flux (at 6500 angstrom) is about twice of the average of the two of our flux measurements taken in November 2005.
3.2. Nordic Optical Telescope (NOT)
We carried out the photometric observations of J0746 at the 2.56 m Nordic Optical Telescope (NOT) at La Palma (Observatorio del Roque de los Muchachos, Canary Islands) on 2005 November 5 using ALFOSC (Andalucia Faint Object Spectrograph and Camera). The data have been reduced using the ”standard” IRAF procedures (de-biasing and flat-fielding were applied for all images) and the magnitudes were measured using IRAF/apphot-package. The magnitudes of the object and the comparison stars were measured using a relatively small aperture (about the size of the seeing disc) and the final brightness of the object via differential photometry. In order to flux calibrate the comparison stars, the magnitudes were measured using a large aperture (19″diameter). The brightnesses of the comparison stars were determined using two different techniques: (1) using the published SDSS g’and r’ magnitudes and transforming these magnitudes to V and R, respectively, (2) using Landolt standard stars (PG2213006 and Mark_A) (Landolt, 1992) observed earlier the night having about the same airmass as the target. Galactic extinction was corrected by using Schlegel, Finkbeiner & Davis (1998). The R-band and the V-band photometric measurements were made with an exposure of 200 seconds. The R-band and V-band fluxes of J0746 were 18.9 and 19.2 magnitudes, respectively. The detailed results are given in Table 2.
3.3. The Very Large Array (VLA)
We observed J0746 with the Very Large Array (VLA) between 11:25 and 13:25 UT on 2005 November 3, at the end of the reconfiguration period from DnC array to D array. In D configuration, the most compact array, the maximum baseline is 1.03 km. A total of 22 antennas were available for the observations, which were made at 1.425, 4.860, 8.460, 14.940, 22.460 and 43.340 GHz. 3C138 (J0521+1638) was used as the primary flux density calibrator. J0746 was observed in three blocks, with each block containing a 170 second scan at each frequency. Between each block, a similar block of observations of 3C138 was carried out, using scans of 100 seconds. The 15, 22 and 43 GHz scans, for both J0746 and 3C138, were preceded by a 270 second pointing scan on source at 8 GHz to determine a pointing offset for the higher frequencies, following the standard VLA reference pointing procedure.
The data were amplitude calibrated in AIPS using the scans on 3C138 to set the flux density scale. At the three highest frequencies the source models for 3C138, supplied with the data, were used. After amplitude calibration the data were written out and read into Difmap. After initial phase self-calibration, the data were modeled by a point source. Inspection of the correlated flux density as a function of () distance confirmed this assumption was valid at all frequencies for J0746 in this array configuration. The individual scans were also independently model-fit, but no evidence for significant variability over the 2 hour period was apparent. The results are given in Table 3.
The 1.4 GHz flux density is almost 10% less than measurements from 10 years earlier in the NVSS (Condon et al., 1998) and FIRST (Becker et al., 1995) catalogs, however the 4.9 GHz flux density is significantly higher than the 0.480.04 Jy in the GB6 (Gregory et al., 1996) catalog. The inverted spectrum between 1.4 and 4.9 GHz, 0.56 ( suggests the presence of strong self-absorption at the lowest frequency. Above 4.9 GHz the spectral index is 0.40, although the 15 GHz and, to a lesser extent, 22 GHz flux densities deviate from a single spectral index fit.
4. Analysis and Results
4.1. Temporal analysis
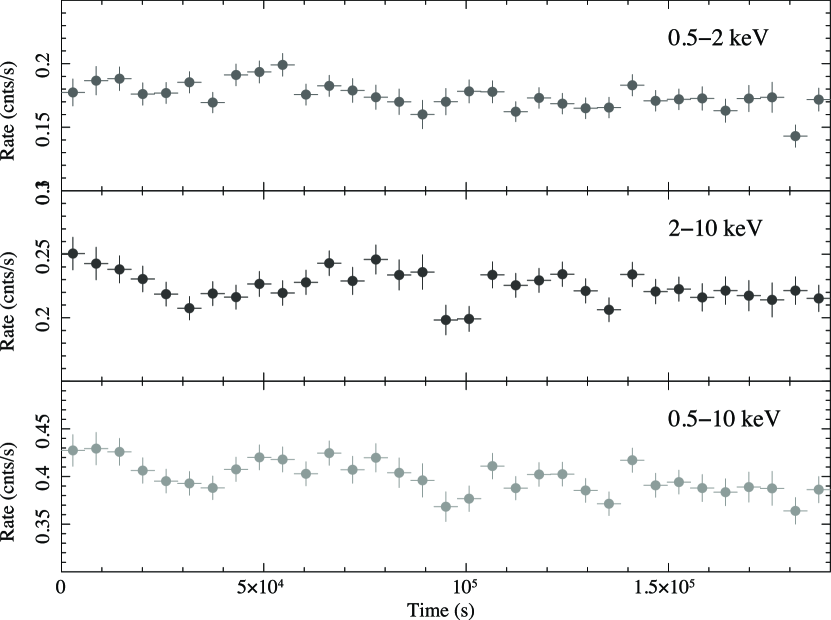
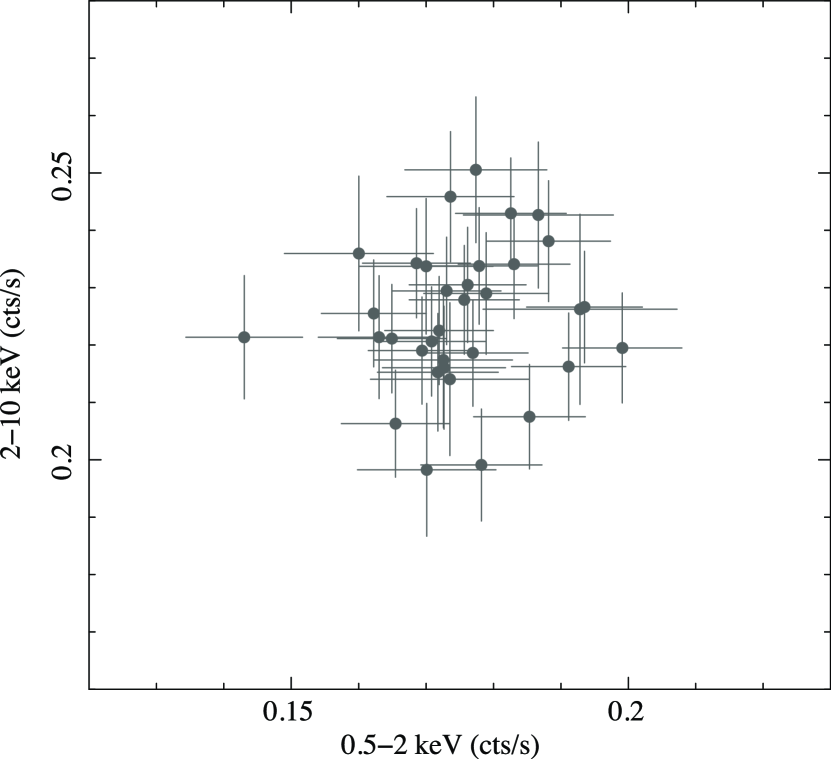
Figure 3 shows the averaged light curves of the XIS/FIs in three energy bands: 0.5–2 keV ( panel), 2–10 keV ( panel), and total (0.5–10 keV; panel), respectively. Since the count rate variations of the HXD/PIN detector were less clear due to limited photon statistics and uncertainly of the NXB modeling, in the following we concentrate on the temporal variability of the XIS data only, below 10 keV. Figure 4 compares the count-rate correlation between the soft X-ray (0.5–2 keV) and the hard X-ray energy bands (2–10 keV). We can see that there is no significant correlation between the soft X-ray flux and the hard X-ray flux, which indicates that the variability in the soft and hard X-ray bands are not well synchronized. Although X-ray light curve shows some variability, it is not nearly as strong as that measured by , where Sambruna et al. (2006) reported that the XRT detected a factor of flux change in a few hours. We try to evaluate the variability by calculating the variability amplitude relative to the mean count rate corrected for effects of random errors (e.g., Edelson et al., 2002): , where is the total variance of the light curve, is the mean error squared and is mean count rate. The variability amplitude of J0746 is and , and the energy-dependence of variability is flat.
4.2. Spectral Analysis
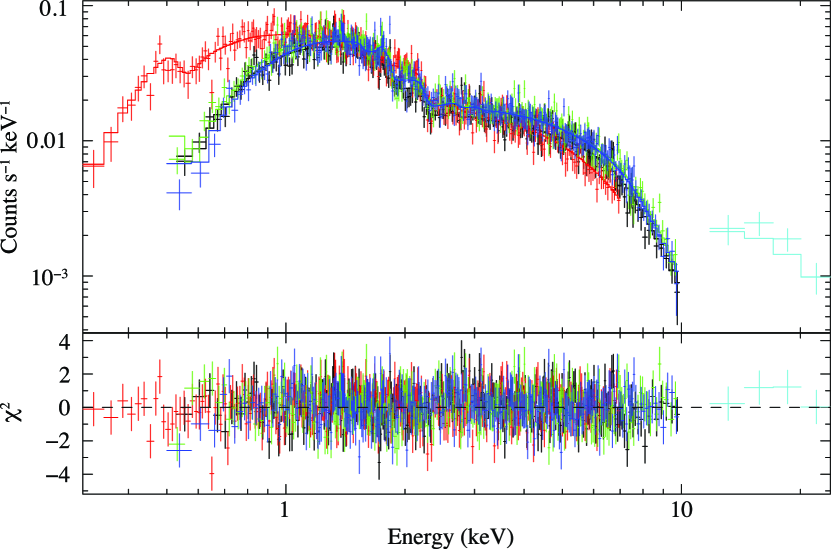
The XIS and HXD/PIN background subtracted spectra were fitted using XSPEC v11.3.2, including data within the energy range 0.3–24 keV. The Galactic absorption toward J0746 is taken to be = 4.04 1020 cm-2 (Dickey & Lockman, 1990). Note that our best-fitting value for the column density, cm-2 (Table 4), which is approximately consistent with the Galactic value and there is no significant excess absorption. All errors are quoted at the 68.3% (1) confidence level for the parameters. The fits are restricted to the energy range 0.5–10 keV (XIS 0, 2, 3: FI chips), 0.3–7 keV (XIS 1: BI chip) and 11–24 keV (HXD/PIN), respectively. In the following analysis, we fixed the relative normalization of the XISs and PIN at 1.15 (see 2.1.1).
Figure 5 () shows four XISs and HXD/PIN background-subtracted spectra with residuals to the power-law with the Galactic column density, determined using the data from 0.3 keV to 24 keV (model 1). We obtained the photon index of =1.17, but this model did not represent the spectra well yielding a /dof of 1238/1112. Some scatter in the residual panel in Figure 5 () indicates that the spectral normalization among the XISs is not constant. To represent the shape of the observed X-ray spectra, we adjusted the normalization factor among the four XISs relative to XIS 0 (model 2). Since Serlemitsos et al. (2007) reported that the spectral normalizations are slightly (a few percent) different among the CCD sensors based on the contemporaneous fit of the Crab spectra, the few percent adjustment of the relative normalization is reasonable. This model well reproduced the spectra with the best /dof of 1113/1109 (Figure 5: ). For this model the photon index is with Galactic absorption, and the 2–10 keV flux of XIS0 is (3.07 0.03) 10-12 erg cm-2 s-1. This corresponds to the XRT flux of erg cm-2 s-1. All of the spectral fitting results are summarized in Table 4. We conclude that the X-ray spectra of J0746 within the energy range 0.3–24 keV are well described by an extremely hard power-law () with the Galactic absorption.
4.3. Spectral energy distribution
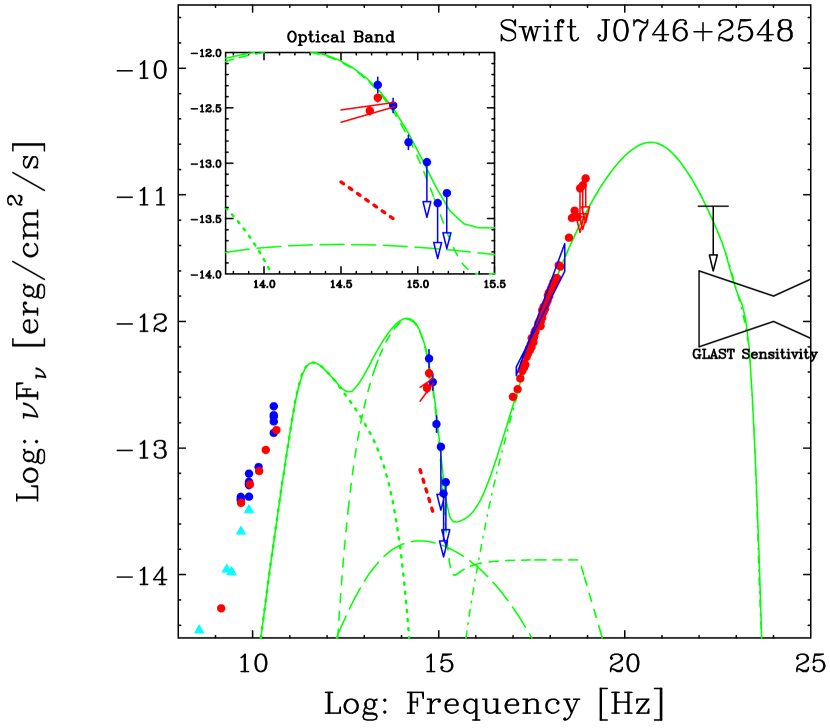
Figure 6 shows the spectral energy distribution (SED) of J0746 during the 2005 November campaign. Blue and red represent simultaneous data of the radio, UV, optical and X-ray observations. Historical data taken from radio (NED), and -ray (EGRET upper limit; Sambruna et al., 2006) observations are also plotted in cyan and black, respectively. Figure 6 implies that the synchrotron component of J0746 most likely peaks around Hz in the observer frame. Meanwhile, UVOT data show the steep optical-UV emission as the high-energy tail of the “blue bump” which is thought to be produced via thermal emission by the accretion disk and/or corona near the central black hole of J0746 (Sun & Malkan, 1989). Apparently, these optical-UV data do not join smoothly with the X-ray-to--ray spectrum, which is likely due to the nonthermal External Compton jet radiation (ERC) or due to synchrotron-self-Compton emission (SSC) (e.g., Ballo et al., 2002).
In order to model the SED of J0746, we applied the synchrotron-inverse Compton (IC) emission model described in Maraschi & Tavecchio (2003), where both synchrotron and external photons are considered as seed radiation fields contributing to the IC process. The electron distribution is modeled as a smoothed broken power-law;
| (1) |
where (cm-3) is a normalization factor, and are the spectral indices below and above the break Lorentz factor . The electron distribution extends within the limits .
We assume that the blazar radiation originates in a region located at a distance from the black hole, well within the Broad Line Region but sufficiently far above the accretion disk that the radiation energy density from the latter can be neglected. The external radiation field can then be simply modeled,
| (2) |
where is the size of the broad-line-region.
Figure 6 shows the best-fit model for J0746 data, combining of the synchrotron, the SSC, and the ERC components (Tavecchio & Ghisellini, 2008), plus the blue bump emission. The spectrum can be completely fitted with the model parameters; the emission region is modeled as a sphere with radius cm moving with a bulk Lorentz factor at an angle rad between the line of sight and the jet axis, and filled by tangled magnetic field G and relativistic electrons. The Doppler beaming factor is . Parameters of the electron distribution are , , , , , respectively. The size of the BLR is assumed to be cm, and the luminosity of broad emission lines ergs s-1. The disk blue bump has a luminosity ergs s-1 and temperature eV (redshifted temperature 2.5 eV).
5. Discussion
5.1. results of J0746
In previous sections, we presented temporal and spectral analysis of observation of J0746 in 2005 November. Using the high-sensitivity, broadband instruments onboad , we found the following characteristics of J0746: (1) The variability amplitude of soft (0.5–2 keV) and hard (2–10 keV) bands are both . There seems to be no significant energy-dependence of the variability. (2) The observed X-ray spectrum is well-described by a hard power-law () with the Galactic absorption. Thanks to the good photon statistics and spectral response of XIS, we clearly confirmed that J0746 has an intrinsically hard spectrum and can exclude the possibility that the spectral hardening results from the excess absorption as reported by Sambruna et al. (2006). Such differences of the spectrum between and are probably due to (1) low statistics of XRT compared to , and (2) Sambruna et al. (2006) combining the X-ray spectra obtained at 4 different epochs, with different exposures. The observed photon index is extremely hard, similar to those observed in several high-luminosity blazars (e.g., Tavecchio et al., 2000). As long as the X-ray emission is due to the low-energy end of the ERC spectral component, the observed photon index corresponds to the electron distribution , where is the Lorentz factor of the ultrarelativisitic electrons. A likely explanation of such a flat electron distribution is discussed by Sikora et al. (2002) who assume a two-step acceleration process: the harder portion is produced by a pre-acceleration mechanism, e.g., involving instabilities driven by shock-reflected ions (Hoshino et al., 1992) or magnetic reconnection (Romanova & Lovelace, 1992), while the high energy tail by the standard first-order Fermi process operating over the shock front.
5.2. Constraint on Bulk Compton emission
As the cold electrons/positrons, before reaching the blazar dissipative site, are transported from the black hole vicinity by a jet with a bulk Lorentz factor 10–20, they upscatter the accretion disk and broad emission line photons to energies
| (3) |
where eV. This is expected to produce a hump in the X-ray spectra of blazars with luminosity
| (4) |
where and is the number of electrons enclosed in the jet within a distance range corresponding with the scale of the broad emission line region.
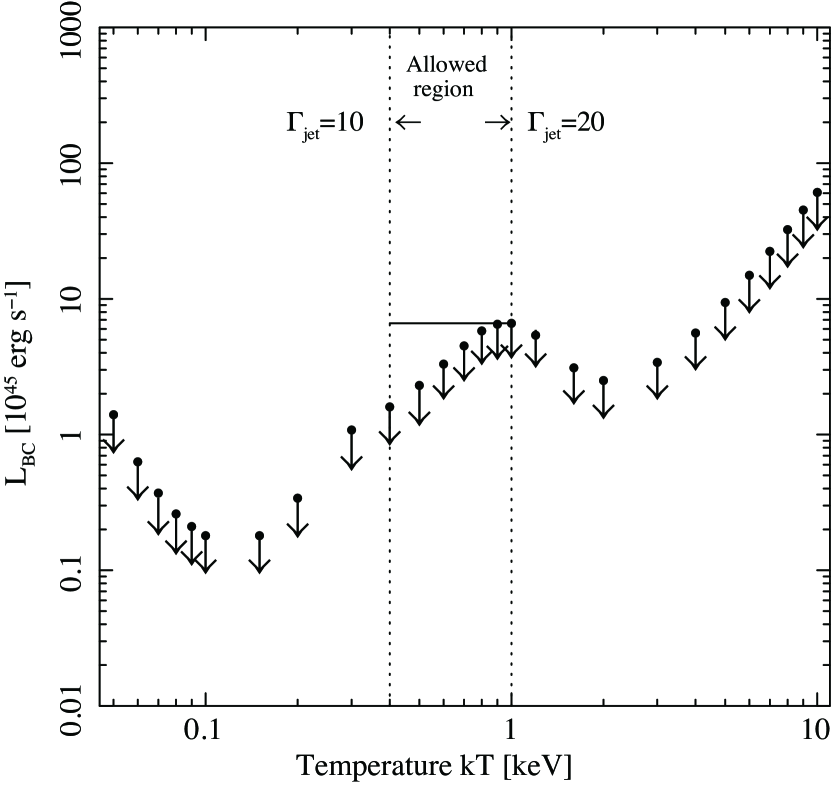
For our observation of J0746, the soft X-ray excess which would indicate the BC feature is not detected. However, since the observation of J0746 was performed in a relatively low state with an average flux of erg cm-2 s-1, we can put a stringent upper limit on the BC emission. The limit is presented in Figure 7. It is obtained using data fitted with power-law determined in § 4.2 plus black-body approximation of the bulk-Compton component. As an example, a comparison between the model and the data is shown in Figure 8, and, some of the fitting results are also listed in Table 4 (model 3-1 and model 3-2). In Figure 7, the marked ’allowed region’ corresponds with a temperature range = 0.40–1.0 keV which, in turn, corresponds with 10–20. In this region the upper limit of BC luminosity is erg s-1 .
It should be noted here that in the case of the popular internal shock model (e.g., Spada et al., 2001) the bulk-Compton radiation is produced by two cold inhomogeneities/shells. In this case production of any nonthermal flare by the internal shock should be proceded by a pair of X-ray precursors: one produced by a faster shell at larger energies and lasting shorter; and one produced by a slower shell at lower energies and lasting longer. Radiative bulk-Compton features from such systems are very complex, are variable and depend on the model details (Moderski et al., 2004). However, a small amplitude of variability in J0746 (see Figure 3) suggests that if the primary dissipative events are driven by internal shocks, what we observe is an overlap of radiation contributed by several shocks. Then the upper limits for the bulk-Compton emission calculated using the ’steady state’ may be a reasonable approximation.
5.3. Constraint on particle content in the jet of J0746
Noting that the energy flux carried by the cold electrons is
| (5) |
where is the cross-section radius of a jet, one can find after combining Eq. (4) and Eq. (5) that
| (6) |
For the upper limit for given by data (see § 5.2) this gives
| (7) |
Meanwhile, the ERC modeling of J0746 presented in the previous section ( 4.3) implies the jet power carried by the ultrarelativisitic (non-thermal, or ’hot’) electrons erg s-1, where is the average random Lorentz factor of electrons/positrons. However, if a jet is free of protons and the only source of the energy is the bulk energy of cold pairs, then from the energy conservation one can deduce that . This is in a clear disagreement with the obtained upper limit for and the model value of .
Such situation may be avoided if one assumes that there are cold protons which carry significant power . In this case , and, provided that jet kinetic luminosity , the pair content reads as
| (8) |
Noting that the luminosity of the observed high energy (-ray) emission can be related to the jet kinetic luminosity via the relation , where is the efficiency of the high energy -ray production, we finally find that the upper limit for the pair content of the J0746 jet is
| (9) |
For J0746, we only have an upper limit on the gamma-ray flux of erg s-1. With this, and erg s-1, we obtained . This may indicate a rather low pair content in quasar jets. However, it should be noted that J0746 has an exceptionally hard X-ray spectrum. For blazars with softer X-ray spectra a lack of bulk-Compton features put weaker constraints, tens, But the inertia of such jets is still dominated by protons (Sikora & Madejski, 2000).
6. Summary
We have presented a detailed analysis of observation for the radio-loud quasar J0746 at in 2005 November. Our results are the following:
-
1.
The variability amplitude of soft and hard bands as measured by is equivalent and there is no significant energy-dependence of the variability, in contrast to the much larger (factor of 2) variability reported from the Swift data.
-
2.
The observed X-ray spectrum of J0746 is well-described by a single, extremely hard power-law () with the Galactic absorption; we do not require spectral hardening at the lowest energies seen by Sambruna et al. (2006). With this, we can exclude excess absorption (which would otherwise have to be rapidly variable!) to cause the spectral hardening, one of the possibilities considered by Sambruna et al. (2006).
-
3.
A lack of bulk Compton features in the X-ray spectra indicates a low electron-positron pair content and strong dominance jet inertia by protons.
References
- Barthelmy et al. (2005) Barthelmy, S. D., et al. 2005, Space Sci. Rev., 120, 143
- Ballo et al. (2002) Ballo, L., et al. 2002, ApJ, 567, 50
- Becker et al. (1995) Becker, R. H., White, R. L., & Helfand, D. J. 1995, ApJ, 450, 559
- Begelman & Sikora (1987) Begelman, M. C., & Sikora, M. 1987, ApJ, 322, 650
- Celotti, Ghisellini & Fabian (2007) Celotti, A., Ghisellini, G., & Fabian, A. C. 2007, MNRAS, 375, 417
- Condon et al. (1998) Condon, J. J., Cotton, W. D., Greisen, E. W., Yin, Q. F., Perley, R. A., Taylor, G. B., & Broderick, J. J. 1998, AJ, 115, 1693
- Dermer & Schlickeiser (1993) Dermer, C. D., & Schlickeiser, R. 1993, ApJ, 416, 458
- Dickey & Lockman (1990) Dickey, J. M., & Lockman, F. J. 1990, ARA&A, 28, 215
- Edelson et al. (2002) Edelson, R., Turner, M. J. L.,Pounds, K., Vaughan, S., Markowitz, A., Marshall, H., Dobbie, P., & Warwick, R. 2002, ApJ, 568, 61
- Fossati et al. (1998) Fossati, G., Maraschi, L., Celotti, A., Comastri, A., & Ghisellini, G. 1998, MNRAS, 299, 433
- Ghisellini et al. (1998) Ghisellini, G., Celotti, A., Fossati, G., Maraschi, L., & Comastri, A. 1998, MNRAS, 301, 451
- Gregory et al. (1996) Gregory, P. C., Scott, W. K., Douglas, K., & Condon, J. J. 1996, ApJS, 103, 427
- Gruber et al. (1999) Gruber, D. E., Matteson, J. L., Peterson, L. E., & Jung, G. V. 1999, ApJ, 520, 124
- Hill et al. (1998) Hill, G.J., Nicklas, H.E., MacQueen, P.J., Tejada, C. Cobos Duenas, F.J. & Mitsch, W. 1998, Proc. SPIE, 3355, 375
- Hoshino et al. (1992) Hoshino, A., Arons, J., Gallant, Y. A., & Langdon, A. B. 1992, ApJ, 390, 454
- Jorstad et al. (2005) Jorstad, S. G., et al. 2005, AJ, 130, 1418
- Landolt (1992) Landolt, A. 1992, AJ, 104, 340
- Maraschi & Tavecchio (2003) Maraschi, L., & Tavecchio, F. 2003, ApJ, 593, 667
- Malkan & Moore (1986) Malkan, M. A., & Moore, R. L. 1986, ApJ, 300, 216
- Mitsuda et al. (2007) Mitsuda, K., et al. 2007, PASJ, 59, 1
- Mizuno et al. (2006) Mizuno, T., et al. 2006, Suzaku Memo, JX-ISAS-SUZAKU-MEMO-2006-42
- Moderski et al. (2004) Moderski, R., Sikora, M., Madejski, G. M., & Kamae, T. 2004, ApJ, 611, 770
- Kataoka et al. (2008) Kataoka, J., et al. 2008, ApJ, 672, 787
- Kokubun et al. (2007) Kokubun, M., et al. 2007, PASJ, 59, 53
- Koyama et al. (2007) Koyama, K. et al. 2007, PASJ, 59, S23
- Kubo et al. (1998) Kubo, H., Takahashi, T., Madejski, G., Tashiro, M., Makino, F., Inoue, S., & Takahara, F. 1998, ApJ, 504, 693
- Pian & Treves (1993) Pian, E. & Treves, A. 1993, ApJ, 416, 130
- Ramsey et al. (1998) Ramsey, L.W. et al. 1998, Proc. SPIE, 3352, 34
- Romanova & Lovelace (1992) Romanova, M. M., & Lovelace, R. V. E. 1992, A&A, 262, 26
- Sambruna et al. (2006) Sambruna, R., et al. 2006, ApJ, 646, 23
- Spada et al. (2001) Spada, M., Ghisellini, G., Lazzati, D., & Celotti, A. 2001, MNRAS, 325, 1559
- Schlegel, Finkbeiner & Davis (1998) Schlegel, D. J., Finkbeiner, D. P., & Davis, M. 1998, ApJ, 500, 525
- Serlemitsos et al. (2007) Serlemitsos, P. J., et al. 2007, PASJ, 59, 9
- Sikora et al. (1994) Sikora, M., Begelman, M. C., & Rees, M. J., 1994, ApJ, 421, 153
- Sikora & Madejski (2000) Sikora, M. & Madejski, G. M. 2000, ApJ, 534, 109
- Sikora et al. (2002) Sikora, M., Błażejowski, M., Moderski, R., & Madejski, G. M. 2002, ApJ, 577, 78
- Sokolov & Marscher (2005) Sokolov, A., & Marscher, A.P. 2005, ApJ, 629, 52
- Sun & Malkan (1989) Sun, W.-H., & Malkan, M. A. 1989, ApJ, 346, 68
- Takahashi et al. (2007) Takahashi, T. et al. 2007, PASJ, 59, S35
- Tavecchio et al. (2000) Tavecchio, F., et al. 2000, ApJ, 543, 535
- Tavecchio & Ghisellini (2008) Tavecchio, F., & Ghisellini, G. 2008, MNRAS, 386, 945
- Ulrich, Maraschi & Urry (1997) Ulrich, M-H., Maraschi, L., & Urry, C. M. 1997, ARA&A, 35, 445
- Urry & Padovani (1995) Urry, C. M., & Padovani, P. 1995, PASP, 107, 803
- Watanabe et al. (2007) Watanabe, S., et al. 2007, Suzaku Memo, JX-ISAS-SUZAKU-MEMO-2007-01
| Start (UT) | Stop (UT) | Exposure (ks) | Exposure (ks) |
|---|---|---|---|
| XIS | HXD/PIN | ||
| Nov. 04 08:20 2005 | Nov. 06 14:04 2005 | 100.5 | 74.0 |
| Band | Flux (mag) | stdaaStandard deviation of the target brightness estimates. | photerrbbThe apphot error estimate for the target. | calibrationcc (1): using the published SDSS g’r’ magnitudes and transforming these magnitudes to V and R. (2): using Landolt standard stars (PG2213006 and Mark_A). | exposure (second) | time (UT) |
|---|---|---|---|---|---|---|
| R-band | 18.888 | 0.006 | 0.011 | (1) | 200 | 2005 November 5 |
| 18.937 | 0.017 | 0.011 | (2) | 05:38:37 | ||
| V-band | 19.232 | 0.024 | 0.010 | (1) | 200 | 2005 November 5 |
| 19.233 | 0.005 | 0.010 | (2) | 05:44:05 |
| Frequency (GHz) | Flux density (Jy) |
|---|---|
| 1.425 | 0.38 |
| 4.860 | 0.76 |
| 8.460 | 0.61 |
| 14.940 | 0.44 |
| 22.460 | 0.43 |
| 43.340 | 0.32 |
| Component | Parameter | model 1 | model 2 | model | model 3-1 | model 3-2 |
|---|---|---|---|---|---|---|
| Absorption | (cm-2) | 4.04 (fixed) | 4.04 (fixed) | 4.890.50 | 4.04 (fixed) | 4.04 (fixed) |
| Power-law | 1.170.01 | 1.180.01 | 1.200.01 | 1.17 (fixed) | 1.17 (fixed) | |
| ( erg s-1 cm-2) | 3.100.02 | 3.070.03 | 3.060.04 | 3.080.02 | 3.050.04 | |
| Constant | XIS 0 | 1.00 (fixed) | 1.00 (fixed) | 1.00 (fixed) | 1.00 (fixed) | 1.00 (fixed) |
| XIS 1 | 1.00 (fixed) | 0.910.01 | 0.910.01 | 1.00 (fixed) | 1.00 (fixed) | |
| XIS 2 | 1.00 (fixed) | 1.040.01 | 1.040.01 | 1.00 (fixed) | 1.00 (fixed) | |
| XIS 3 | 1.00 (fixed) | 1.050.01 | 1.050.01 | 1.00 (fixed) | 1.00 (fixed) | |
| HXD/PIN | 1.15 (fixed) | 1.15 (fixed) | 1.15 (fixed) | 1.15 (fixed) | 1.15 (fixed) | |
| Black-Body | Temperature (keV) | - | - | - | 0.4 (fixed) | 1.0 (fixed) |
| (Bulk-Compton) | Luminosity( erg s-1) | - | - | - | 0.8 (0.0–1.6) | 3.9 (1.0–6.6) |
| /d.o.f () | 1238/1112 (1.11) | 1113/1109 (1.00) | 1110/1108 (1.00) | 1238/1112 (1.11) | 1237/1112 (1.11) |
Note. — Errors correspond to 1 confidence level.