Properties of second generation stars in Globular Clusters11affiliation: Written version of a contributed talk presented at the conference “Chemical Evolution of Dwarf Galaxies and Stellar Clusters”, Garching bei München, Germany, July 21-25, 2008
Abstract
We present the first results from the analysis of GIRAFFE spectra of more than 1200 red giants stars in 19 Galactic Globular Clusters (GCs), to study the chemical composition of second generation stars and their link with global cluster parameters. We confirm that the extension of the Na-O anticorrelation (the most striking signature of polluted, second generation populations) is strictly related to the very blue (and hot) extreme of the Horizontal Branch (HB). Long anticorrelations seem to require large mass and large-sized, eccentric orbits, taking the GCs far away from the central regions of the Galaxy. We can separate three populations in each cluster (primordial, intermediate and extreme) based on the chemical composition. In all GCs we observe a population of primordial composition, similar to field stars of similar metallicity. We find that in all GCs the bulk (from 50 to 70%) of stars belong to the intermediate component. Finally, the extreme, very oxygen-poor component is observed preferentially in massive clusters, but is not present in massive GCs.
1 Introduction
Galactic Globular Clusters (GCs) show a series of star-to-star abundance variations for several light elements. Part of them (Li, C, N) show the same behavior in field stars, some others (O, Na, Mg, Al) show a behavior peculiar to GCs. In particular, there are anticorrelations between O and Na, Al and Mg: they are present in all evolutionary phases sampled (both unevolved main sequence and evolved red giant branch stars) in all GCs studied so far (for a recent review see Gratton, Sneden & Carretta 2004).
The fact that these anticorrelations are present also in unevolved stars (Gratton et al. 2001, Ramirez & Cohen 2002, Carretta et al. 2004), unable to activate the required nucleosynthetic chains (p-capture in H burning at very high temperatures, e.g. Denisenkov & Denisenkova 1989) implies that they have been imprinted in the gas by a previous generation and that we are seing a second generation of stars in these GCs. We do not yet know what kind of stars produced the pollution; the most popular candidates are intermediate-mass AGB stars (e.g. D’Antona & Ventura 2007), or very massive, rotating stars (e.g.Decressin et al. 2007).
The Na-O anticorrelation is also stricly connected to the helium abundance (Na-rich, O-poor stars should also be He-rich) and to the multiple sequences that have been recently found in some GCs ( Cen, NGC 2808, see Bedin et al. 2004 and Piotto et al. 2007, respectively) and attributed to populations with different Y.
There are currently data on more than 1400 stars, in about 20% of known GCs, thanks to the efforts of many researchers, in primis the Lick-Texas group, lead by Chris Sneden and Robert Kraft; our group is now one of the main contributors, with more than 1200 stars analyzed. The bottom line is that we can stop talking about ”abundance anomalies” and we must start speaking about the normal chemical composition of second generation stars in GCs. Times are ripe to start a more quantitative approach.
Therefore, with the goal of understanding what is the relation between these abundance patterns and the horizontal branch (HB) morphology or structural parameters of the GCs, we have conducted an homogeneous survey of RGB stars in 19111 NGC 104, NGC 288, NGC 1904, NGC 2808, NGC 3201, NGC 4590, NGC 5904, NGC 6121, NGC 6171, NGC 6218, NGC 6254, NGC 6388, NGC 6397, NGC 6441, NGC 6752, NGC 6809, NGC 6838, NGC 7078, and NGC 7099 Galactic GCs using the multiobject spectrograph FLAMES@VLT. We obtained Giraffe spectra (at R20000, comprising the Na I 568.2-568.8nm, 615.4-6.0nm and [O I] 630nm lines) of about 100 stars per cluster, and UVES spectra (at R40000, covering the 480-680nm region) of about 10 to 14 stars per cluster.
We have targeted GCs with [Fe/H] ranging from to dex, with very different HB morphology (stubby red HB, blue HB, very extendend blue HB, bimodal HB), and very different global parameters (total mass, concentration, age, orbit, etc.).
We have determined atmospheric parameters and measured Fe, O, and Na abundances for more than 2000 stars (of which more than 1200 cluster members and with O and Na detected.
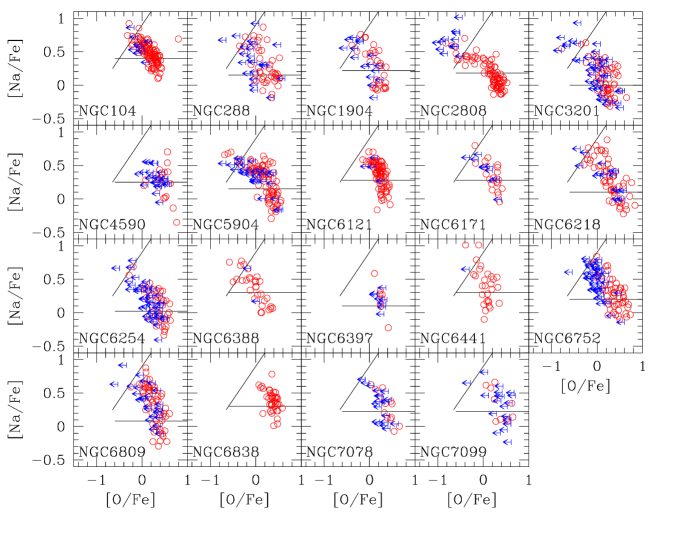
In Fig. 1 we show a collage of the Na-O anticorrelations observed in all 19 clusters in our sample. Solid lines separate the Primordial, Intermediate and Extreme populations, discussed below.
The number of stars measured in each cluster depends on the richness of population, metallicity, S/N ratio and in some cases on field stars contamination, as in the case of the bulge clusters NGC 6388 and NGC 6441, or the disk cluster NGC 6171.
2 Extension of the Na-O anticorrelation and (blue) HB
As a way to quantify the extension of the anticorrelation, we adopted the interquartile range (the middle 50% of the data) of the [O/Na] distribution. This was suggested by Carretta (2006) as the best indicator, because it is not much sensitive to the ouliers in the distribution.
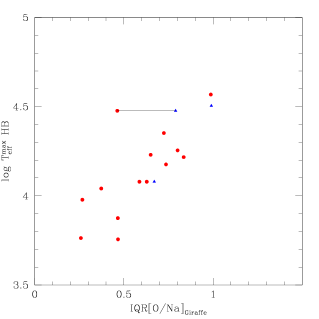
The most tight correlation we found (shown in Fig. 2) is between the extension of the Na-O anticorrelation (well measured by the Inter-Quartile range IQR[O/Na]) and of the HB (measured by the maximum Teff reached on the HB). This has been first demonstrated by Carretta et al. (2007d) on a subsample of our 19 GCs and literature data, and amply confirmed on our whole sample. In Fig. 2 the red dots are for our data, the blue triangles for literature data: M 15 (Sneden et al. 1997), NGC 362 (Shetrone & Keane 2000), and M 13 (Sneden et al. 2004, Cohen & Melendez 2005).
M 15 is somewhat uncertain: the value from literature falls very well on the relation defined by all other clusters, while our value is more discrepant: maybe we missed some very O-poor stars, difficult to measure at this very low metallicity. The Spearman rank coefficient tells us that the probability to get such a tigh relation only by chance is negligible, ranging from 1 in 10-3 if we include our value for M 15, down to 1 in 10-5 or 4 in 10-6 excluding M 15 or taking the Lick value.
We conclude that this is a real, very strong relation: the first conclusion we can draw is that a same mechanism drives/affects the extent of the pollution on the RGB and the morphology of the bluest end of the HB.
Notice, however, that this can be only considered second parameter: the global distribution of stars on the HB (as indicated e.g., by the HB ratio (B+R)/(B+R+V) -see Harris 1996 and web updates) is correlated with the IQR[O/Na], i.e. with the extension of the Na-O anticorrelation.
3 Relations with structural and orbital parameters
We also found a good correlation between the IQR[O/Na] and the total mass (or absolute magnitude MV) of the GCs (see Fig. 3): an high mass seems to be a requisite for an extended anticorrelation.
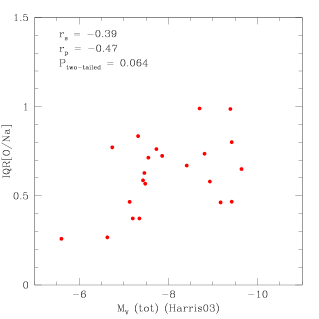
This may be explained by a better capability of the cluster to retain the gas polluted by the first-generation stars to form the second-generation stars in which we measure the anticorrelated Na and O. However, high mass is not a sufficient condition: 47 Tuc is a notable counter-example. This cluster simply does not show very O-poor stars and presents a short/normal Na-O anticorrelation even if it is a very massive object. Some other factors must be involved. On the other hand, we note that the position of GCs standing leftward of the main relation (namely NGC 288, NGC 6218 and M 71) is more easily explainable by the fact that they may have lost a (probably large) fraction of their mass in the past.
We explored the relations with orbital parameters, as first suggested by Carretta (2006), and performed simple bivariate correlations, adding to the cluster absolute magnitude a dependence on the cluster orbital parameters. In Fig. 4 we show the IQR[O/Na] as a function of a combination of MV and the eccentricity of the orbits, whenever available (Dinescu et al. 1999).
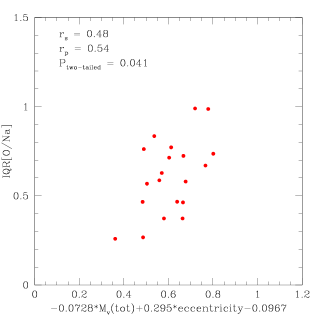
When we combine mass (magnitude) and orbital parameters the relations get tighter and statistically more significant. More importantly, 47 Tuc does not stand out at all in this plot, and is now virtually indiscernible from the other clusters. The same holds using other orbital parameters (as total energy, or period of the orbit, or maximum height over the plane).
We consider these results as an indication that also the initial position and the time spent away from possible perturbations affect the possibility of a GC to build a gas reservoir from which the second-generation stars are born.
4 The fraction of stars with Primordial, Intermediate and Extreme composition
The ratio of first to second-generation stars is very useful to put constraints on the formation scenario. We assume as first-generation stars (or primordial, P) those with O and Na similar to field stars of same metallicity. We divide the second-generation stars according to the pollution degree in Intermediate (I) and Extreme (E: those with [O/Na] dex, from a comparison with the distribution in NGC 2808, see Carretta et al. 2006)
We have applied this operative division to all the 19 GCs in our sample. The lines separating the three components are shown in Fig. 1. From this figure and computing the fraction of stars in each component we found that:
-
•
the Primordial population is present in all GCs.
-
•
the Intermediate 2nd generation constitutes the bulk (50-70%) of stars.
-
•
the Extreme 2nd generation is not present in all GCs.
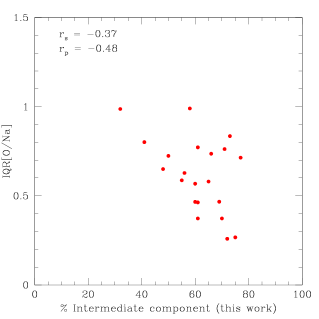
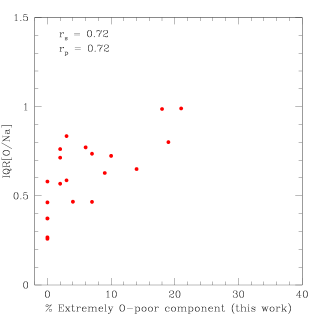
The fraction of Intermediate and Extreme second generation stars are anticorrelated, and the Intermediate population is anticorrelated with the IQR([O/Na] (Fig. 5) since, by definition, the extension of the Na-O anticorrelation is driven by the Extreme population (Fig. 6).
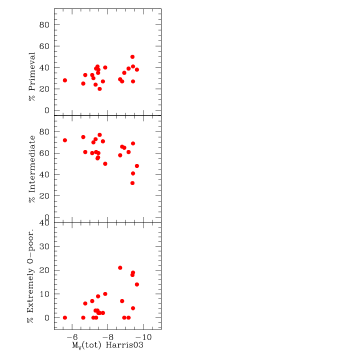
When the fractions of the three components are plotted total mass (measured by total MV, Fig. 7), we see that less Primordial stars are lost by the more massive clusters, as expected. As with the IQR[O/Na], the Extreme population is more pronounced in heavier GCs, but the relation is not one-to-one.
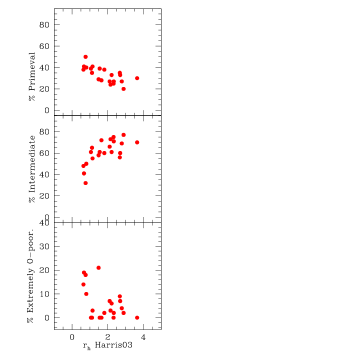
The relations (also shown in Fig. 7) with half-mass radius () are very tight, indicating that the shape of the anticorrelation was inprinted in the early phases of the cluster life, since is one of the parameters less sensitive to changes due to the cluster evolution, both internal and due to external sources. More detailed studies, involving multivariate analysis, are under way.
At the moment, our preliminary findings can be summarized as follows:
-
•
the extent of the Na-O anticorrelation is strictly related only to the very blue and hot extreme of the HB
-
•
long anticorrelations are seen in clusters with both high mass favourable orbital parameters, taking them for long periods away from the central regions of the Galaxy
-
•
in all GCs there is a surviving population of stars of primordial composition, but
-
•
the bulk of the stellar population in GCs is composed of stars with intermediate degrees of pollution
-
•
finally, an extremely O-poor component is observed only in some clusters and at the moment is not entirely clear why.
In the near future we will present the full analysis of the clusters not already published222We published results on: NGC 2808 (Carretta et al. 2006), NGC 6441 (Gratton et al. 2006, 2007), NGC 6752 (Carretta et al. 2007a), NGC 6218 (Carretta et al. 2007b), NGC 6838 (Carretta et al. 2007c). , a systematic study of the properties of second generation stars and their relations with global cluster parameters and the relation between the Na-O anticorrelation and HB morphology (Carretta et al. 2009a,b and Gratton et al. 2009, in preparation, respectively).
References
- (1) Bedin, L.R., Piotto, G., Anderson, J., Cassisi, S., King, I.R., Momany, Y., Carraro, G. 2004, ApJ, 605, L125
- (2) Carretta, E. 2006, AJ, 131, 1766
- (3) Carretta, E., Bragaglia, A., Gratton R.G., Leone, F., Recio-Blanco, A., Lucatello, S. 2006, A&A, 450, 523
- (4) Carretta, E., Bragaglia, A., Gratton R.G., Lucatello, S., Momany, Y. 2007a, A&A, 464, 927
- (5) Carretta, E., Gratton R.G., Bragaglia, A., Bonifacio, P. & Pasquini, L. 2004, A&A, 416, 925
- (6) Carretta, E., Recio-Blanco, A., Gratton, R.G., Piotto, G., Bragaglia, A. 2007d, ApJ, 671, L125
- (7) Carretta, E., et al. 2007b, A&A, 464, 939
- (8) Carretta, E., et al. 2007c, A&A, 464, 967
- (9) Cohen, J.G., Melendez, J. 2005, AJ, 129, 303
- (10) D’Antona, F., Ventura, P. 2007, MNRAS, 379,1431
- (11) Decressin, T., Meynet, G., Charbonnel C. Prantzos, N., Ekstrom, S. 2007, A&A, 464, 1029
- (12) Denisenkov, P.A., Denisenkova, S.N. 1989, A.Tsir., 1538, 11
- (13) Dinescu, D.I., Girard, T.M., van Altena, W.F. 1999, AJ, 117, 1792
- (14) Gratton, R.G., Bonifacio, P., Bragaglia, A., et al. 2001, A&A, 369, 87
- (15) Gratton, R.G., Lucatello, S., Bragaglia, A., Carretta, E., Momany, Y., Pancino, E., Valenti, E. 2006, A&A, 455, 271
- (16) Gratton, R.G., Sneden, C., Carretta, E. 2004, ARA&A, 42, 385
- (17) Gratton, R.G., et al. 2007, A&A, 464, 953
- (18) Harris, W. E. 1996, AJ, 112, 1487
- (19) Piotto G., et al. 2007, ApJ, 661, L53
- (20) Ramirez, S. & Cohen, J.G. 2002, AJ, 123, 3277
- (21) Recio-Blanco, A., Aparicio, A., Piotto, G., De Angeli, F., Djorgovski, S.G. 2006, A&A, 452, 875
- (22) Shetrone, M.D., Keane M.J. 2000, AJ, 119, 840
- (23) Sneden, C., Kraft, R.P., Guhathakurta, P., Peterson, R.C., Fulbright, J.P. 2004, AJ, 127, 2162
- (24) Sneden, C., Kraft, R.P., Shetrone, M.D., Smith, G.H., Langer, G.E., Prosser, C.F. 1997, AJ, 114, 1964