Silica in Protoplanetary Disks
Abstract
Mid-infrared spectra of a few T Tauri stars (TTS) taken with the Infrared Spectrograph (IRS) on board the Spitzer Space Telescope show prominent narrow emission features indicating silica (crystalline silicon dioxide). Silica is not a major constituent of the interstellar medium; therefore, any silica present in the circumstellar protoplanetary disks of TTS must be largely the result of processing of primitive dust material in the disks surrouding these stars. We model the silica emission features in our spectra using the opacities of various polymorphs of silica and their amorphous versions computed from earth-based laboratory measurements. This modeling indicates that the two polymorphs of silica, tridymite and cristobalite, which form at successively higher temperatures and low pressures, are the dominant forms of silica in the TTS of our sample. These high temperature, low pressure polymorphs of silica present in protoplanetary disks are consistent with a grain composed mostly of tridymite named Ada found in the cometary dust samples collected from the STARDUST mission to Comet 81P/Wild 2. The silica in these protoplanetary disks may arise from incongruent melting of enstatite or from incongruent melting of amorphous pyroxene, the latter being analogous to the former. The high temperatures of 1200K-1300 K and rapid cooling required to crystallize tridymite or cristobalite set constraints on the mechanisms that could have formed the silica in these protoplanetary disks, suggestive of processing of these grains during the transient heating events hypothesized to create chondrules.
1 Introduction
Silica (chemical name for the quartz group of minerals and a synonym for silicon dioxide) is a major ingredient of the Earth’s crust. The basic structural unit of crystalline silica is the tetrahedron, with the oxygen atoms at the corners and the silicon atom in the center. While in crystalline silica, structurally known as a tectosilicate, all oxygen atoms of a given tetrahedron are shared with the adjacent tetrahedra forming a three dimensional network structure, this does not hold for most other silicates. In silicates, SiO tetrahedra are coordinated by metal ions such as Mg2+ and Fe2+; examples of silicates are pyroxenes ([Mg,Fe]SiO3) and olivines ([Mg,Fe]2SiO4). The spectra of both silica and silicate dust have vibrational spectral features near 10 (due to the Si–O stretching mode) and 20 (due to the O–Si–O bending mode). For silica, the main features are at 9, 12.6, and 20, with a minor feature at 16 for one of the polymorphs of silica, cristobalite, although Swainson & Dove (1993) note that the 16 feature of -cristobalite is present at room temperature, but grows weaker with increasing temperature until it vanishes at 525K. These are the features that we use to identify the presence of silica grains in our spectra of protoplanetary disks, which are disks of dust and gas thought to be raw material from which larger bodies, including planets, form.
Silica has been used to determine the temperature and pressure conditions at the time of formation in terrestrial rocks (Tuttle & Bowen, 1958) and also in enstatite chondrite meteorites (Binns, 1967; Dodd, 1981). These conditions dictate how silica crystallizes into its various polymorphs (Heaney et al., 1994; Hemley et al., 1994). Generally, for pressures of 1 atm or lower, silica crystallizes as -quartz at temperatures below 846K; as -quartz for temperatures between 846K and 1140K; as tridymite between 1140K and 1743K; as cristobalite between 1743K and 2000K; and as a liquid of silica composition above 2000K. For a phase diagram illustrating these ranges of stability of silica polymorphs, see Figure 1 in Chapter 1 of Heaney et al. (1994). At higher pressures and a wide range of temperatures, coesite, and then stishovite forms. All of the crystalline forms of silica are similar in that their bulk composition is SiO2 and each of the oxygen atoms of every SiO tetrahedron is shared with the adjacent tetrahedron; however, the polymorphs differ in their arrangement of the SiO tetrahedra in crystalline networks. If silica is not allowed sufficient time to crystallize into one of its polymorphs, it will form as amorphous SiO2. In principle, one can estimate the formation conditions (temperature and pressure) of the silica dust in astronomical environments based on the polymorph(s) of silica which can be inferred from their infrared (IR) spectra.
Silica cannot be an abundant interstellar dust species since the expected 9 and 12.6 bands are not seen in the ISM (see Li & Draine, 2002). The presence of silica dust grains in the protoplanetary disk around the TTS Hen 3-600 A was indicated in its 8-13 spectrum (Honda et al., 2003).
In this work we report the detection of silica dust grains in the disks around five T Tauri stars from the prominent emission features characteristic of submicron silica grains. These emission features are generated in the optically thin uppermost layers of protoplanetary disks. We model the spectra obtained with the Infrared Spectrograph (IRS; Houck et al., 2004) on board the Spitzer Space Telescope (Werner et al., 2004) with silica as a key dust component, with the aim to constrain the polymorph(s) of the silica dust in these disks and therefore the formation conditions (temperature and pressure history) of this dust.
2 Data Reduction
2.1 Observations
The five T Tauri stars are described in Table 1. All were observed using both orders of the two low spectral resolution modules of the IRS, Short-Low (SL) and Long-Low (LL), using Staring Mode. For more information on the spectral modules and on Staring Mode, we refer the reader to Sargent et al. (2006). These stars were chosen for our study of silica features because all five stars - 1RXS J161410.6-230542, IRS 49, ROXs 42C, T51, and ZZ Tau - are SED Class II Young Stellar Objects; have prominent features at 9, 12.6, and 20 m wavelengths attributable to silica and often 16 m features partly attributable to silica; and have high quality spectra with high signal-to-noise ratios.
2.2 Extraction and Calibration of Spectra
We obtained basic calibrated data (BCD; flat-fielded, stray-light-corrected, dark-current-subtracted) products from the Spitzer Science Center (SSC) for each of the targets in our sample from the S15.3.0 IRS data calibration pipeline for 1RXS J161410.6-230542 and from the S14.0.0 IRS data calibration pipeline for IRS 49, ROXs 42C, T51, ZZ Tau. First, we identified bad pixels as described by Watson et al. (2007) in their explanatory supplement. In addition, we also identified as bad pixels a string of pixels with large values of e-/sec in the BCD data for the first nod of the first order SL observation of ZZ Tau from Campaign 4. Some of the affected pixels were flagged as “radhit” detections (most likely a cosmic ray hit) in the associated bmask; we marked as bad pixels these and additional neighboring pixels that also appeared to be affected by the cosmic ray. As 12.5 m is about the peak wavelength of a key diagnostic silica feature, fixing these pixels was critical for our purposes of analyzing dust emission features of silica. We correct for bad pixels by interpolation of neighboring pixels in the spectral direction, as described by Watson et al. (2007). First, we take the average of the pixel one pixel above and one pixel below. This is applied to all bad pixels in the bcd data. If a given pixel is not fixed, we then take another iteration; this time, we take the average of the pixel one pixel above and two pixels below the bad pixel. This process is repeated, with subsequent iterations going two pixels above and one pixel below, then two pixels above and two below, then finally one more iteration going one pixel above and one below.
The spectra presented in this paper were extracted from the BCD data using the Spectral Modeling, Analysis, and Reduction Tool (SMART; Higdon et al., 2004) via methods described by Sargent et al. (2006) and Furlan et al. (2006). For all targets in our sample, we subtracted sky for SL and LL by subtracting the pixel-fixed BCD data for the same order but other nod position. We extracted a spectrum each DCE separately, then used the extracted spectrum from each DCE to compute, first, the average spectrum and, second, its uncertainties from the standard deviation of the mean. Wavelength calibration of our data, tapered column extraction for each order of SL and LL, and flux density calibration of spectra using Relative Spectral Response Functions (RSRFs) was achieved as described by Sargent et al. (2006). The same high spectral resolution template of Lac (A1 V; M. Cohen 2004, private communication) used by Sargent et al. (2006) was used to generate RSRFs for SL and LL flux calibration for IRS 49, ROXs 42C, T51, and ZZ Tau, and for SL flux calibration for 1RXS J161410.6-230542. For the LL flux calibration of 1RXS J161410.6-230542, we applied LL second order, LL bonus order, and LL first order (from its short-wavelength end to 36 m wavelength) RSRFs generated from data of Dra and the template for Dra from Cohen et al. (2003); past 36 m, we applied a LL first order RSRF generated from data of Markarian 231 and the template for Markarian 231 (J. Marshall, private communication; Marshall et al., 2007; Armus et al., 2007).
We note the Humphreys- and [Ne II] lines at 12.37 and 12.81 m, respectively, are located near the central wavelengths of the two narrow features consituting a double peak in the opacity profile of -quartz (see discussion later in Section 3.1). Sargent et al. (2006) concluded -quartz was present in the IRS spectrum of TW Hya based upon two narrow emission features located at the wavelengths of the two peaks of the -quartz opacity profile used in that study. Upon detailed inspection of the Short-High spectrum of TW Hya presented by Uchida et al. (2004), we find unresolved emission lines from Humphreys- and [Ne II] and no underlying emission from the -quartz double feature. We have looked at the Short-High spectra from Staring Mode observations of 1RXS J161410.6-230542 (AOR ID# 5453824) and ROXs 42C (AOR ID# 6369792) for these lines. The AORs had two DCEs per nod position and two nod positions; in these Short-High data, we found no emission from Humphreys- or [Ne II].
2.3 Extinction Correction of spectra
For all objects except the highly extinguished (=10.7) IRS 49, we corrected our RSRF-calibrated spectra in the same manner as described by Sargent et al. (2006), having adopted values of extinction at V-band, , as listed in Table 1. For IRS 49, extinction correction was accomplished via the same method, and also using a lower assuming =25, a value suggested for extinction in dense star forming regions like Ophiuchus (in which IRS 49 resides) by Chiar et al. (2007).
2.4 Mispointing
We account for mispointing along the slits (the cross-dispersion direction) by adjusting the positions of our 3-5 pixel wide extraction boxes. The degree of mispointing is typically much less than 1 pixel (1.8 in SL), and we adequately account for this by using the BCD flatfielding. Mispointing in the dispersion direction is harder to detect and causes a loss of signal at every wavelength. We assume that the flux density from one nod being systematically lower than that from the other nod was due to loss of signal from dispersion-direction mispointing. To correct for this signal loss, we multiplied the nod lower in flux density by a scalar to minimize the squared differences in flux at each wavelength in the order. For more about correction for mispointing, see the Appendix.
2.5 Uncertainties
Uncertainty in flux density was determined by the standard deviation from the mean for the scalar-multiplied spectra from all DCEs. For IRS 49, ROXs 42C, and T51, there were only 2 DCEs (the 2 nod positions), so for these the standard deviation from the mean equals half the difference of the spectra at the 2 nod positions. Also, for the reasons listed by Sargent et al. (2006), we set relative uncertainties lower than 1% to 1%.
2.6 Photosphere subtraction
Three of the five objects whose spectra are analyzed in this study, 1RXS J161410.6-230542, ROXs 42C, and ZZ Tau, have Spectral Energy Distributions (SEDs) indicative of very little mass in small dust grains in the innermost disk regions. The SEDs of these three objects (Silverstone et al., 2006; McClure et al., 2008; Furlan et al., 2006) have optical and JHK photometry that is consistent with stellar photospheric emission, with ZZ Tau photospheric even to L band (3.5 m). Also in each of these three cases, the excess above stellar photosphere as seen from the IRS spectrum at 5 wavelength is very small. Therefore, photosphere subtraction is important for these spectra in order to isolate the emission from circumstellar dust (see Sargent et al., 2006) at the short wavelength end of the IRS spectra. The low extinction to these three objects (see Table 1) gives us confidence that we can reasonably account for stellar photosphere emission in the IRS spectra. Therefore, for each we subtract a Planck function at the stellar effective temperature scaled to equal the flux at the dereddened J band flux of each object. At Spitzer IRS wavelengths ( 5 ), we are effectively subtracting the Rayleigh-Jeans tail of these Planck functions. The solid angles and temperatures used for the Planck functions representing stellar photosphere emission are listed in Table 1. For the stars T51 and IRS 49, there is significant excess at all IRS wavelengths, so no stellar continuum was subtracted.
3 Analysis
3.1 Silica Opacities
Spitzer & Kleinman (1961) and Wenrich & Christensen (1996) measured the complex dielectric function for -quartz at “room temperature” (300 K); Gervais & Piriou (1975) obtained for -quartz at 295 K, 505 K, 620 K, 785 K, and 825 K as well as for -quartz at 860 K and 975 K.
To compare these dielectric functions, we calculate, for the sake of illustration, the opacities for -quartz with the same grain shape distributions of either CDE (Bohren & Huffman, 1983) or CDE2 (Fabian et al., 2001), using the dielectric functions from Spitzer & Kleinman (1961) for quartz at 300 K, Wenrich & Christensen (1996) for quartz at 300 K, and Gervais & Piriou (1975) for quartz at 295 K and taking the “-approximation” for the ordinary and extraordinary rays (see § A in Sargent et al., 2006). We find that the opacities computed from the three sets of dielectric functions are nearly identical. This implies that we can have confidence not only in the optical properties of -quartz at room temperature, but also in the dielectric functions of -quartz and -quartz reported by Gervais & Piriou (1975) at other temperatures.
We show opacity curves for CDE and CDE2 shape distributions using the dielectric function from Gervais & Piriou (1975) for -quartz at 295 K in Figure 1. We take the mass density of -quartz to be 2.65 (Heaney et al., 1994). In the literature, the CDE and CDE2 grain shape distributions have been widely considered to explore the effects of dust shapes on the opacity profiles. Both CDE and CDE2 assume that the size of the grains under consideration are in the Rayleigh limit; i.e., 2a/ 1. Thus, the grain sizes for CDE and CDE2 shape distributions used in our models of mid-infrared emission are submicron. The CDE shape distribution (Bohren & Huffman, 1983) assumes a distribution of ellipsoidal shapes in which each shape, defined by the axial ratios of the ellipsoids, is statistically weighted equally. The CDE2 shape distribution (Fabian et al., 2001) assumes a distribution of ellipsoidal shapes in which ellipsoids that are almost spherical are weighted more heavily than more extreme (highly elongated along one or two axes or highly flattened along the other axes or both) shapes; the most extreme shapes in CDE2 are given zero weight. CDE is therefore more heavily weighted toward very nonspherical ellipsoids than CDE2. Our results confirm what others have shown in the literature (e.g. see the opacities of spheres, CDE, and CDE2 for forsterite by Fabian et al., 2001) – shape distributions of ellipsoids that more heavily weight toward very nonspherical ellipsoids with respect to spheres result in opacity profiles with features centered at increasingly longer wavelengths.
To approximate the effects of quartz of a range of temperatures, in Figure 2 we show the -quartz opacity profile obtained by averaging the opacity curves of -quartz of 975 K and 860 K. We take the mass density of -quartz to be 2.53 (Heaney et al., 1994). Similarly, we obtain the high-temperature -quartz profile from averaging the opacity of -quartz at 825 K and 785 K, and the lower-temperature -quartz profile from averaging the opacity of -quartz of 620 K and 505 K, all with a CDE shape distribution. Note the progression of the 12.6 feature complex from double-peaked to single-peaked as the quartz temperature increases (see Fig. 2). We assume that a given polymorph of silica, once formed, can exist stably at temperatures and pressures within its stability field on the phase diagram or metastably outside the stability field at lower temperatures if the physical conditions change relatively rapidly. However, we assume a polymorph of silica becomes another polymorph if subjected to temperatures higher than allowed by its stability field in the silica phase diagram.
Infrared transmission spectroscopy by Plyusnina et al. (1970) and absorption measurements by Williams et al. (1993) for coesite and stishovite rule out these higher pressure polymorphs of silica in our sample of TTS disks. For the intermediate pressure polymorph, coesite, both Plyusnina et al. (1970) and Williams et al. (1993) show four features with widths similar to that of the 12.6 feature between 14 and 23, but all with strengths greater than that of the 12.6 feature – one feature near 14, a pair of slightly stronger features at 16–17, and the strongest of the four features at 20–23. The spectra with prominent silica features do often have a feature at 16–17, but it is single, and, in addition, such spectra do not have a narrow feature at 14 of greater prominence than the 12.6 feature. This rules out coesite. Stishovite can be more easily ruled out, as both Plyusnina et al. (1970) and Williams et al. (1993) show stishovite to lack a 9 feature, while the spectra of the five silica exemplars analyzed in this study have prominent 9 features.
To represent the two higher temperature, low pressure polymorphs of silica, tridymite and cristobalite, we use the opacity obtained from the transmission measurements of submicron annealed silica grains embedded in Potassium Bromide, KBr, by Fabian et al. (2000). This silica was formed by heating amorphous SiO2 grains at 1220 K for 5 hours, and was found to be mostly cristobalite but also partially tridymite. This is supported by the fact that the cristobalite presented by Plyusnina et al. (1970) and Rokita et al. (1998) have a 16 feature of prominence similar to but slightly less than that of the 12.6 feature, whereas for tridymite the 16 feature is almost nonexistent (see the tridymite absorbance shown by Hofmeister et al. (1992)). The annealed silica presented by Fabian et al. (2000) has a 16 feature of prominence closer to that of “low cristobalite” as measured by Rokita et al. (1998). We also note that the opacity profile of the silica annealed by Fabian et al. (2000) at 1220 K for 5 hours bears a close resemblance to the IR spectrum of the products of annealing for 120 hours at 1300 K of silica formed from iron-bearing silicates by Hallenbeck et al. (1998). We present in Figure 3 the opacity of the annealed silica used in our models.
For amorphous SiO2, the dielectric functions at mid-IR wavelengths were measured by Henning & Mutschke (1997), Steyer et al. (1974), and Koike et al. (1989). In our dust modeling we adopt the dielectric functions of amorphous SiO2 at 300 K of Henning & Mutschke (1997). In addition, we consider obsidian, as measured by Koike et al. (1989). To compute the opacities of obsidian and amorphous SiO2, we take their mass densities to be 2.384 (Koike & Hasegawa, 1987) and 2.21 (Fabian et al., 2000), respectively. We plot in Figure 3 also the opacities of obsidian and amorphous SiO2 in the CDE shape distribution. The shape distribution affects the opacities of obsidian and amorphous SiO2 less than it does for - and -quartz; for this reason, we only use the opacities of obsidian and amorphous SiO2 with a CDE shape distribution, and we do not plot the opacities of these grains in the CDE2 shape distributions.
3.2 The KBr Effect
Embedding small grains in KBr is commonly used to measure the grain opacity in the IR. This technique has limitations – optical constants are not directly measured, so it is not possible to explore grain shapes, porosity, or size. The embedded grains may clump together, reducing the contrast in sharp features. Moreover, the index of refraction of KBr (1.5) can distort strong resonance features in the spectrum from how they would appear in a spectrum of the same grains in a vacuum (i.e., in a protoplanetary disk).
Annealed silica and crystalline pyroxene are the only grain components in our models which depend on a KBr-embedded measurement. We model the KBr effect on -quartz (see Figure 4) to illustrate the probable effects of KBr on our annealed silica opacities. We compute the opacities of solid, small -quartz grains in a KBr medium and in vacuum for both CDE and CDE2 shape distributions. We use the optical constants of -quartz at 975K computed by Gervais & Piriou (1975) as the optical properties of silica grains that are embedded in a KBr medium whose 6–28 optical constants we take from Heaton (1971). As shown in Figure 4, for the CDE shape distribution, the peak wavelengths of the 9, 12.6, and 20 features are little altered by embedding in KBr. The peak wavelength of the 9 feature for -quartz in the CDE2 shape distribution embedded in KBr is at a slightly longer wavelength than that for -quartz grains in the CDE2 distribution in vacuum. This also holds for the 20 feature. The peak wavelength of the 12.6 and 16 features are much less affected by either being in KBr or with a different shape distribution.
Note in Figure 4 that if the shape distribution for the dust in KBr is already at an extreme (e.g. CDE), models with the same shape distribution but in vacuum will have spectral features not much different (in width and central wavelength) from those in KBr. We note that all opacities of -quartz are somewhat higher for dust in a KBr medium, also found by Jaeger et al. (1998).
3.3 Other Dust Opacities
For submicron amorphous silicates, we compute opacities for the CDE2 shape distribution (Fabian et al., 2001). We take the dielectric functions of MgFeSiO4 of Dorschner et al. (1995) for amorphous olivine. For amorphous pyroxene we use the dielectric functions of Mg0.7Fe0.3SiO3 from Dorschner et al. (1995). We take the mass densities of both olivine and pyroxene to be 3.3.
To account for the effects of grain growth, we consider porous dust. Porous material is simulated by applying the Bruggeman effective medium theory (Bohren & Huffman, 1983), assuming the porous grains are 60% vacuum by volume. The effective dielectric functions for porous amorphous pyroxene and olivine are then computed. Mie theory (Bohren & Huffman, 1983) is then used to compute the opacities of spherical porous grains of radii of 5. As noted by Sargent et al. (2006), the opacity of 5-radius, 60%-porous amorphous silicate grains is similar to that for 2-radius solid dust, the size of dust used by Bouwman et al. (2001) to investigate grain growth in Herbig Ae/Be disks.
We also include pyroxene (crystalline) and forsterite (of which the density is also 3.3) in our analysis. For pyroxene, we use the opacity of “En90” (Chihara et al., 2002). With a stoichiometric composition of Mg0.9Fe0.1SiO3, “En90” is quite effective in fitting the pyroxene features at 9.3, 10.5, 11.2, and 11.6 within the 10 complex of FN Tau (see Sargent et al., 2006). For forsterite, we use the optical constants of Sogawa et al. (2006) which are similar to that of Servoin & Piriou (1973), to compute the opacity for a distribution of ellipsoidal shapes.
Using the formalism of Bohren & Huffman (1983), we have constructed an opacity profile for a distribution of forsterite grains in which all ellipsoidal axial ratios are given an equal weight, as in CDE. However, we exclude the most extreme ellipsoidal axial ratios in the following manner.
Our shape distribution, which we call “tCDE” (truncated Continuous Distribution of Ellipsoids), is that we confine and (which are the parameters described by Bohren & Huffman (1983)) within the triangle in the --space specified by vertices (, ), (0.1, 0.895), and (0.99, 0.005). For CDE, all shapes are allowed: the triangle specified by the verticies (0,0), (0,1), and (1,0). The opacity profile of forsterite for CDE has a feature peaking at 11.3 which is close to the feature seen in astronomical data (but often peaking at a slightly longer wavelength). The opacity profile for tCDE “rounds” this peak somewhat, pushing the peak toward slightly shorter wavelengths, and this results in marginally better fits to astronomical spectra.
We will discuss “tCDE” at a greater length in Sargent et al. (2008), but here we justify this choice by showing in Figure 5 our model fits to ROXs 42C with forsterite grains having either a CDE shape distribution (“CDE” model) or a tCDE distribution (“tCDE” model). The former (CDE) has per degree of freedom (d.o.f.) of 5.1, while for the latter (tCDE) which is somewhat better; the tCDE model does a slightly better job in fitting the 11 and 23 complexes of the spectrum of ROXs 42C but is overall very similar to CDE. Sargent et al. (2006) found great similarity between the opacity of forsterite and silica grains with a CDE shape distribution and that of porous dust with a porosity of 60%. Thus the effects of shape distribution and porosity cannot be clearly distinguished in the spectra.
No hint of Polycyclic Aromatic Hydrocarbon (PAH) emission is seen in our spectra, except possibly ZZ Tau at 6.2 . Especially telling is the lack of the ubiquitous 6.2, 7.7 PAH features, which are clearly distinguishable from silicate or silica emission; in ZZ Tau, no 11.3 PAH emission is evident.
We note that the opacity profiles of some solids are similar to that of silica, but nevertheless can be ruled out. Kimura & Nuth (2007) measured the transmittance of H2Si2O4 and Si2O3. They found in some of their spectra the features peak at wavelengths very close to those of silica (9, 12.6, and 21.5); however, many of their spectra also show a narrow feature at 11.36 with a width similar to their 12.6 feature but of greater prominence. This feature is not seen in the spectrum of ZZ Tau. In the spectra of 1RXS J161410.6-230542 and ROXs 42C there is a feature near 11.1, but as will be shown in our model fits to their spectra, this peak can be attributed to forsterite. Also, the opacity curves computed using the optical constants of Na-bearing amorphous aluminosilicates determined by Mutschke et al. (1998) exhibit features near 9 and 21 similar to those of silica of various versions; however, the Na-bearing aluminosilicates lack the distinctive 12.6 feature which is seen in the emission spectra of the 5 T Tauri stars and in the opacity spectra of all versions of silica.
3.4 Models
We model the spectra of each of five T Tauri stars as a sum of featureless continuum emission (from optically thick disk midplane, iron or amorphous carbon grains, and very large 10 silicate grains) and optically thin emission from dust grains with strong infrared resonances in the disk atmosphere (see Sargent et al., 2006). It is not our goal to model self-consistently the entire spectral energy distribution from the near-IR to submm; such would require radiative transfer models such as those of Calvet et al. (1992) and D’Alessio et al. (2001).
We reject silicate self-absorption, a mix of emission and absorption by similar kinds of dust but with cooler dust in front of warmer dust, as an explanation of the 9 and 12.6 features we see in our spectra. Self-absorption in the 10 silicate complex would give apparent emission features in the 8 and 12 wings of the 10 complex; however, such would require the optical depth of the cool amorphous silicate dust to exceed 1. Since amorphous silicate dust in the ISM gives of 18 or 25 (see §2.3), this would mean the intervening dust has of 18 to 25. Such dust would not be at the disk surface; otherwise it would heat up to the same temperature as surrounding dust and not give rise to an absorption feature. Such dust would have to be further away from the disk and star, and therefore would also be in front of the star in the line-of-sight to the star, and we would therefore find of 18 to 25 to all stars with what appear to be prominent 9 and 12.6 silica features. All of our objects have less than 18, the minimum required to result in self-absorption.
We approximate the IR emission from dust with a large range of temperatures by two temperatures. A similar approach was employed by Kastner et al. (2006) to model the IRS emission spectra of the dust around the hypergiant R66 in the Large Magellanic Cloud and by Chen et al. (2006) to model that of five debris disks (see especially the two dust temperatures used in the model for Tel). We assume that, for a given protoplanetary disk, all dust grains, regardless of composition, within the same arbitrarily small volume of the part of the disk atmosphere giving rise to optically thin silicate and silica emission are at the same temperature. Kamp & Dullemond (2004) find in their disk models that, in a layer above the layer giving rise to dust emission features, the gas and dust temperatures are within 10% of each other. As gas density increases closer towards the disk midplane, the gas and dust temperatures in the layer giving rise to dust emission features should be even closer to each other. The dense gas effectively should equalize the temperatures of dust grains of different optical properties (resulting from, e.g., different compositions, different sizes). Our two-temperature models therefore model dust composition for two disk regions: the warmer inner disk regions and the cooler outer disk regions.
Our model is a sum of blackbodies at two temperatures plus optically thin emission from dust at those temperatures. Mathematically, these models are given by
| (1) | |||||
where is the model flux density; is the Planck function at temperature and wavelength ; is the temperature of “cool” dust and is the temperature of “warm” dust; () is the solid angle of a blackbody representing the continuum emission from cool (warm) dust; (), the mass weight for cool (warm) dust, equals (), where () is the mass of dust species at () and is the distance to the T Tauri star (see Table 1 for the stellar distances). We specify a grid of temperature pairs, and , not allowing either of the temperatures to exceed 1401 K, as this temperature is intermediate between the stability limits of forsterite and enstatite of 1430 K and 1370 K, respectively (Posch et al., 2007). For a given temperature pair, our model equation is linear in solid angles and optically thin dust mass weights. We minimize
| (2) |
with respect to each of the solid angles and mass weights, where is the observed flux density at the -th waveband and is the uncertainty in the observed flux density at the -th waveband. If any of the mass weights computed from an iteration of minimization are negative, the component with the most negative integrated flux from 7.7-23 is set to zero, and we then minimize again. This process is iterated until there are no components with negative mass weights. The solution found in the iteration for which no components are negative is the best fit for a given temperature pair. The process is carried out for another temperature pair. The global best fit for a spectrum is at the temperature pair that minimizes per degree of freedom. In all of our best fits, the silica component at both low and high temperatures was positive. The number of degrees of freedom is equal to the number of data points minus four (since we consider two dust temperatures and two solid angles) minus the number of mass weights at both temperatures altogether.
Figure 5 is a sample fit of a model with annealed silica to the 7.7–37 IRS spectrum of ROXs 42C (all other models, including the other models of ROXs 42C, discussed or shown in this paper are fit over 7.7-23 ). It is seen that our two-temperature model fits the spectrum of ROXs 42C over almost the entire wavelength span of the IRS. What interests us most in this study are the spectral features diagnostic of silica, the 9, 12.6, 16, and 20 features. For this reason, we minimize over the smallest range of wavelengths sufficient to adequately cover these features, 7.7 to 23. We determine a very conservative estimate of the uncertainty for each nonzero dust component and solid angle in the model as the amount that resulted from increasing per degree of freedom by 1 from the best-fit value. The models shown in all figures after Figure 5 and whose parameters are summarized in Table 2 are constructed by minimizing over 7.7–23.
We obtained models of quartz in each of the CDE and CDE2 shape distributions (where the same shape distribution is used for quartz at the low temperature, , as for quartz at the high temperature, ). We used the opacity of the 295 K -quartz for the “cool” silica component. For the opacity of the “warm” silica component, we use the -quartz, high-temperature -quartz, and lower-temperature -quartz opacity curves described in §3.1 in reference to Figure 2. The opacities computed from the dielectric constants of -quartz at 505 K and 620 K were averaged to give an “average 562.5 K -quartz opacity”; 785 K and 825 K -quartz opacities were averaged to give an “average 805 K -quartz opacity”; and 860 K and 975 K -quartz opacities were averaged to give an “average 917.5 K -quartz opacity”. The model with the lowest difference between and “average - or -quartz opacity temperature” (562.5 K, 805 K, or 917.5 K) is the best fit model for quartz grains in the shape distribution under consideration (only CDE and CDE2 were considered). A model is rejected if is greater than the highest temperature allowed according to the stability field for a given silica polymorph (for silica polymorph stability fields, see Section 1).
4 Results
4.1 ROXs 42C
ROXs 42C was identified by Bouvier & Appenzeller (1992) as the easternmost stellar source within the positional error of the X-ray source ROX 42 found by the Einstein satellite (Montmerle et al., 1983). Mathieu et al. (1989) found it to have a double-lined spectroscopic binary with a 36 day period, while Ghez et al. (1993) found it also to be a visual binary separated by 0.16″; Jensen & Mathieu (1997) conclude that ROXs 42C is a hierarchical triple - a spectroscopic binary orbited by single star further out. Ratzka et al. (2005) agree with the assessment that ROXs 42C is a hierarchical triple, but report that the visual binary is now separated by 0.277″. Assuming a distance to Ophiuchus of 140pc (see Table 1), this implies a separation of 39 AU between the double-lined spectroscopic binary and the single star. Jensen et al. (1996) calculate the separation of the double-lined spectroscopic binary to be 0.27 AU. We note the similarity between ROXs 42C and Hen 3-600, itself a spectroscopic binary wi th another star at 70 AU orbiting the binary. We also note that the disk in the Hen 3-600 system also has abundant silica as indicated by its IR spectrum (Honda et al., 2003; Uchida et al., 2004). The state of accretion in the disk(s) in this system is unknown, as Bouvier & Appenzeller (1992) report the Equivalent Width of H- to be neither in absorption or emission, but such that the photospheric line was filled in by 1.6 Å of emission. However, because of the multiple stars in this system, and because it is not known where the disk(s) is (are) located, we do not know whether active accretion could be occurring currently onto one star and its spectral signature is obscured, or whether there is no active accretion in this system.
The IRS spectrum of ROXs 42C has prominent narrow features at 9 and 12.6 m from silica, in addition to features around 11, 23, 28, and 33.5 m identified with forsterite and pyroxene. We show the model fits to ROXs 42C using each of annealed silica, obsidian, amorphous SiO2, and quartz grains in the CDE and CDE2 shape distributions in Figure 6.
We rule out the models using the amorphous forms of silica - obsidian and amorphous SiO2 - because the 12.3-12.4 m features of these two silicas are of much less strength with respect to their 9 m features than for the crystalline forms of silica. This translates into being able to fit the 9 and 20 m features somewhat reasonably but not having enough strength in the 12.3-12.4 m feature to fit the data. In addition, the 12.3-12.4 m feature from the amorphous versions of silica is centered shortward of the feature in the data by 0.2 m and is noticeably wider, with a Full Width Half Maximum (FWHM) of 1 m, than that in the data (with a FWHM 0.5 m). The per degree of freedom for the model using obsidian is 5.4; for the model using amorphous SiO2, it is 5.2.
Next, consider -quartz, -quartz, tridymite and cristobalite (tridymite and cristobalite being represented together by annealed silica). For quartz in the CDE2 shape distribution, the lowest difference between model and “average opacity temperature” (temperature at which quartz optical constants were measured) happened for -quartz. A per degree of freedom of 4.5 was obtained for this model. The fit to the 9 m feature is good, coming from a combination of -quartz and pyroxene. Also, the model is within the error bars of a little over half the data points between 20.5 and 22 m. However, the spectrum of ROXs 42C lacks the double feature at 12.6 in the model, and the model does not have a strong 16 m feature like ROXs 42C. Forsterite gives a 16 m feature, but forsterite is insufficient by itself to fit the 16 m feature in ROXs 42C.
A per degree of freedom of 5.0 was obtained for the model using quartz in the CDE shape distribution. The fit to the 12.6 m feature is improved due to the feature being single-peaked in higher-temperature -quartz. However, this model provides a poor fit to 20.5 - 22.0 m. The model feature at 9 m peaks slightly longward of the feature in the data. A shape distribution intermediate between CDE and CDE2 could fit the 9 m feature, but would still provide a 20 m feature that would overshoot the ROXs 42C spectrum between 20.5 and 22.0 m. Furthermore, the model does not have a 16 m feature sharp enough to fit the 16 m feature in the data. We believe this definitely rules out -quartz as a candidate to explain the silica features of ROXs 42C; -quartz at temperatures of 505K-620K is a possibility to explain the features, but we believe it to be of lower probability.
This leaves annealed silica. We show the model using annealed silica at low and high model temperatures in Figure 6. A per degree of freedom of 3.2 was obtained for this model, the lowest for any of the models of ROXs 42C. The fit to the 9 m, 12.6 m, and 16 m features and the 20.5-22.0 m region is the best of all models fit to ROXs 42C, and this is reflected in the per degree of freedom (Table 2 and Figure 7). We note the opacity of annealed silica that we use comes from KBr pellet transmission measurements, but, as discussed in Section 3.2, we expect that the opacity curve for the annealed silica grains in KBr would be very similar in terms of spectral feature central wavelength and width to the opacity in vacuum. We conclude that annealed silica best matches the spectrum of ROXs 42C.
4.2 ZZ Tau
Simon et al. (1996) found ZZ Tau to be a binary system with a separation of stars that increased from 0.0338″ in 1994 to 0.0420″ in 1996. Subsequent measurements of the positions of the stars in the binary let Schaefer et al. (2006) solve for the orbital parameters of this system. Schaefer et al. (2006) compute the semi-major axis expressed as an angle of 0.061″, implying a separation of 8.5 AU. Prato & Simon (1997) report EWH from this system of 15 Å and suggest that this system is either a hybrid between a weak-lined and a classical T Tauri Star (the disk around one star actively accreting, the disk around the other not) or that one of the two stars in this system has an inner gap (a “transitional disk”).
ZZ Tau was also fit by amorphous SiO2, obsidian, quartz in both CDE and CDE2 shape distributions, and annealed silica. For this object and for the three other objects, we only show the best fit. As with ROXs 42C, amorphous SiO2 and obsidian gave features much too weak, too wide, and centered at the wrong wavelength to fit the 12.6 m feature of ZZ Tau. The fits using quartz in both shape distributions were rejected because the high temperature in the model was beyond the range of stability for -quartz. The fit to ZZ Tau using annealed silica (Figure 8, top) fit quite well at 9, 12.6, 16, and 20 m, and it also proved to be the best fit in terms of per degree of freedom, which amounts to 3.8 (see Table 2 and Figure 7).
4.3 1RXS J161410.6-230542
Of the 7 sources reported by Metchev (2006) to be located within 10″of 1RXS J161410.6-230542, only one was confirmed to be associated with this star. This companion is 0.222″ separated from the primary and is 0.21 magnitudes fainter at K-band (Metchev, 2006). At an assumed distance to this object of 145pc (Table 1), this implies a separation of 32 AU between the components. Preibisch et al. (1998) report EWH from 1RXS J161410.6-230542 of 0.96 Å, which, when combined with the K0 spectral type assigned to this system by Pascucci et al. (2007), suggests little or no accretion is occurring from the disk to the star in the 1RXS J161410.6-230542 system.
Annealed silica provided the best fit to the Spitzer IRS spectrum of 1RXS J161410.6-230542. As seen at the bottom of Figure 8, the fits to the 9, 12.6, 16, and 20 m features are all adequate with our model. The per degree of freedom is 6.6 for this model. Of all the versions of silica discussed in this paper, only annealed silica has a single, isolated peak at 16 m. The 16 m feature in our model is coming equally from forsterite and cold annealed silica, and the model fits the narrow ( 1 m FWHM) peaks in the spectrum fairly well at 11 and 19 , which are features associated with forsterite, meaning the fit to the 16 m feature would be worse without the contribution from annealed silica.
We note that the curious trapezoidal shape of the 12.6 m feature does not perfectly match the rounded shape of the 12.6 m annealed silica feature in our model, but we also note the size of the errorbars in the data at the top of the 12.6 m feature do not preclude a more rounded shape like the feature belonging to annealed silica. The 12.6 m complex of -quartz does evolve from double-peaked at 295K to somewhat trapezoidal and eventually single-peaked at progressively higher temperatures of 505K, 620K, 785K, and 825K; the feature is single-peaked and centered at 12.7 for -quartz. As opposed to annealed silica, - and -quartz in the CDE shape distribution do not fit the 20 m feature, and both quartzes in the CDE2 shape distribution do not fit the 9 m feature (see discussions in sections 4.1 and 4.2 on ROXs 42C and ZZ Tau, respectively). Further, models with annealed silica fit the 16 m features of 1RXS J161410.6-230542 and ROXs 42C noticeably better than does quartz in either the CDE or CDE2 shape distributions.
4.4 IRS 49
IRS 49, also known as WLY 2-49, has been searched for multiplicity but has not been found to be multiple (Barsony et al., 2003; Ratzka et al., 2005). Ratzka et al. (2005) established upper limits on the relative brightness at K band of any unseen companion around IRS 49 of 0.04 for 0.15″ separation and 0.02 for 0.50″ separation. Gatti et al. (2006) report significant accretion of = from Paschen- and Brackett- emission.
IRS 49 is in the Ophiuchus star-forming region; it has a sizeable extinction of AV of 10.7 (Table 1). How extinction at visible wavelengths translates to extinction at mid-infrared wavelengths is still uncertain (see discussion by Draine (2003) on values of A determined from various studies); for this reason, we present fits to the spectrum of IRS 49 dereddened assuming A=18 (Figure 9, top, brown points and solid black line; per degree of freedom of 5.5) and assuming A=25 (Figure 9, top, orange points and solid violet line; per degree of freedom of 6.3). As discussed by Sargent et al. (2006) with regard to the dust model of V410 Anon 13, greater extinction correction of at mid-infrared wavelengths results in spectral profiles that look more like the interstellar medium profile; namely, more like amorphous silicates. The effect of extinction correction on the silica features is most important for the 9 and 20 m silica features, but, as can be seen from Table 2 and Figure 7, per degree of freedom is lowest for both extinction corrections using models with annealed silica.
4.5 T51
Lastly, we consider T51. Also known as Sz 41, this object was found to be double by Reipurth & Zinnecker (1993). Another star, named Sz 41C, had also been thought to be associated with Sz 41, but was shown to be a background star by Walter (1992). This is noted by Correia et al. (2006), whose observations show the Sz 41 binary to be separated by 1.974″. Guenther et al. (2007) assign EWH of -2.0 Å, i.e., absorption. Spectroastrometry conducted by Takami et al. (2003) determine that the H profiles from the two components of the Sz 41 binary are roughly equivalent, suggesting there is negligible accretion in the disk(s) of the Sz 41 system.
We fit models with different silicas to T51. The spectrum of T51 includes a very prominent peak at 9 m, a triangular 20 m feature, a modest 12.6 m feature, and a slight 16 m feature. Once again, the model with annealed silica fit the dust excess spectrum the best (see Figure 9, bottom; per degree of freedom of 3.6). However, we note that of all objects whose spectra were analyzed in this study, T51 provides the weakest tests discriminating between the various versions of silica (see Figure 7). The models using obsidian and amorphous SiO2 are not much worse than the model using annealed silica.
5 Discussion
5.1 Cristobalite Dominance
All the models (see Table 2) indicated the presence of both amorphous and crystalline silicates and grains grown to larger sizes as well as silica, suggesting production of silica accompanies both dust processing and grain growth. Models using the opacity of annealed silica provided the best fit of all models for all five objects whose spectra we analyzed. From our discussion of the KBr effect in Section 3.2, we believe the opacity of the same silica grains in vacuum instead of KBr would be very similar; any difference could be compensated by assuming more extreme ellipsoidal shapes (as in CDE). We conclude that the silica polymorph giving rise to the silica features we see in the spectra of ROXs 42C, ZZ Tau, 1RXS J161410.6-230542, IRS 49, and T51 is predominantly cristobalite because cristobalite was the dominant polymorph of silica present in the annealed silica sample of Fabian et al. (2000), although an admixture of tridymite is possible.
5.2 Silica in the Solar System
Dodd (1981) reports that tridymite and cristobalite are found in chondritic meteorites (see also Binns, 1967); more specifically, they were found in enstatite chondritic meteorites, which are characterized by calcium-aluminum inclusions (CAIs; Guan et al., 2000). Dodd (1981) also summarizes findings on eucrite meteorites. Eucrites are achondrites, which means they lack chondrules. Chondrules are spheroidal inclusions in chondritic meteorites, are submillimeter to centimeter in diameter, and have the appearance of having formed as molten drops (Norton, 2002). The findings show the volume percentage of silica (as quartz, tridymite, and cristobalite polymorphs) in these eucrites to be between 0 and 4 %. In the review by Brearley & Jones (1998), it is mentioned that less than 2% of chondrules are silica-bearing chondrules, chondrules that are up to 40% by volume silica, and they have been observed in a number of ordinary chondrites.
Silica has not been widely reported as detected in the infrared spectra of comet comae (Hanner, 2003; Hanner & Bradley, 2004). Neither Comet Kohoutek (Merrill, 1974) nor Comet Hale-Bopp (Harker et al., 2002) showed any hint of the 9 and 12.6 m silica features. Spitzer IRS spectra of the comet nucleus ejecta from the Deep Impact mission to Comet Tempel 1 also show no hint of silica features, and models of emission from this dusty eject do not require silica for a good fit (Lisse et al., 2007). Bouwman et al. (2001) reported silica present based on the spectrum of Comet Halley; however, the data is not of high quality, being coarse and noisy, so the detection is tentative at best. As discussed by Harker et al. (2002), magnesium-rich crystalline silicates absorb stellar radiation poorly over visible and near-infrared wavelengths, where the Sun emits a large fraction of its radiation. Harker et al. (2002) argue that Mg-rich pyroxene should have optical constants very similar to those of amorphous Mg-rich pyroxene given by Dorschner et al. (1995). The imaginary part of the index of refraction is as low as 0.0003 at 0.5 wavelength for amorphous Mg0.95Fe0.05SiO3, so we follow Harker et al. (2002) and take this value of k for Mg-rich crystalline pyroxene, which is found in comets (see Harker et al., 2002). Optical properties for the various silica polymorphs at visible and near-infrared wavelengths are not readily available in the literature (macroscopic rocks of quartz are often transparent or translucent). We estimate an upper limit on k for both ordinary and extraordinary rays of -quartz of 10-3 (see relevant discussion by Palik, 1985) and for amorphous SiO2 of 10-5 (again see Palik, 1985). This suggests that, at wavelengths over which the Sun emits most of its power, any silica in comets is either as poorly absorptive as Mg-rich pyroxenes, which are seen in comets, or is even less absorptive. Thus, silica may be present in comets but may be at temperatures too low to emit enough to be seen in mid-infrared spectra of comet comae.
A better approach to searching for silica from comets is to analyze physical samples of comet dust. In situ measurements of comet dust to date do not determine mineralogy, only the abundances of elements constituting comet dust. Such measurements determined the rocky material in the coma of Comet Halley to have solar, or chondritic, abundances of the major rock-forming elements Mg, Si, Ca, and Fe (Hanner, 2003). The STARDUST mission to Comet 81P/Wild 2 returned one several-micron sized grain (“Ada”) composed of tridymite and fayalite (Zolensky et al., 2006). Mikouchi et al. (2007) report a grain of crystalline silica that is either tridymite or cristobalite or both from Comet 81P/Wild 2. It remains to be seen how much silica will be inferred for this comet based upon analysis of the returned samples of its dust.
As Bradley (2003) summarizes, some Interplanetary Dust Particles (IDPs) are believed to originate from comets. Rietmeijer & McKay (1986) reported a 1.5 size grain of SiO2 in the phenocryst of the IDP W7010*A2 constituting less than 5% of the abundance of all minerals in the IDP. This SiO2 grain is of unknown polymorph (Rietmeijer & McKay, 1985). Rietmeijer & McKay (1986) also reported SiO2 fragments of 10% abundance in the same IDP. These crystals are subhedral and 0.1 in diameter (MacKinnon & Rietmeijer, 1987). However, Bradley (2003) does not mention silica as a significant mineral phase in IDPs. Grün et al. (2001), in the discussion of micrometeorite mineralogy and petrography, do not list silica as a major phase of micrometeorites, which are IDPs that have landed on Earth near the poles.
In a study of a large number of Kuiper Belt Objects (KBOs) using near-infrared spectra, Barkume et al. (2008) found the spectra were well-fit by models assuming water ice and featureless spectral continuum from unknown material. However, other compositions are inferred from near-infrared spectra of KBOs, such as methane and ethane ice, pyroxenes and olivines, and possible organic material (Emery et al., 2007). It is unknown whether KBOs contain silica.
Cristobalite and tridymite commonly occur in terrestrial siliceous volcanic rocks, such as in rapidly-cooled obsidian and rhyolite lava flows of San Juan district, Colorado, USA, both as the lining of cavities and in the fine-grained groundmass (e.g., Klein & Hurlbut, 1977).
5.3 Origin of Silica in Protoplanetary Disks
Less than 5% of the Si in the diffuse ISM is in crystalline silicates (Li & Draine, 2001), and Kemper et al. (2004) did not detect silica in the interstellar medium 8-12.7 m absorption profile observed towards the Galactic Center. The profile has no 9 or 12.3-12.6 m features to indicate the presence of amorphous or crystalline silica, and they very nicely fit the optical depth profile without silica. This optical depth profile was shown by Sargent et al. (2006) to be very similar to the 8-12.7 m emissivities derived for CoKu Tau/4, DM Tau, and GM Aur, whose IRS spectra were shown by D’Alessio et al. (2005) and Calvet et al. (2005) to be consistent with protoplanetary disks with many-AU-sized almost empty inner holes (CoKu Tau/4 and DM Tau) or optically thin inner regions and an almost empty gap (GM Aur). The 10 m silicate emission from these systems therefore originates from their outer disk regions, where the dust is cooler and where dust processing is less likely to occur. Their 10 m silicate emission profiles were very well fit with amorphous olivine and amorphous pyroxene and negligible silica, similar to the ISM absorption. We infer the average starting mixture of grains in protoplanetary disks is like those of CoKu Tau/4, DM Tau, and GM Aur and has negligible amounts of silica. Therefore, the silica we see must have formed in the disk.
In the creation of smoke from a laser-ablated enstatite grain, Fabian et al. (2000) found that the smallest smoke grains, 10-50 nm in size, were close to SiO2 in composition. The smallest particles in a smoke created from a forsterite grain were not pure SiO2, but had Mg/Si ratios between 0.5 and 1. The largest grains in both smokes were close to the composition of their parent enstatite and forsterite grains. This could be an equilibrium process related to one in which enstatite melts incongruently (Bowen & Anderson, 1914) to forsterite plus a high temperature polymorph of silica, either cristobalite or tridymite:
| (3) | |||||
except that in this case amorphous pyroxene, [Mg1-x,Fex]SiO3, replaces MgSiO3, and amorphous olivine, [Mg1-x,Fex]2SiO4, replaces Mg2SiO4 (Bowen & Schairer, 1935). Here, x is probably around 0.5 – we will call this reaction “incongruent melting of amorphous pyroxene”. We invoke amorphous pyroxene as the starting material in this reaction because amorphous pyroxene along with amorphous olivine are hypothesized to be the main ingredients of the interstellar medium (ISM; see Kemper et al., 2004) and the starting mixture of dust for protoplanetary disks (see discussion of unprocessed dust of transitional disks CoKu Tau/4, DM Tau, and GM Aur by Sargent et al., 2006). We also allow that incongruent melting of enstatite could be happening, where the parent enstatite could itself be the daughter product of prior processing of “grandparent” amorphous silicate. Also, shocked enstatite grains in meteorites are known to have formed cristobalite inclusions (Benzerara et al., 2002). Shock heating within the protoplanetary disk (Harker & Desch, 2002); heating during disk-processing, flares, and lightning (Pilipp et al., 1998); heating by intense light during the grains’ removal from the vicinity of the central star(s) by the T Tauri phase solar wind (de Pater & Lissauer, 2001) or by an X-wind (Shu et al., 1996) all may cause melting of enstatite. Experiments by Rietmeijer et al. (1986), Hallenbeck et al. (1998), Hallenbeck & Nuth (1998), Rietmeijer et al. (1999), and Rietmeijer et al. (2002) also found silica grains (amorphous SiO2 and tridymite) condensed from vapors of silicate compositions. This suggests silica can form in protoplanetary disks as a smoke or condensate from parent silicate dust grains, preferentially of low Mg/Si ratio like pyroxene. However, silica is not expected to condense from vapor of solar composition in chemical equilibrium (Gail, 2004) in inner disk regions, suggesting the silica grains in the protoplanetary disks in our study did not arise from chemical equilibrium condensation in the solar nebula close to the Sun.
5.4 Silica as a Tracer of Dust processing
After condensation of grains of the various silicates and silica, the experiments by Rietmeijer et al. (1986), Hallenbeck et al. (1998), Hallenbeck & Nuth (1998), Rietmeijer et al. (1999), Fabian et al. (2000), and Rietmeijer et al. (2002) subjected the condensates to high temperatures to anneal them. The two experiments of annealing at the highest temperatures for the longest durations, the heating of silica from iron-silicate smokes at 1300K for 120 hours by Hallenbeck et al. (1998) and of pure silica grains at 1220K for 5 hours by Fabian et al. (2000), gave very similar opacity profiles. Fabian et al. (2000) determined that their annealed silica was mostly cristobalite with some tridymite. The similarity of the opacity spectra indicates a similar composition for the Hallenbeck et al. (1998) annealed silica. The silica grains remaining after annealing at lower temperature for lesser durations in the other annealing experiments of Fabian et al. (2000) remained tridymite and amorphous SiO2. Tridymite forms at lower temperatures and does not have an appreciable 16 feature. Therefore the 16 m features of 1RXS J161410.6-230542 and ROXs 42C, which were better fit with annealed silica (which has a 16 m feature) than with other versions of silica, suggests the presence of at least some cristobalite in our silica exemplars. Thus, we expect the silica grains in these protoplanetary disks were subjected to temperatures for durations of time like the most extreme annealing experiments of Hallenbeck et al. (1998) and Fabian et al. (2000).
One possibility is that tridymite or cristobalite forms close to the central star, where the stellar irradiation heats grains to the high temperatures required for formation of tridymite or cristobalite, and then are transported to cooler disk regions (Bockelée-Morvan et al., 2002). Our dust models have annealed silica (cristobalite/tridymite admixture) at temperatures ranging from 153K to 1401K, corresponding to distances from the star in the disk of a few AU down to the dust sublimation radius (sub-AU range). To explain the existence of tridymite or cristobalite in the cool outer disk regions, however, the tridymite or cristobalite, once formed, would have to be cooled sufficiently quickly so that their crystalline structure does not revert to that of either of the lower-temperature polymorphs of silica, - and -quartz, and then transported to the outer disk. It seems unlikely that any of the proposed transport mechanisms could move these silica grains to a lower temperature region of the disk rapidly enough to quench the cristobalite or tridymite structure in place.
If the tridymite or cristobalite do not form in the inner disk, this would suggest transient heating events, like shocks (Harker & Desch, 2002) or lightning (Pilipp et al., 1998), occuring in situ in the outer disk. The shock model of Desch & Connolly (2002) provides cooling similar to that required to explain chondrules - rates of 10-1000 K/hour - which may be quite sufficient to allow silica grains to retain their high-temperature polymorph crystalline structure. Furthermore, some of the Desch & Connolly (2002) shock models reached temperatures high enough that chondrule precursors would be evaporated; this may allow formation of silica via condensation. The shock model of production of crystalline silicate grains has been invoked to explain the presence of crystalline silicates in outflows from Asymptotic Giant Branch (AGB) stars by Edgar et al. (2008). The lightning theory by Pilipp et al. (1998) also attempts to explain chondrule formation and therefore meets similar requirements for cooling rates. The heating of pyroxene in some Interplanetary Dust Particles (IDPs) to temperatures above 1258K and their subsequent rapid cooling of 1000 K per hour (Alexander et al., 2007) also suggest heating and rapid cooling in protoplanetary disks, as the chondrules do. We note again the chondrules bearing silica by up to 40% by volume and speculate there may be a connection between the mechanism that formed submicron silica grains in our five silica exemplars and the mechanism that gave rise to the silica-bearing chondrules. An experiment like the one that produced the annealed silica whose opacity we use showed that such annealed silica cooled from 1223K to 533K over a span of 4 hours 20 minutes with average cooling rates dropping from 2000 K per hour initially to 50 K per hour at the end (H. Mutschke, private communication). Our data indicate silica grains have experienced high temperatures required to form cristobalite or tridymite, and cooled quickly enough to quench them.
In the various proposed silica-production mechanisms, the silica forms from parent amorphous silicate grains of pyroxene ([Mg,Fe]SiO3) or olivine ([Mg,Fe]2SiO4) composition like what are inferred to exist in the ISM from extinction profiles of objects in the Galactic Center (Kemper et al., 2004) or from parent crystalline grains of enstatite (MgSiO3) or forsterite (Mg2SiO4). Other products arising from the production of silica (SiO2) must be rich in the leftover magnesium, iron, and/or oxygen. This is seen, for example, in the previously-discussed incongruent melting of enstatite or amorphous pyroxene, which produces silica and also forsterite; the forsterite has the magnesium and oxygen from the parent enstatite that the daughter silica lacks. This would suggest a correlation between silica abundance and silicates with higher stoichiometric ratios of magnesium-to-silicon and oxygen-to-silicon like forsterite and the olivines; such correlations should be sought in future dust composition studies of protoplanetary disks.
6 Summary and Conclusions
We have analyzed the dust composition of five T Tauri stars using their Spitzer Space Telescope IRS spectra, with special regard to their silica dust. These five spectra show very prominent emission features at 9, 12.6, 20, and sometimes 16 m wavelength, which is characteristic of submicron size silica dust. We have constructed spectral models for each of the spectra that include blackbodies at two temperatures, to represent inner and outer disk emission from the optically thick disk midplane and blackbody grains, and Planck functions at those two temperatures multiplied by scaled dust emissivities, to represent inner and outer disk emission from dust in the optically thin disk atmosphere with strong infrared resonances. The best fit for a given set of dust opacities happens at the pair of temperatures for which the global per degree of freedom is minimum. The opacities we use for non-silica dust species are either the same or slightly improved over those used by Sargent et al. (2006).
We conclude the following:
-
•
The spectra rule out the highest pressure polymorph of silica, stishovite, and we also fairly confidently rule out the intermediate pressure polymorph of silica, coesite.
-
•
Amorphous versions of silica like amorphous SiO2 (Henning & Mutschke, 1997) and silica-rich glass, obsidian (Koike et al., 1989) are quite firmly ruled out to explain the silica features in our five silica exemplars due to their inability to fit the 12.6 m features seen in these spectra. The amorphous SiO2 features peak at too short of a wavelength for this feature, are too wide, and are too weak with respect to the 9 m feature.
-
•
The opacity of annealed silica obtained by heating amorphous SiO2 for 5 hours at 1220K (Fabian et al., 2000) provides the best fit to the spectra of all five of the strong silica exemplars in this study. Fabian et al. (2000) report this annealed silica to be mostly cristobalite but partly tridymite, so these silica polymorphs are the best candidates to account for the silica features seen in the spectra of our five silica exemplars. This opacity is very similar to that reported by Hallenbeck et al. (1998) for silica annealed at 1300K for 120 hours.
-
•
The opacity of -quartz at intermediate temperatures (505K, 620K) provided a good fit to the 12.6 m feature of ROXs 42C, but the fits to features at other wavelengths characteristic of silica (9, 16, 20 m) were not as good as the fits obtained from using annealed silica, indicating -quartz is not the dominant silica in these disks. -quartz, however, can be fairly firmly ruled out, as its feature at 12.7 cannot fit the 12.6 feature we observe in our dust excess spectra, regardless of the assumed shape distribution of the -quartz grains.
-
•
Neither amorphous nor crystalline silica are seen in interstellar medium dust, so the silica present in protoplanetary disks of the five silica exemplars analyzed in this study must have formed in the disks.
-
•
The silica grains giving rise to emission from our five silica exemplars may have formed in similar conditions to those that gave rise to Ada, a grain composed mostly of tridymite surrounded by fayalite, found in the coma of Comet Wild/2 and the silica polymorphs found in primitive meteorites.
-
•
Tridymite and cristobalite are common products of annealing of amorphous dust smokes and condensates in laboratory experiments (e.g, Rietmeijer et al. (1986), Rietmeijer et al. (1999), Fabian et al. (2000), Rietmeijer et al. (2002)) designed to mimic protoplanetary disk conditions thought to produce crystalline silicates by annealing amorphous silicate smokes. Cristobalite, the major component of the annealed silica we use, is present in silica grains annealed at temperatures above 1220K for durations more than 5 hours and has a 16 m feature in its opacity profile that is needed to fit the spectra of our silica exemplars. Silica, as a tridymite or cristobalite polymorph, might form in protoplanetary disks in manners similar to these laboratory experiments. Protoplanetary disk temperature and heating duration conditions giving rise to the silica we see in our sample of protoplanetary disks must be more like the most extreme conditions from the annealing experiments giving rise to cristobalite.
-
•
The silica grains may form via the incongruent melting reaction of amorphous pyroxene or the incongruent melting reaction of enstatite.
-
•
The tridymite or cristobalite grains, once formed, must be cooled quickly enough to retain their crystalline structure and not revert to the lower temperature polymorphs of silica, - and -quartz. Mechanisms like spiral shocks and lightning devised to explain the rapidity with which chondrules cool may also satisfy the rapidity with which tridymite or cristobalite must cool in order to retain its crystalline structure. This would support the idea of in situ formation of the annealed silica.
Appendix
For ZZ Tau, average flux densities for each DCE of each order of each nod were computed, averaging over 5.18-6.76 m wavelength for SL second order, 7.57-8.37 m wavelength for SL bonus order, 7.57-11.81 m wavelength for SL first order, 14.15-17.97 m wavelength for LL second order, 19.82-21.19 m wavelength for LL bonus order, and 22.02-29.99 m wavelength for LL first order. Each DCE of ZZ Tau was then scaled so that its average flux was the same average flux as the other DCEs of the same order. For SL second order, all DCEs were scaled so that their average flux was the same as that of the second nod from the Campaign 4 AOR; for SL bonus order, the average flux to match was that of the first nod of the Campaign 4 AOR; for SL first order, also the first nod of the Campaign 4 AOR; for LL second order, the second DCE of the second nod of the Campaign 29 AOR; for LL bonus order, the first DCE of the first nod of the Campaign 29 AOR; and for LL first order, the second DCE of the first nod of the Campaign 29 AOR. In almost all cases, the average fluxes of these named DCEs were the highest of their given order; in the case of LL second order, the average flux of the named DCE was only 1% discrepant from the highest average flux of all LL second order DCE spectra. The range of scalars applied to each DCE of ZZ Tau is provided also in Table 3.
References
- Alexander et al. (2007) Alexander, C. M. O., Boss, A. P., Keller, L. P., Nuth, J. A., & Weinberger, A. 2007, Protostars and Planets V, 801
- Armus et al. (2007) Armus, L., et al. 2007, ApJ, 656, 148
- Barkume et al. (2008) Barkume, K. M., Brown, M. E., & Schaller, E. L. 2008, AJ, 135, 55
- Barsony et al. (2003) Barsony, M., Koresko, C., & Matthews, K. 2003, ApJ, 591, 1064
- Benzerara et al. (2002) Benzerara, K., et al. 2002, American Mineralogist, 87, 1250
- Binns (1967) Binns, R. A. 1967, Am. Mineral. , 52, 1549
- Bockelée-Morvan et al. (2002) Bockelée-Morvan, D., Gautier, D., Hersant, F., Huré, J.-M., & Robert, F. 2002, A&A, 384, 1107
- Bohren & Huffman (1983) Bohren, C. F., & Huffman, D. R. 1983, Absorption and Scattering of Light by Small Particles, New York: Wiley
- Bontemps et al. (2001) Bontemps, S., et al. 2001, A&A, 372, 173
- Bouvier & Appenzeller (1992) Bouvier, J., & Appenzeller, I. 1992, A&AS, 92, 481
- Bouwman et al. (2001) Bouwman, J., Meeus, G., de Koter, A., Hony, S., Dominik, C., & Waters, L. B. F. M. 2001, A&A, 375, 950
- Bowen & Anderson (1914) Bowen, N. L. & Anderson, O. 1914, Am. J. Sci, Series 4, 37, 487
- Bowen & Schairer (1935) Bowen, N. L. & Schairer, J. F. 1935, Am. J. Sci, Series 5, 29, 151
- Bradley (2003) Bradley, J. 2003, LNP Vol. 609: Astromineralogy, 609, 217
- Brearley & Jones (1998) Brearley, A. J. & Jones, R. H. (1998) Chondritic meteorites. In Planetary Materials, Reviews in Mineralogy (ed. J. J. Papike). Mineralogical Society of America, Washington, D. C., vol. 36, chap. 3, pp 3-13 and 3-37.
- Calvet et al. (1992) Calvet, N., Magris, G. C., Patino, A., & D’Alessio, P. 1992, Rev. Mex. de Astro. Astrof., 24, 27
- Calvet et al. (2005) Calvet, N., et al. 2005, ApJ, 630, L185
- Chen et al. (2006) Chen, C. H., et al. 2006, ApJS, 166, 351
- Chiar et al. (2007) Chiar, J. E., et al. 2007, ApJ, 666, L73
- Chihara et al. (2002) Chihara, H., Koike, C., Tsuchiyama, A., Tachibana, S., & Sakamoto, D. 2002, A&A, 391, 267
- Cohen et al. (2003) Cohen, M., Megeath, S. T., Hammersley, P. L., Martín-Luis, F., & Stauffer, J. 2003, AJ, 125, 2645
- Correia et al. (2006) Correia, S., Zinnecker, H., Ratzka, T., & Sterzik, M. F. 2006, A&A, 459, 909
- D’Alessio et al. (2001) D’Alessio, P., Calvet, N., & Hartmann, L. 2001, ApJ, 553, 321
- D’Alessio et al. (2005) D’Alessio, P., et al. 2005, ApJ, 621, 461
- de Pater & Lissauer (2001) de Pater, I., & Lissauer, J. J. 2001, Planetary Sciences, by Imke de Pater and Jack J. Lissauer, pp. 544. ISBN 0521482194. Cambridge, UK: Cambridge University Press, December 2001.,
- de Zeeuw et al. (1999) de Zeeuw, P. T., Hoogerwerf, R., de Bruijne, J. H. J., Brown, A. G. A., & Blaauw, A. 1999, AJ, 117, 354
- Desch & Connolly (2002) Desch, S. J., & Connolly, H. C. 2002, Meteoritics & Planet. Sci., 37, 183
- Dodd (1981) Dodd, R. T. 1981, Meteorites - A petrologic-chemical synthesis, . Cambridge University Press, 1981. 368
- Dorschner et al. (1995) Dorschner, J., Begemann, B., Henning, T., Jaeger, C., & Mutschke, H. 1995, A&A, 300, 503
- Draine (2003) Draine, B. T. 2003, ARA&A, 41, 241
- Edgar et al. (2008) Edgar, R. G., Nordhaus, J., Blackman, E. G., & Frank, A. 2008, ApJ, 675, L101
- Emery et al. (2007) Emery, J. P., Dalle Ore, C. M., Cruikshank, D. P., Fernández, Y. R., Trilling, D. E., & Stansberry, J. A. 2007, Bulletin of the American Astronomical Society, 38, 510
- Fabian et al. (2000) Fabian, D., Jäger, C., Henning, T., Dorschner, J., & Mutschke, H. 2000, A&A, 364, 282
- Fabian et al. (2001) Fabian, D., Henning, T., Jäger, C., Mutschke, H., Dorschner, J., & Wehrhan, O. 2001, A&A, 378, 228
- Furlan et al. (2006) Furlan, E., et al. 2006, ApJS, 165, 568
- Gail (2004) Gail, H.-P. 2004, A&A, 413, 571
- Gatti et al. (2006) Gatti, T., Testi, L., Natta, A., Randich, S., & Muzerolle, J. 2006, A&A, 460, 547
- Gervais & Piriou (1975) Gervais, F., & Piriou, B. 1975, Phys. Rev. B, 11, 3944
- Ghez et al. (1993) Ghez, A. M., Neugebauer, G., & Matthews, K. 1993, AJ, 106, 2005
- Grün et al. (2001) Grün, E., Gustafson, B. A. S., Dermott, S., & Fechtig, H. 2001, Interplanetary Dust, Edited by E. Grün, B.A.S. Gustafson, S. Dermott, and H. Fechtig. Astronomy and Astrophysics Library. 2001, 804 p., ISBN: 3-540-42067-3. Berlin: Springer, 2001.,
- Guan et al. (2000) Guan, Y., Huss, G. R., MacPherson, G. J., & Wasserburg, G. J. 2000, Science, 289, 1330
- Guenther et al. (2007) Guenther, E. W., Esposito, M., Mundt, R., Covino, E., Alcalá, J. M., Cusano, F., & Stecklum, B. 2007, A&A, 467, 1147
- Hallenbeck et al. (1998) Hallenbeck, S. L., Nuth, J. A., & Daukantas, P. L. 1998, Icarus, 131, 198
- Hallenbeck & Nuth (1998) Hallenbeck, S., & Nuth, J. 1998, Ap&SS, 255, 427
- Hanner (2003) Hanner, M. S. 2003, Astromineralogy, 609, 171
- Hanner & Bradley (2004) Hanner, M. S., & Bradley, J. P. 2004, Comets II, 555
- Harker & Desch (2002) Harker, D. E., & Desch, S. J. 2002, ApJ, 565, L109
- Harker et al. (2002) Harker, D. E., Wooden, D. H., Woodward, C. E., & Lisse, C. M. 2002, ApJ, 580, 579
- Heaney et al. (1994) Heaney, P. J. (1994) Structure and Chemistry of the Low-Pressure Silica Polymorphs. In Silica: Physical Behavior, Geochemistry and Materials Applications, Reviews in Mineralogy (eds. P. J. Heaney, C. T. Prewitt, & G. V. Gibbs). Mineralogical Society of America, Washington, D. C., vol. 29, chap. 1, pp 1-40
- Heaton (1971) Heaton, H. I. 1971, Journal of the Optical Society of America, 61, 275
- Hemley et al. (1994) Hemley, R. J., Prewitt, C. T., & Kingma, K. J. (1994) High-Pressure Behavior of Silica. In Silica: Physical Behavior, Geochemistry and Materials Applications, Reviews in Mineralogy (eds. P. J. Heaney, C. T. Prewitt, & G. V. Gibbs). Mineralogical Society of America, Washington, D. C., vol. 29, chap. 2, pp 41-81
- Henning & Mutschke (1997) Henning, T., & Mutschke, H. 1997, A&A, 327, 743
- Henning et al. (1999) Henning, T., Il’In, V. B., Krivova, N. A., Michel, B., & Voshchinnikov, N. V. 1999, A&AS, 136, 405
- Herbig & Bell (1988) Herbig, G. H., & Bell, K. R. 1988, Lick Observatory Bulletin, Santa Cruz: Lick Observatory, —c1988,
- Higdon et al. (2004) Higdon, S. J. U., et al. 2004, PASP, 116, 975
- Hofmeister et al. (1992) Hofmeister, A. M., Rose, T. P., Hoering, T. C., & Kushiro, I. 1992, Journal of Physical Chemistry , 96, 10213
- Honda et al. (2003) Honda, M., Kataza, H., Okamoto, Y. K., Miyata, T., Yamashita, T., Sako, S., Takubo, S., & Onaka, T. 2003, ApJ, 585, L59
- Houck et al. (2004) Houck, J. R., et al. 2004, ApJS, 154, 18
- Jaeger et al. (1998) Jaeger, C., Molster, F. J., Dorschner, J., Henning, T., Mutschke, H., & Waters, L. B. F. M. 1998, A&A, 339, 904
- Jensen et al. (1996) Jensen, E. L. N., Mathieu, R. D., & Fuller, G. A. 1996, ApJ, 458, 312
- Jensen & Mathieu (1997) Jensen, E. L. N., & Mathieu, R. D. 1997, AJ, 114, 301
- Kamp & Dullemond (2004) Kamp, I., & Dullemond, C. P. 2004, ApJ, 615, 991
- Kastner et al. (2006) Kastner, J. H., Buchanan, C. L., Sargent, B., & Forrest, W. J. 2006, ApJ, 638, L29
- Kemper et al. (2004) Kemper, F., Vriend, W. J., & Tielens, A. G. G. M. 2004, ApJ, 609, 826 (erratum: 633, 534)
- Kenyon et al. (1994) Kenyon, S. J., Dobrzycka, D., & Hartmann, L. 1994, AJ, 108, 1872
- Kenyon & Hartmann (1995) Kenyon, S. J., & Hartmann, L. 1995, ApJS, 101, 117
- Kimura & Nuth (2007) Kimura, Y., & Nuth, J. A., III 2007, ApJ, 664, 1253
- Klein & Hurlbut (1977) Klein, C., & Hurlbut, C. S., Jr. 1977 Manual of Mineralogy, John Wiley and Sons, Inc., 21, 681
- Koike & Hasegawa (1987) Koike, C., & Hasegawa, H. 1987, Ap&SS, 134, 361
- Koike et al. (1989) Koike, C., Komatuzaki, T., Hasegawa, H., & Asada, N. 1989, MNRAS, 239, 127
- Li & Draine (2001) Li, A., & Draine, B. T. 2001, ApJ, 550, L213
- Li & Draine (2002) Li, A., & Draine, B. T. 2002, ApJ, 564, 803
- Lisse et al. (2007) Lisse, C. M., Kraemer, K. E., Nuth, J. A., Li, A., & Joswiak, D. 2007, Icarus, 191, 223
- Luhman (2004) Luhman, K. L. 2004, ApJ, 602, 816
- Luhman (2008) Luhman, K. L. 2008, in ASP Conf. Ser. : Handbook of Star Forming Regions, submitted
- MacKinnon & Rietmeijer (1987) MacKinnon, I. D. R., & Rietmeijer, F. J. M. 1987, Reviews of Geophysics, 25, 1527
- Marshall et al. (2007) Marshall, J. A., Herter, T. L., Armus, L., Charmandaris, V., Spoon, H. W. W., Bernard-Salas, J., & Houck, J. R. 2007, ApJ, 670, 129
- Mathieu et al. (1989) Mathieu, R. D., Walter, F. M., & Myers, P. C. 1989, AJ, 98, 987
- McClure et al. (2008) McClure, M. K., et al. 2008, in preparation
- Merrill (1974) Merrill, K. M. 1974, Icarus, 23, 566
- Metchev (2006) Metchev, S. A. 2006, Ph.D. Thesis,
- Mikouchi et al. (2007) Mikouchi, T., Tachikawa, O., Hagiya, K., Ohsumi, K., Suzuki, Y., Uesugi, K., Takeuchi, A., & Zolensky, M. E. 2007, Lunar and Planetary Institute Conference Abstracts, 38, 1946
- Montmerle et al. (1983) Montmerle, T., Koch-Miramond, L., Falgarone, E., & Grindlay, J. E. 1983, ApJ, 269, 182
- Mutschke et al. (1998) Mutschke, H., Begemann, B., Dorschner, J., Guertler, J., Gustafson, B., Henning, T., & Stognienko, R. 1998, A&A, 333, 188
- Norton (2002) Norton, O. R. 2002, The Cambridge Encyclopedia of Meteorites, by O. Richard Norton, pp. 374. ISBN 0521621437. Cambridge, UK: Cambridge University Press, March 2002.,
- Palik (1985) Palik, E. D. 1985, Academic Press Handbook Series, New York: Academic Press, 1985, edited by Palik, Edward D.,
- Pascucci et al. (2007) Pascucci, I., et al. 2007, ApJ, 663, 383
- Pilipp et al. (1998) Pilipp, W., Hartquist, T. W., Morfill, G. E., & Levy, E. H. 1998, A&A, 331, 121
- Plyusnina et al. (1970) Plyusnina, I. I., Maleyev, N. M. & Yefimova, G. A. 1970, J Solid State Chem, 44, 24
- Posch et al. (2007) Posch, T., Mutschke, H., Trieloff, M., & Henning, T. 2007, ApJ, 656, 615
- Prato & Simon (1997) Prato, L., & Simon, M. 1997, ApJ, 474, 455
- Preibisch et al. (1998) Preibisch, T., Guenther, E., Zinnecker, H., Sterzik, M., Frink, S., & Roeser, S. 1998, A&A, 333, 619
- Ratzka et al. (2005) Ratzka, T., Köhler, R., & Leinert, C. 2005, A&A, 437, 611
- Reipurth & Zinnecker (1993) Reipurth, B., & Zinnecker, H. 1993, A&A, 278, 81
- Rietmeijer & McKay (1985) Rietmeijer, F. J. M., & McKay, D. S. 1985, Meteoritics, 20, 743
- Rietmeijer & McKay (1986) Rietmeijer, F. J. M., & McKay, D. S. 1986, Lunar and Planetary Institute Conference Abstracts, 17, 710
- Rietmeijer et al. (1986) Rietmeijer, F. J. M., Nuth, J. A., & MacKinnon, I. D. R. 1986, Icarus, 66, 211
- Rietmeijer et al. (1999) Rietmeijer, F. J. M., Nuth, J. A., III, & Karner, J. M. 1999, ApJ, 527, 395
- Rietmeijer et al. (2002) Rietmeijer, F. J. M., Hallenbeck, S. L., Nuth, J. A., & Karner, J. M. 2002, Icarus, 156, 269
- Rokita et al. (1998) Rokita, M., Handke, M., & Mozgawa, W. 1998, Journal of Molecular Structure , 450, 213
- Sargent et al. (2006) Sargent, B., et al. 2006, ApJ, 645, 395
- Sargent et al. (2008) Sargent, B., et al. 2008, in preparation
- Schaefer et al. (2006) Schaefer, G. H., Simon, M., Beck, T. L., Nelan, E., & Prato, L. 2006, AJ, 132, 2618
- Servoin & Piriou (1973) Servoin, J. L., & Piriou, B. 1973, Physica Status Solidi B Basic Research , 55, 677
- Shu et al. (1996) Shu, F. H., Shang, H., & Lee, T. 1996, Science, 271, 1545
- Silverstone et al. (2006) Silverstone, M. D., et al. 2006, ApJ, 639, 1138
- Simon et al. (1996) Simon, M., Holfeltz, S. T., & Taff, L. G. 1996, ApJ, 469, 890
- Sogawa et al. (2006) Sogawa, H., Koike, C., Chihara, H., Suto, H., Tachibana, S., Tsuchiyama, A., & Kozasa, T. 2006, A&A, 451, 357
- Spitzer & Kleinman (1961) Spitzer, W. G., & Kleinman, D. A. 1961, Physical Review , 121, 1324
- Steyer et al. (1974) Steyer, T. R., Day, K. L., & Huffman, D. R. 1974, Appl. Opt., 13, 1586
- Swainson & Dove (1993) Swainson, I. P., & Dove, M. T. 1993, Physical Review Letters, 71, 193
- Takami et al. (2003) Takami, M., Bailey, J., & Chrysostomou, A. 2003, A&A, 397, 675
- Tuttle & Bowen (1958) Tuttle, O. F., & Bowen, N. L. 1958, Geol. Soc. Am. Mem. , 74, 1-153
- Uchida et al. (2004) Uchida, K. I., et al. 2004, ApJS, 154, 439
- Walter (1992) Walter, F. M. 1992, AJ, 104, 758
- Watson et al. (2007) Watson, D. M., et al. 2007, Nature, 448, 1026
- Wenrich & Christensen (1996) Wenrich, M. L., & Christensen, P. R. 1996, J. Geophys. Res., 101, 15921
- Werner et al. (2004) Werner, M. W., et al. 2004, ApJS, 154, 1
- Wilking et al. (2005) Wilking, B. A., Meyer, M. R., Robinson, J. G., & Greene, T. P. 2005, AJ, 130, 1733
- Williams et al. (1993) Williams, Q., Hemley, R. J., Kruger, M. B., & Jeanloz, R. 1993, J. Geophys. Res., 98, 22157
- Zolensky et al. (2006) Zolensky, M. E., et al. 2006, Science, 314, 1735
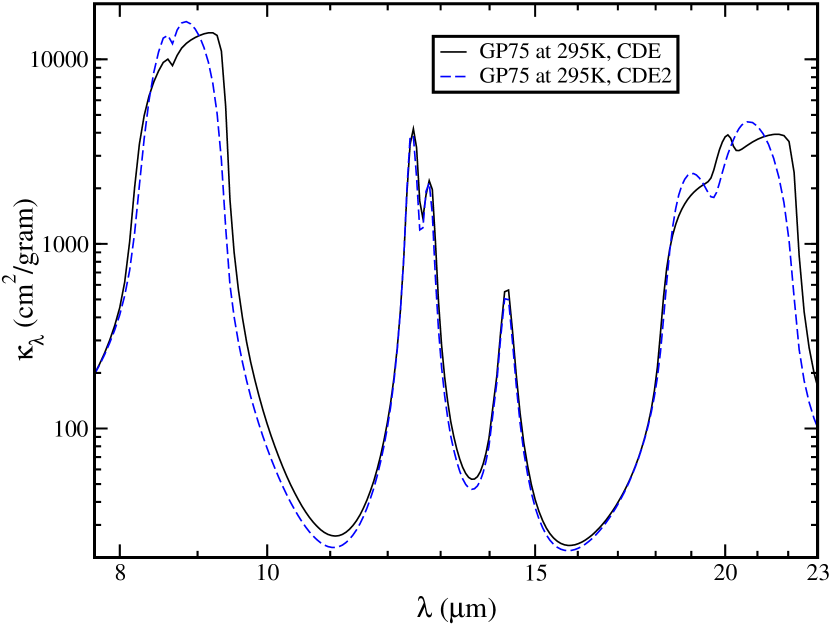
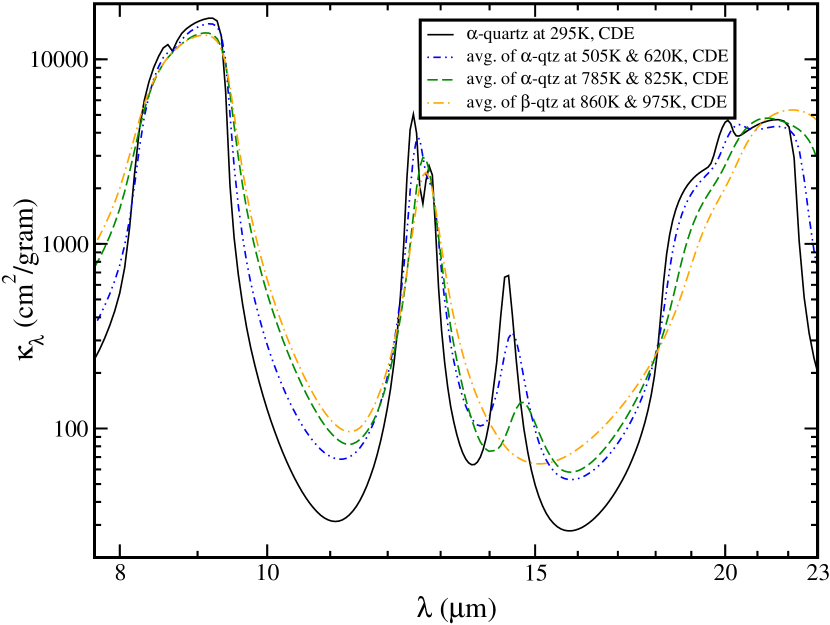
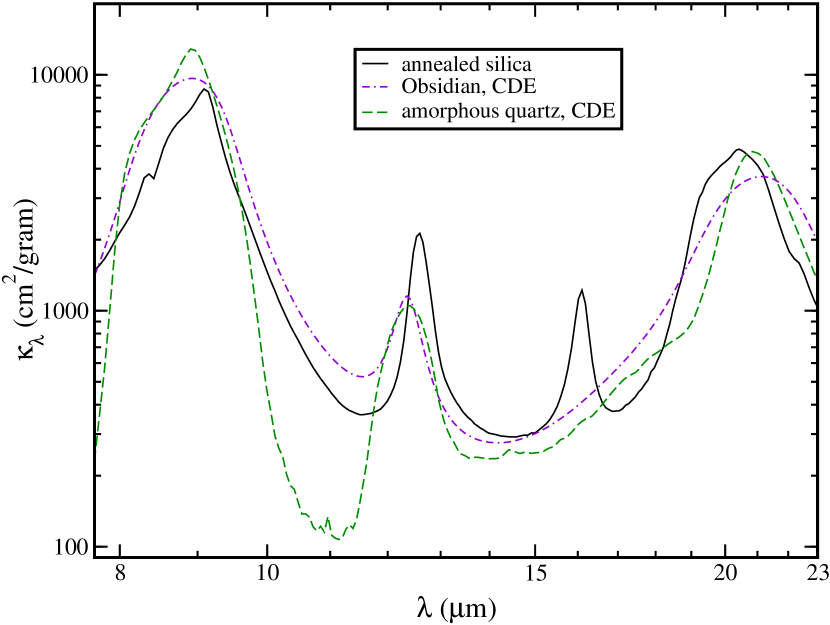

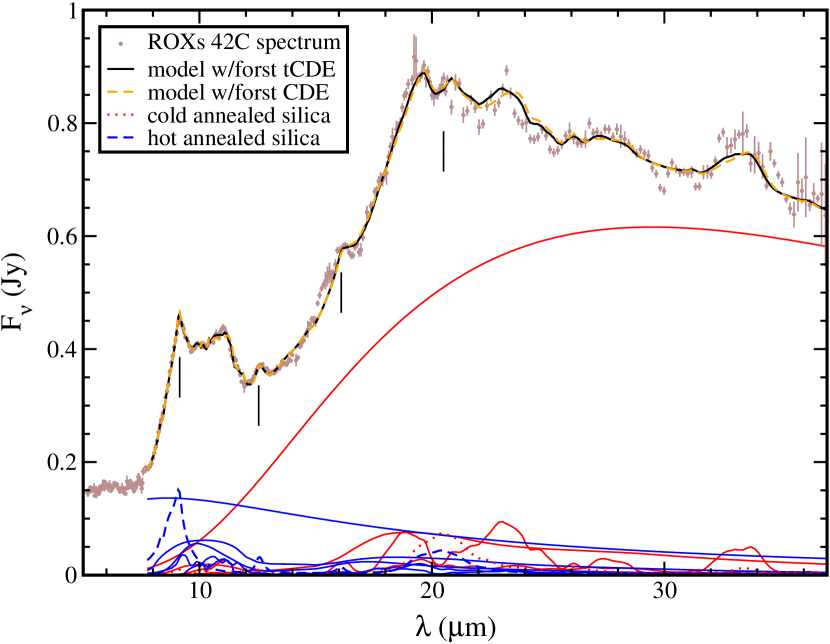

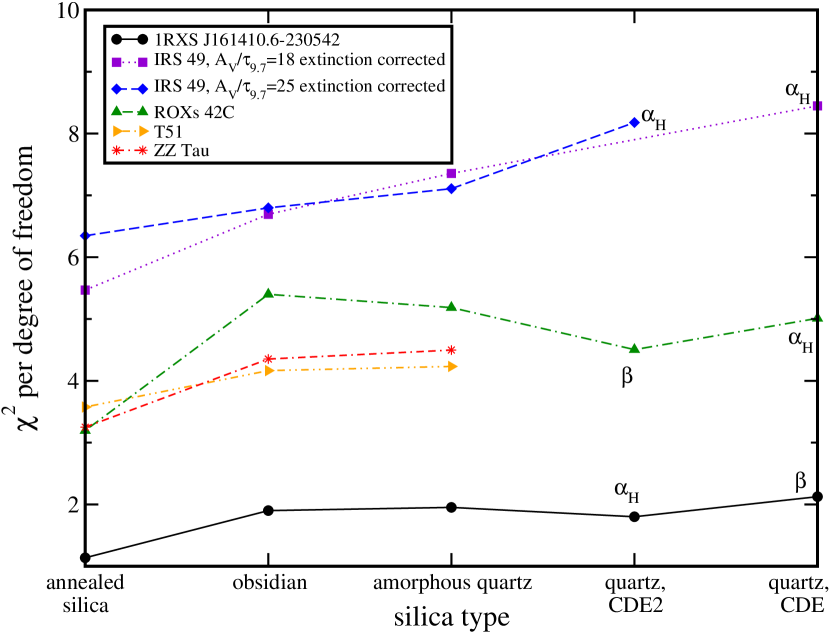
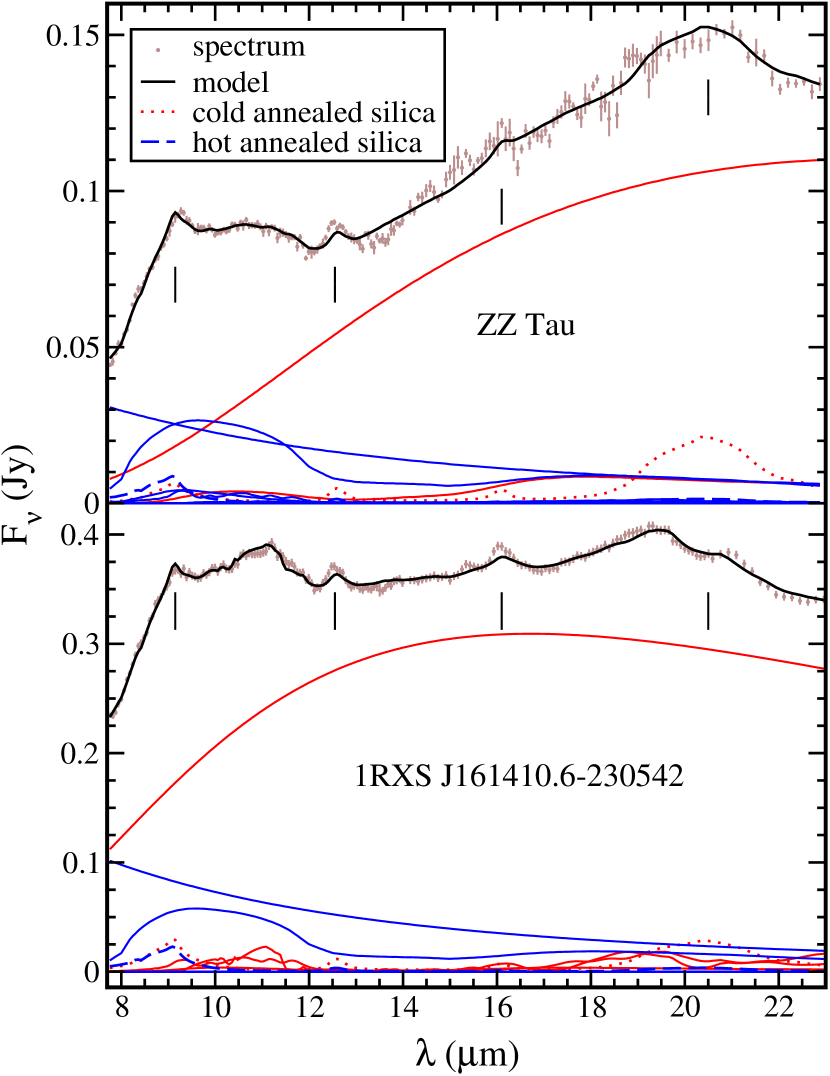
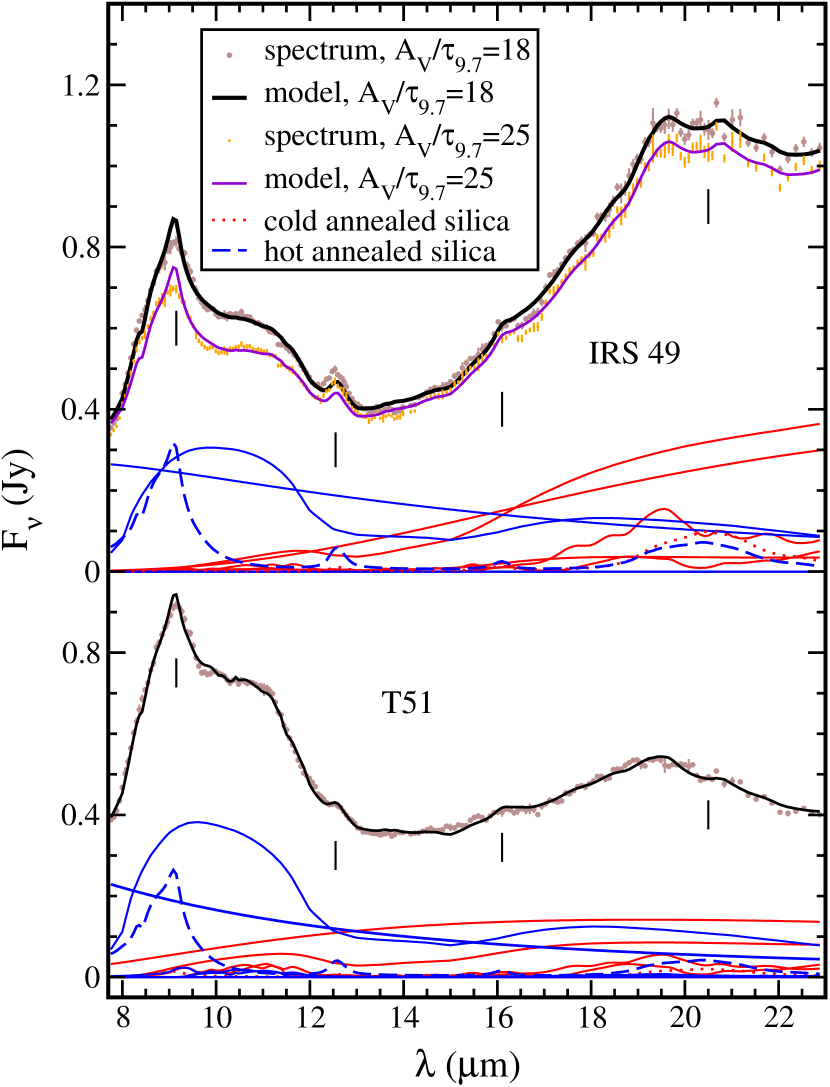
| R.A. | Decl. | Spectral | ||||||||
|---|---|---|---|---|---|---|---|---|---|---|
| Object | AOR | # in AOR | (J2000) | (J2000) | Type | AV | Teff | dist. | Refs. | |
| (1) | (2) | (3) | (4) | (5) | (6) | (7) | (8) | (9) | (10) | (11) |
| 1RXS J161410.6-230542 | 5206272 | 16 14 11.08 | -23 05 36.2 | K0 | 1.48 | 4963 | 5.18 | 144 | 1,2,3 | |
| IRS 49 | 12698624 | 6 | 16 27 38.31 | -24 36 58.7 | K5.5 | 10.7 | 140 | 4,5,6 | ||
| ROXs 42C | 12676352 | 1 | 16 31 15.75 | -24 34 02.2 | K6 | 1.9 | 4205 | 8.54 | 140 | 6,7 |
| T51 | 12696576 | 4 | 11 12 24.41 | -76 37 06.4 | K3.5 | 0 | 160 | 8,9 | ||
| ZZ Tau | 3546880,16261376 | 04 30 51.38 | +24 42 22.3 | M3 | 1.44 | 3470 | 4.90 | 140 | 10,11,12 |
| small | small | large | large | Total | ||||||||
|---|---|---|---|---|---|---|---|---|---|---|---|---|
| Temp | silica | Amorphous | Amorph. | Amorph. | Amorph. | Crystalline | Crystalline | Dust | ||||
| Object | (K) | type | SilicaaaOptical properties and opacities for various types of silica from references given in text. In the table, “annSil” means annealed silica, “qCDElt” means an average of the CDE opacity curves obtained for -quartz at 505K and 620K from Gervais & Piriou (1975); “qCDE2lt” means the same, but for CDE2; “qCDEht” means an average of CDE opacity curves for -quartz at 785K and 825K from Gervais & Piriou (1975); “qCDE2” means the same, but for CDE2; “obsid” means obsidian; and “amsil” means amorphous SiO2. | PyroxenebbOptical constants for amorphous pyroxene Mg0.7Fe0.3SiO3 from Dorschner et al. (1995), assuming CDE2 (Fabian et al., 2001) | OlivineccOptical constants for amorphous olivine MgFeSiO4 from Dorschner et al. (1995), assuming CDE2 | PyroxeneddOptical constants for amorphous pyroxene Mg0.7Fe0.3SiO3 from Dorschner et al. (1995), using the Bruggeman EMT and Mie theory (Bohren & Huffman 1983) with a volume fraction of vacuum of = 0.6 for porous spherical grains of radius 5 | OlivineeeOptical constants for amorphous olivine MgFeSiO4 from Dorschner et al. (1995), using the Bruggeman EMT and Mie theory (Bohren & Huffman 1983) with a volume fraction of vacuum of = 0.6 for porous spherical grains of radius 5 | PyroxeneffOpacities for crystalline pyroxene Mg0.9Fe0.1SiO3 from Chihara et al. (2002) | forsteriteggOptical constants for 3 crystallographic axes of forsterite, Mg2SiO4, from Sogawa et al. (2006), assuming tCDE (see discussion in Section 3.3 of this paper) shape distribution. | Mass | ||
| (1) | (2) | (3) | (4) | (5) | (6) | (7) | (8) | (9) | (10) | (11) | (12) | (13) |
| 1RXS J161410.6 | 305 | 57.5 0.8 | annSil | 35.7 17.3 | 0 | 12.0 16.3 | 0 | 0 | 26.1 14.5 | 26.3 14.2 | 0.815 | 1.1 |
| -230542 | 1401 | 0.329 0.020 | “” | 5.6 3.2 | 0 | 0 | 94.4 16.0 | 0 | 0 | 0 | 0.0474 | |
| IRS 49hhExtinction corrected using A=18; =0.6 | 153 | 540 34 | annSil | 6.2 2.5 | 0 | 7.8 3.6 | 0 | 70.6 6.4 | 12.2 2.6 | 3.2 2.5 | 176 | 5.5 |
| 751 | 3.36 0.11 | “” | 14.0 1.5 | 0 | 0 | 86.0 4.5 | 0 | 0 | 0 | 0.904 | ||
| IRS 49iiExtinction corrected using A=25; =0.4 | 160 | 404 26 | annSil | 6.6 2.3 | 0 | 0 | 0 | 79.7 6.2 | 10.1 2.3 | 3.6 2.2 | 150 | 6.3 |
| 796 | 3.02 0.09 | “” | 16.2 1.9 | 0 | 0 | 83.8 5.2 | 0 | 0 | 0 | 0.569 | ||
| ROXs 42C | 191 | 429 9 | annSil | 20.0 5.4 | 11.6 7.7 | 32.1 7.4 | 0 | 0 | 14.6 5.1 | 21.8 5.5 | 25.3 | 3.2 |
| 1051 | 0.662 0.046 | “” | 13.8 2.6 | 5.4 3.8 | 16.5 4.5 | 57.1 6.8 | 0 | 5.8 3.3 | 1.5 3.2 | 0.172 | ||
| ROXs 42C | 172 | 613 16 | qCDElt | 9.5 6.4 | 0 | 37.7 10.1 | 0 | 0 | 42.9 10.5 | 9.9 5.9 | 32.9 | 5.0 |
| 601 | 4.18 0.15 | qCDEht | 18.4 3.8 | 0 | 69.1 11.4 | 0.1 9.5 | 0 | 0 | 12.3 4.4 | 0.393 | ||
| ROXs 42C | 191 | 421 9 | qCDE2lt | 15.1 4.4 | 0 | 15.1 5.5 | 0 | 39.5 6.8 | 16.3 4.2 | 14.1 4.0 | 30.3 | 4.5 |
| 1151 | 0.707 0.039 | qCDE2 | 3.9 2.3 | 70.3 13.9 | 0 | 0 | 0 | 19.4 5.9 | 6.4 5.1 | 0.0900 | ||
| ROXs 42C | 191 | 400 9 | amsil | 17.9 5.1 | 0 | 33.8 7.0 | 0 | 0 | 29.7 6.0 | 18.6 4.8 | 27.4 | 5.2 |
| 751 | 1.86 0.09 | “” | 10.3 3.3 | 59.0 12.4 | 17.4 7.8 | 0 | 0 | 8.2 5.8 | 5.2 5.3 | 0.193 | ||
| ROXs 42C | 210 | 275 6 | obsid | 25.7 4.1 | 21.8 4.9 | 22.5 4.5 | 0 | 0 | 15.7 3.4 | 14.3 3.2 | 24.8 | 5.4 |
| 1401 | 0.376 0.028 | “” | 25.1 8.1 | 0 | 62.8 18.1 | 0 | 0 | 9.9 8.1 | 2.3 7.8 | 0.0427 | ||
| T51 | 267 | 39.2 1.7 | annSil | 4.8 3.6 | 0 | 0 | 0 | 70.9 9.3 | 15.2 3.9 | 9.2 3.6 | 6.14 | 3.6 |
| 1351 | 0.792 0.037 | “” | 9.1 1.1 | 0 | 0 | 88.2 4.0 | 0 | 1.8 1.5 | 1.0 1.4 | 0.356 | ||
| ZZ Tau | 210 | 62.9 1.5 | annSil | 45.8 23.8 | 0 | 54.2 27.1 | 0 | 0 | 0 | 0 | 1.46 | 3.3 |
| 1251 | 0.123 0.007 | “” | 4.2 1.9 | 5.5 3.2 | 0 | 85.5 8.2 | 0 | 4.2 2.9 | 0.5 2.8 | 0.0290 |
Note. — Col. (1): Object name. Col. (2): Spitzer Astronomical Observation Request number. Col. (3): If multiple objects observed in AOR, then specifies which one observed. If only one object in AOR, then no number specified. Col. (4): Right Ascension of object in J2000 coordinates. Col (5): Declination of object in J2000 coordinates. Col. (6): Spectral type of object. Col. (7): Extinction at V band in magnitudes. Col. (8): If stellar photosphere emission was subtracted from the IRS spectrum, then this entry is the effective temperature of the star which is the temperature of the blackbody representing stellar photosphere emission normalized to the dereddened J-band flux density. If stellar photosphere emission not subtracted, then no effective temperature specified. Col. (9): If stellar photosphere emission subtracted, then solid angle in units of 10-19 steradians of blackbody representing stellar photosphere emission. Obtained by dividing dereddened J band flux density by Planck function evaluated at isophotal wavelength of J band and at temperature specified in previous column; if no stellar photosphere emission subtracted, then no solid angle specified. Col. (10): Assumed distance to object, in parsecs. Col. (11): References from which spectral type, AV, and distance are obtained. 1 - Preibisch et al. (1998); 2 - Pascucci et al. (2007); 3 - de Zeeuw et al. (1999); 4 - Wilking et al. (2005); 5 - McClure et al. (2008); 6 - Bontemps et al. (2001); 7 - Bouvier & Appenzeller (1992); 8 - Luhman (2004); 9 - Luhman (2008); 10 - Herbig & Bell (1988); 11 - Furlan et al. (2006); 12 - Kenyon et al. (1994). For 1RXS J161410.6-230542, Teff comes from Pascucci et al. (2007); for ROXs 42C and ZZ Tau, Teff comes from Kenyon & Hartmann (1995) based on the spectral type from column 4.
Note. — Col. (1): Object name. Col. (2): One of two dust model temperatures (Kelvin). Col. (3): Solid angle, , of blackbody of temperature specified in Col. (2) representing continuum emission, expressed in units of steradians. Col. (4): Type of silica used in model. Cols. (5)-(11): mass percentages of all dust mass at temperature specified in Col. (2). One dust model is completely specified by two adjacent rows - the row following the object′s name and the row beneath that one. Col. (12): Total dust mass at one temperature in lunar masses, computed assuming distances to each object as listed in Table 1. Col. (13): per degree of freedom, determined over 7.7 23.
| Correction to | “ ” | “ ” | “ ” | “ ” | “ ” | “ ” | “ ” | |
|---|---|---|---|---|---|---|---|---|
| Object | SL2nod1 | SL2nod2 | SL1nod1 | SL1nod2 | LL2nod1 | LL2nod2 | LL1nod1 | LL1nod2 |
| (1) | (2) | (3) | (4) | (5) | (6) | (7) | (8) | (9) |
| 1RXS J161410.6-230542 | 1.03 | 1.03 | 1.03 | 1.03 | 1.00 | 1.00 | 1.00 | 1.00 |
| IRS 49 | 1.00 | 1.04 | 1.00 | 1.04 | 1.00 | 1.04 | 1.00 | 1.01 |
| ROXs 42C | 1.00 | 1.00 | 1.00 | 1.00 | 1.00 | 1.02 | 1.00 | 1.00 |
| T51 | 1.00 | 1.00 | 1.00 | 1.00 | 1.00 | 1.01 | 1.00 | 1.01 |
| ZZ Tau | 1.00-1.10 | 1.00-1.10 | 1.00-1.14 | 1.02-1.07 | 0.99-1.09 | 1.00-1.09 | 1.00-1.08 | 1.02-1.08 |