Multi-wavelength X-ray/mid-infrared observations of GRS 1915+105
Abstract:
We report preliminary results of mid-infrared (MIR) and X-ray observations of GRS 1915+105 that we carried out between 2004 October 2 and 2006 June 5. Our main goals were to study its variability, to detect the presence of dust, and to investigate the possible links between MIR and X-ray emissions.
We performed photometric and spectroscopic observations of GRS 1915+105, using the IRAC photometer and the IRS spectrometer mounted on the Spitzer Space Telescope. We completed our set of MIR data with quasi-simultaneous high-energy data obtained with RXTE and INTEGRAL.
In the hard state, we detect PAH emission features in the MIR spectrum of GRS 1915+105, which prove the presence of dust in the system. The dust is confirmed by the detection in the hard state of a warm MIR excess in the broadband spectral energy distribution of GRS 1915+105. This excess cannot be explained by the MIR synchrotron emission from the compact jets as GRS 1915+105 was not detected at 15 GHz with the Ryle telescope. We also show that the MIR emission of GRS 1915+105 is strongly variable; it is likely correlated to the soft X-ray emission as it increases in the soft state. We suggest that, beside the dust emission, part of the MIR excess in the soft state is non-thermal, and could be due either to free-free emission from an X-ray driven wind or X-ray reprocessing in the outer part of the accretion disc.
1 Introduction
GRS 1915+105 was discovered in 1992 by the WATCH instrument on board the high-energy satellite GRANAT ([2], [3]). It became the first known Galactic source exhibiting superluminal radio jets when [18] reported the VLA detection of radio outflows having an apparent superluminal velocity. It is a Galactic low-mass X-ray binary (LMXB), composed of a 144 black hole ([11]), accreting matter from a 0.810.53 K giant companion star ([12], [13]). The orbital period of the system is about 30.80.2 days ([22]), and its distance is 93 kpc ([4]).
GRS 1915+105 is strongly variable in the X-ray, near-infrared (NIR), and radio bands, on timescales from second to days. Previous multi-wavelength studies showed a strong connection between the accretion disc instabilities and plasma outflows (giant flares, compact jets, plasma bubbles) emitting at NIR and/or radio wavelengths through synchrotron processes ([6], [7], [5], [20], [8], [9]). Moreover, [25] argue that about 20%30% of the K flux is due to reprocessing in the outer part of the accretion disc.
Few mid-infrared (MIR) observations of GRS 1915+105 were performed. Indeed, only [10] reported MIR photometry carried out with the ISOCAM camera on board the Infrared Space Observatory (ISO) satellite. The authors observed GRS 1915+105 at two different epochs, corresponding to an intermediate soft state and a plateau state of the source. They showed that, even if the flux uncertainties were high, the MIR flux of GRS 1915+105 was likely variable, and they reported a MIR excess, either due to the presence of dust, or to the synchrotron emission from compact jets, which is the explanation the authors favoured.
In this paper, we report the photometric and spectroscopic observations of GRS 1915+105 that we carried out with IRAC and IRS instruments on board the Spitzer Space Telescope. We also used quasi-simultaneous RXTE and INTEGRAL data. Our goals were:
-
•
to confirm the variability of the MIR emission of GRS 1915+105.
-
•
to search for correlations between its MIR and X-ray/radio emissions.
-
•
to investigate the presence of dust through MIR spectroscopy.
-
•
to study the evolution of the spectrum of GRS 1915+105 with respect to its high-energy states.
We point out that in this work, for simplification, we will call hard state a phase during which the accretion disc is faint, and soft state a phase when it is brighter.
In Sect. 2, we give details on our observations and their reduction. In Sect. 3, we show the X-ray, MIR, and radio lightcurves of GRS 1915+105. In Sect. 4, we explain how we assembled and fitted the broadband X-ray to MIR spectral energy distributions (SEDs) of GRS 1915+105, and we show the MIR spectra in Sect. 5. We finally discuss the outcomes in Sect. 6.
2 Observations
We performed, between 2004 October 2 and 2006 June 5, sixteen photometric and spectroscopic observations of GRS 1915+105 with the IRAC photometer and the IRS spectrometer (PI Fuchs), both mounted on the Spitzer Space Telescope.
We also carried out several observations of GRS 1915+105 with INTEGRAL (PI Rodriguez), and
several were quasi-simultaneous with our MIR observations. Finally, the source is regularly
monitored with RXTE (PI Morgan, the data are immediately public). We browsed the archival data to search for pointings at high energies quasi-simultaneous with our
MIR observations. Several such pointings were found.
2.1 IRAC photometry and IRS spectroscopy
GRS 1915+105 was observed with IRAC at 3.6 m, 4.5 m, 5.8 m, and 8 m. We performed photometry on the post-Basic Calibration Data (post-BCD) using the software Starfinder, part of the Scisoft package from ESO, well-suited for point-source photometry in crowded fields. Post-BCD data are raw data on which the Spitzer pipeline performs dark subtraction, multiplexer bleed correction, detector linearization, flatfielding, cosmic ray detection, flux calibration, pointing refinement, mosaicking, and coaddition. GRS 1915+105 was always detected, in all filters (see Table 1).
We also performed spectroscopy of GRS 1915+105 with IRS using the SL2 (5.2 m 7.7 m) and SL1 (7.4 m 14.5 m) modules, with the IRS Peak-up option for a better pointing accuracy. BCD data were reduced following the standard procedure given in the IRS Data Handbook 111http://ssc.spitzer.caltech.edu/irs/dh/dh32.pdf. The basics steps were sky subtraction, bad pixels correction, as well as extraction and calibration (wavelength and flux) of the spectra with the Spizer IRS Custom Extraction (Spice) software for each nod. Spectra were then nod-averaged to improve the signal-to-noise ratio (SNR). GRS 1915+105 was always detected with SNRs good enough to allow the identification of spectroscopic features.
2.2 RXTE and INTEGRAL observations
The RXTE data were reduced with the HEASoft V6.5 software
package, following the standard steps presented in the RXTE cook
book, and ABC guide. See e.g. [23] and [24], for the details of
good time filtering, background estimates, extraction of lightcurves and spectra,
generation of response matrices . Following these steps, we extracted lightcurves in the
same three energy ranges as [1], in order to classify a given observation in terms
of type of variability ([1]). Spectra were then
extracted from entire observations even from those showing clear spectral variations
between the three spectral states, A, B, and C discussed in [1].
The INTEGRAL data from Rev #373 are presented in great details in [23] and [24] while Rev #431 is not discussed anywhere else. The data have been reduced with the OSA v7.0 software. Because of the wide field of view of INTEGRAL, all bright sources have to be taken into account when extracting the data products. We then first ran the software until the production of images, that allowed us to identify those bright sources (defined as DETSIG6) . All of them were considered during the extraction of spectra and light curves (see [23] for the list of sources in the case of Rev #373).
3 Correlations
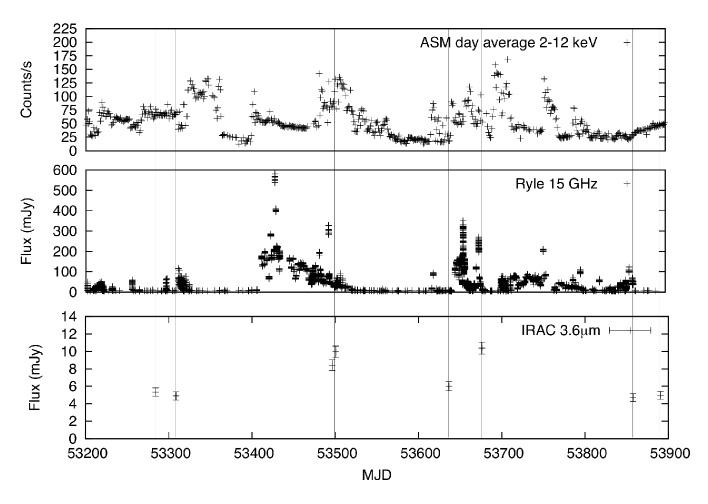
Middle: Ryle Radio Telescope lightcurve of GRS 1915+105 at 15 GHz (see also [23] and [24], courtesy G. G. Pooley).
Bottom: IRAC lightcurve of GRS 1915+105 at 3.6 m.
We first searched for X-ray/MIR/radio correlations by comparing the GRS 1915+105 data in these domains. Figure 1 displays the day average 212 keV RXTE/ASM lightcurve, as well as the 15 GHz Ryle Radio Telescope (PI Pooley) and the 3.6 m IRAC lightcurves between MJD 53200 and MJD 53900.
We do not have enough MIR data to search for accurate correlations, and they, moreover, are integrated over a long exposure time considering the very rapid X-ray to radio flux variations GRS 1915+105 can exhibit. Nevertheless, the comparison between IRAC and ASM lightcurves shows that the strongly variable MIR flux of GRS 1915+105 increases when the accretion disc enters into a very unstable state, while it is low and steady when GRS 1915+105 is in a stable state. This behaviour seems to indicate an X-ray/MIR correlation. On the contrary, the comparison between radio and MIR lightcurves does not allow any conclusion as the MIR flux of GRS 1915+105 does not seem to follow any parallel evolution to its radio emission.
4 SED
For each quasi-simultaneous IRAC and RXTE/INTEGRAL data, we built the X-ray to MIR broadband SEDs of GRS 1915+105, for different states of the source. We then fitted each of them, respecting the following procedure:
-
•
the high-energy fluxes were fitted with a model consisting of a multicolor blackbody (accretion disc), a gaussian (iron feature at 6.5 keV), and a powerlaw component, all modified by absorption. The absorbing column density was frozen at 5.3 atoms cm-2, following [24].
- •
-
•
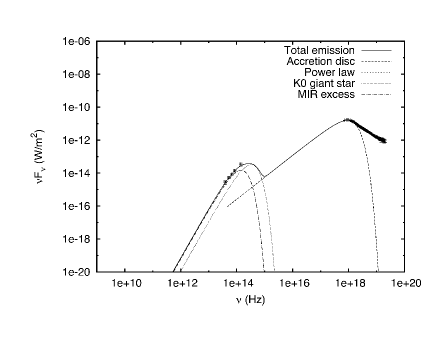
the dereddened X-ray to MIR broadband SED was finally fitted using a model including the previously found accretion disc, gaussian, and powerlaw, as well as a stellar blackbody for the companion star.
Each time, we tried to reproduce the infrared emission of GRS 1915+105 adding the stellar blackbody only, but we were never able to correctly fit the SED, neither in the hard nor in the soft state, since a MIR excess was always present. The companion star of GRS 1915+105 being a KM giant[12], we then froze the stellar blackbody temperature and radius to 4000 K and 25R⊙ respectively, and we added an extra blackbody component accounting for this MIR excess. Figure 2 displays two fitted broadband SEDs corresponding to the hard state (faint disc) and the soft state (bright disc) of GRS 1915+105, and Table 2 lists the best-fit parameters for the disc and the MIR excess, for each SED.
Figure 2 and the parameters given in Table 2 confirm the X-ray/MIR correlation suggested in Figure 1. Indeed, for all the SEDs we fitted using the same model with quasi-simultaneous X-ray to MIR data, the MIR flux increases with the accretion disc flux. Moreover, whether in the hard or soft state, the MIR excess best-fit temperature is constant, while its luminosity increases with the brightness of the accretion disc.
To summarize, the conclusions of the SEDs fitting are:
-
•
GRS 1915+105 exhibits a MIR excess, in the hard and soft states, which suggests the existence of a warm component in the system.
-
•
the MIR emission is correlated to the soft X-ray emission from the disc.
-
•
the MIR excess temperature is constant but its luminosity increases with the brightness of the disc, which suggests either a heating of another component by the X-ray emission, or a non-thermal origin of this increase.
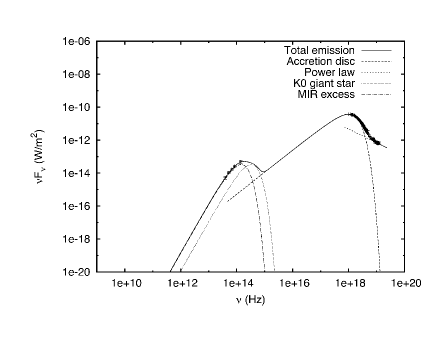
Right: X-ray to MIR broadband SED of GRS 1915+105 for the soft state of the source (MJD53500.571).
5 MIR spectra
We showed in the previous section that GRS 1915+105 exhibited a MIR excess when the source was in the hard or soft state. To understand the origin of this excess, we then compared several MIR spectra that we obtained for different high-energy states. Figure 3 displays two of them, obtained when GRS 1915+105 was in the hard state (faint disc) and in the soft state (bright disc). In the hard state, we clearly detect three PAH emission features at 6.2 m, 7.7 m, and 11.3 m. PAHs are strong tracers of dust, and their presence in emission in the MIR spectrum of GRS 1915+105 strongly suggests the existence of a heated dust component in the system.
Moreover, in the soft state, the MIR continuum below 8 m increases, which confirms the X-ray/MIR correlation. Note that the PAH features disappeared, which could prove that the dust was destroyed or expelled from the system. We point out that the PAH feature at 11.3 m also disappeared although there is no increase of the MIR continuum beyond 10 m, which excludes that the PAH features originate from the photoionised ISM, their disappearance being due to the pollution by the continuum.
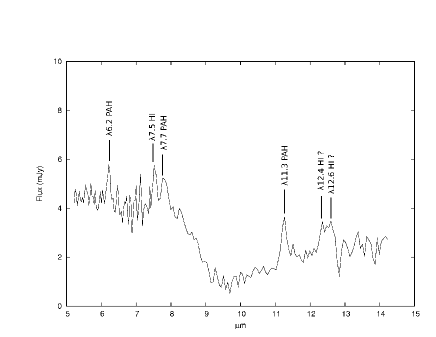
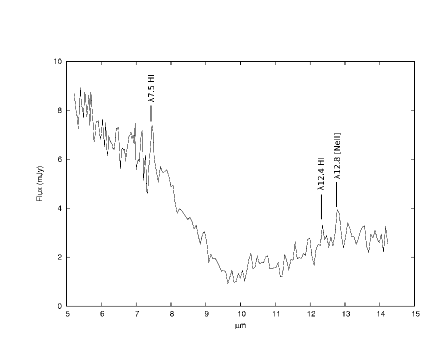
Right:MIR spectrum of GRS 1915+105 for the soft state of the source (MJD53511.697).
6 Conclusion
The MIR excess and the detection of PAH features in the hard state of GRS 1915+105 is typical of a warm circumbinary material. The presence of dust around GRS 1915+105 was already suggested by [19] and [15], and [21] showed that such component was probably responsible for the MIR excess detected in the emission of A062000 and XTE J1118338. The origin of the dust around LMXBs is still question of debate, but it could originate from the remains of a supernova fallback disc, or from the dusty giant companion star. Moreover, we show that the MIR emission of GRS 1915+105 was strongly variable and correlated to the soft X-ray emission from the accretion disc, as the MIR flux and continuum below 8 m increase in the soft state. The reasons of such correlations could be either heating of the dust by the X-ray emission, X-ray reprocessing of hard X-ray in the outer part of the disc, free-free emission of a X-ray driven wind, or synchrotron emission from a compact jet. If [16] and [17] favour the latter explanation for 4U 0614091 and GRO J165540, we exclude this possibility concerning GRS 1915+105 as synchrotron emission from a compact jet would lead to an increase of all the MIR continuum, which we do not detect beyond 10 m. Heating of the dust is also unlikely, as the PAH features disappear in the soft state. The MIR variability of GRS 1915+105 then likely originates from non-thermal processes. Whether it is due to the X-ray reprocessing or free-free emission is still a work in progress, and we need further observations and modelling to conclude.
References
- [1] Belloni, T., Klein-Wolt, M., Mendez, et al. 2000, A&A, 355, 271
- [2] Castro-Tirado, A. J., Brandt, S., Lund, N., 1992, IAU Circ. No. 5590
- [3] Castro-Tirado, A. J., Brandt, S., Lund, N., et al., 1994, ApJS, 92, 469
- [4] Chapuis, C., Corbel, S., 2004, A&A, 414, 659
- [5] Eikenberry, S. S., Matthews, K., Murphy, T. W., et al., 1998, ApJ, 506, 31
- [6] Fender, R. P., Pooley, G. G., Brocksopp, C., Newell, S. J., 1997, MNRAS, 290, 65
- [7] Fender, R. P. & Pooley, G. G., 1998, MNRAS, 300, 573
- [8] Fender, R. P. & Pooley, G. G., 2000, MNRAS, 318, L1
- [9] Fuchs, Y., Rodriguez, J., Mirabel, I. F., et al., 2003, A&A, 409, 35
- [10] Fuchs, Y., Mirabel, I. F. & Claret, A., 2003, A&A, 404, 1011
- [11] Greiner, J., Cuby, J. G., McCaughrean, M. J., 2001, Nature, 414, 522
- [12] Greiner, J., Cuby, J. G., McCaughrean, M. J., et al., 2001, A&A, 373, 37
- [13] Harlafatis, E. T. & Greiner, J., 2004, A&A, 414, 13
- [14] Indebetouw, R., Mathis, J. S., Babler, B. L., et al., 2005, ApJ, 619, 931
- [15] Lee, J. C., Reynolds, C. S., Remillard, R., et al., 2002, ApJ, 567, 1102
- [16] Migliari, S., Tomsick, J. A., Maccarone, T. J., et al., 2006, ApJ, 643, 41
- [17] Migliari, S., Tomsick, J. A., Markoff, S., et al., 2007, ApJ, 670, 610
- [18] Mirabel, I. F. & Rodriguez L. F., 1994, Nature, 371, 46
- [19] Mirabel, I. F., Rodriguez L. F., Chaty, S., et al., 1996, ApJ, 472, 111
- [20] Mirabel, I. F., Dhawan, V., Chaty, S., et al., 1998, A&A, 330, 9
- [21] Muno, M. P. & Mauerhan, J., 2006, ApJ, 648, 135
- [22] Neil, E. T., Bailyn, C. D., & Bethany, E. C., 2007, ApJ, 657, 409
- [23] Rodriguez, J., Hannikainen, D.C., Shaw, S.E., et al. 2008, ApJ, 675, 1436
- [24] Rodriguez, J., Shaw, S.E, Hannikainen, D.C., et al. 2008, ApJ, 675, 1449
- [25] Ueda, Y., Yamaoka, K., Sánchez-Fernández, C. et al., 2002, ApJ, 571, 918