AGN-Starburst connection in NGC 7582: GNIRS IFU observations
Abstract
We analyse two-dimensional near-IR band spectra from the inner 660315 pc2 of the Seyfert galaxy NGC 7582 obtained with the Gemini GNIRS IFU at a spatial resolution of 50 pc and spectral resolving power R 5900. The nucleus harbors an unresolved source well reproduced by a blackbody of temperature T 1050 K, which we attribute to emission by circumnuclear dust located closer than 25 pc from the nucleus, with total mass of M⊙. Surrounding the nucleus, we observe a ring of active star formation, apparently in the galactic plane, with radius of 190 pc, an age of 5 Myr and total mass of ionized gas of M⊙. The radiation of the young stars in the ring accounts for at least 80% of the ionization observed in the Br emitting gas, the remaining being due to radiation emitted by the active nucleus. The stellar kinematics was derived using the CO absorption band at m and reveals: (1) a distorted rotation pattern in the radial velocity field with kinematic center apparently displaced from the nuclear source by a few tens of parsecs; (2) a high velocity dispersion in the bulge of km s-1; (3) a partial ring of km s-1, located close to the Br emitting ring, but displaced by 50 pc towards the nucleus, interpreted as due to stars formed from cold gas in a previous burst of star formation. The kinematics of the ionized gas shows a similar rotation pattern to that of the stars, plus a blueshifted component with velocities 100 km s-1 interpreted as due to an outflow along the ionization cone, which was partially covered by our observations. The mass outflow rate in the ionized gas was estimated as , which is one order of magnitude larger than the accretion rate to the active galactic nucleus (AGN), indicating that the outflowing gas does not originate in the AGN, but is instead the circumnuclear gas from the host galaxy being pushed away by a nuclear outflow. The flux distribution and kinematics of the hot molecular gas, traced by the H 2.22m emission line, suggests that most of this gas is in the galactic plane. An excess blueshift along PA, where a nuclear bar has been observed, can be interpreted as an inflow towards the nucleus. We thus conclude that the H2 kinematics traces the feeding of the AGN, while the ionized gas kinematics traces its feedback via the outflows. An AGN-Starburst connection in the nucleus of NGC 7582 is supported by the ratio between the mass accretion rate and the star formation rate in the circumnuclear region of 0.26%, which is close to the expected relation between the mass of the SMBH and that of the host galaxy bulge in galaxies (the Magorrian relation).
keywords:
galaxies: Seyfert – infrared: galaxies – galaxies: NGC 7582 (individual) – galaxies: kinematics – galaxies: outflows – galaxies: starburst1 Introduction
Many recent studies on the stellar population in the vicinity of active galactic nuclei (hereafter AGN) report an excess of young to intermediate age stars in the inner few hundred parsecs when compared to non-active galaxies (e.g. Heckman et al., 1997; González Delgado et al., 1998; Schmitt & Kinney, 2000; Cid Fernandes et al., 2001; Storchi-Bergmann et al., 2001; Kauffmann et al., 2003; Cid Fernandes et al., 2005; Davies et al., 2007). This excess supports the existence of the so-called AGN-Starburst connection (Perry & Dyson, 1985; Terlevich & Melnick, 1985; Norman & Scoville, 1988; Cid Fernandes & Terlevich, 1995), which can be understood as due to the fact that both circumnuclear star formation and nuclear activity feed on gas inflowing towards the nuclei of galaxies. The gas infllow, if massive enough, in its way to the centre, may trigger circumnuclear star formation, and, reaching the nucleus, also the nuclear activity. Alternatively, there may be a delay in the triggering of the nuclear activity, which would be fed via mass loss from the evolving stars. The AGN-Starburst connection is consistent and somewhat expected within the presently favored scenario of co-evolution of galaxies and their nuclear supermassive black holes (SMBH), supported by the M relation (Tremaine et al., 2002; Ferrarese & Merrit, 2000; Gebhardt et al., 2000): if the bulge grows via the formation of new stars (starbursts), and the SMBH grows via mass accretion from its surroundings, one could expect a relation between the nuclear mass accretion rate and the star-formation rate in circumnuclear starbursts.
The mechanism through which the gas makes its way from the circumnuclear regions of star formation – which in many cases have a ring-like morphology – to the AGN are nevertheless still elusive. In Simões Lopes et al. (2007), using optical images obtained with the Hubble Space Telescope (HST) of the inner few hundred parsecs of both active and non-active galaxies, the authors concluded that there is a strong correlation between the presence of dusty structures (spirals and filaments) and nuclear activity in early-type galaxies, proposing that these structures trace the material in its way in to feed the active nucleus. Recently, this was shown to be the case for at least two low-activity AGN with circumnuclear rings of star-formation: NGC 1097 (Fathi et al., 2006) and NGC 6951 (Storchi-Bergmann et al., 2007). In these two galaxies, the authors have observed streaming motions along nuclear spirals in the H emitting gas. Another similar case is the Seyfert galaxy NGC 4051 where Riffel et al. (2008) found streaming motions along a nuclear spiral in molecular gas emitting the H2.1218m line.
Inflows towards AGN are difficult to observe, particularly in ionized gas, due the predominance of emission from outflowing gas in the vicinity of the active nucleus. The inflow probably occurs mostly in “cold” gas, while the outflows are seen in ionized gas (e.g. Crenshaw & Kraemer, 2000; Das et al., 2005, 2006; Riffel et al., 2006). Studies aimed to investigate the kinematics and flux distributions of the molecular and ionized gas in the near-infrared (hereafter near-IR) bands indeed reveal that the H2 emitting gas usually has a distinct kinematics and distribution from that of the ionized gas. The H2 kinematics seems to be “colder” and, together with the flux distribution, suggest that the molecular gas is more restricted to the galactic plane, while the ionized gas seems to extend to higher galactic latitudes and has a “hotter” kinematics (Storchi-Bergmann et al., 1999; Rodríguez-Ardila et al., 2004; Rodríguez-Ardila, Riffel & Pastoriza, 2005a; Riffel et al., 2006, 2008). These studies suggest that the feeding of AGN is dominated by inflow of cold molecular gas, while the ionized gas constributes mostly to its feedback via the outflows.
This work is aimed at investigating the relation between circumnuclear star formation and nuclear activity, as well as to look for the mechanisms of feeding and feedback in the nearby Seyfert galaxy NGC 7582, which has a Hubble type SBab and has a distance of 21.6 Mpc (for from de Vaucouleurs et al. (1991), with 10 corresponding to 105 pc at the galaxy, adopting ). This galaxy is an ideal candidate for this study because it has both circumnuclear star formation (Regan & Mulchaey, 1999; Storchi-Bergmann et al., 2001; Sosa-Brito et al., 2001; Wold & Galliano, 2006a) and a nuclear outflow observed by Morris et al. (1985) using the TAURUS Fabry-Perot spectrometer. The outflows, observed in the [O iii] emission line are oriented approximately perpendicular to the galactic plane, with velocities of up to , and are co-spatial with an ionization cone observed in an [O iii] narrow band image (Storchi-Bergmann & Bonatto, 1991).
Besides mapping the [O iii] outflow, Morris et al. (1985) also reported the presence of a kpc-scale rotating disc in the plane of the galaxy, observed in H. Wold & Galliano (2006a) have studied the star formation in the circumnuclear disc using [Ne ii]12.8m narrow band images, and report the presence of embedded star clusters claiming that there are no counterparts detected at optical or near-IR wavelengths. They calculate the mass of the SMBH as 5.5107 M⊙ using high resolution mid infrared spectroscopy.
We use K-band spectroscopic observations obtained with the Integral Field Unit (IFU) of the Gemini Near-Infrared Spectrograph (GNIRS) to map the stellar and gaseous flux distributions and kinematics of the inner few hundred parsecs of NGC 7582. The K-band spectra allow the mapping of the stellar kinematics via the CO 2.3m absorption feature, the ionized gas flux distribution and kinematics via the Br emission line and the molecular gas flux distribution and kinematics via the H2 emission lines. This paper is organized as follows: in Section 2 we describe the observations and data reduction. In Section 3 we present the two-dimensional flux distributions and kinematics for both the emitting gas and stars. The results are discussed in Section 4, and in Section 5 we present our conclusions.
2 Observations and Data Reduction
The data were obtained at the Gemini South Telescope with the GNIRS IFU (Elias et al., 1998; Allington-Smith et al., 2006, 2007) in 2005 Nov 10 as part of program GS-2005B-Q-65, and comprise four individual exposures of 900 s centred at =2.24m. The 111 l/mm grating with the Short Blue Camera (015/pixel) was used, resulting in a nominal resolving power of R=5900. The GNIRS IFU has a rectangular field of view, of approximately 32 48, divided into 21 slices. At the detector, the slices are divided along their length into 015 square IFU elements. The major axis of the IFU was oriented along position angle PA=203∘, in order to partially cover the ionization cone observed in the [O iii] narrow-band image by Storchi-Bergmann & Bonatto (1991). Two sets of observations were obtained, one centred at 12 from the nucleus along PA=23∘ and another centred at 075 from the nucleus along PA=203∘, the small offset being required to fill in the gaps between the slices. The observing procedure followed the standard Object–Sky–Sky–Object dither sequence, with off-source sky positions since the target is extended. Conditions during the observations were stable and clear, with image quality in -band, in the range 045-055, as obtained for the full width at half maximuum (FWHM) of the stellar profiles. The resulting spectral resolution, measured from the FWHM or the emission lines of the arc calibrations is 2.9 Å.
The data reduction was accomplished using tasks in the gemini.gnirs iraf package as well as generic iraf tasks. The reduction procedure included trimming of the images, flat-fielding, sky subtraction, wavelength calibration and s-distortion correction. The telluric bands were removed and the frames flux calibrated by interpolating a black body function to the spectrum of the telluric standard star, observed immediatelly after the galaxy. The final IFU datacube contains 840 spectra covering the spectral range from 2.14m to 2.33m, each spectrum corresponding to an angular coverage of 015015, which translates to 1616 pc2 at the galaxy. The total observed field of view 6330 (obtained by mosaicing the two set of observations) corresponds to a region of projected dimensions 660 pc315 pc at the galaxy.
3 Results
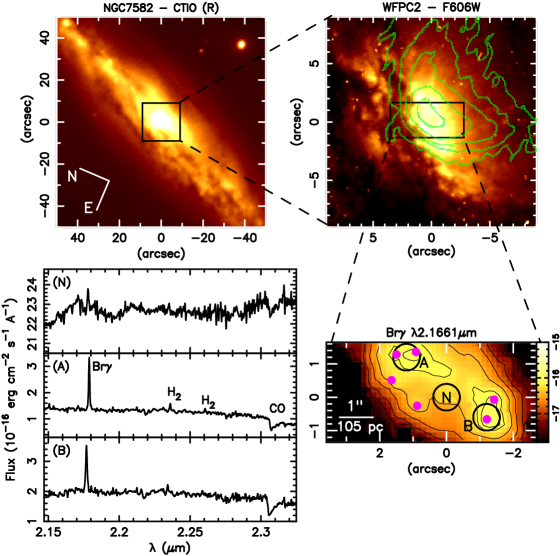
In the top-left panel of Figure 1 we present a large scale optical -band image of NGC 7582 from Hameed & Devereux (1999), obtained with the Cerro Tololo Inter-American Observatory (CTIO) 1.5 m telescope. The top-right panel presents a continuum image observed with the HST Wide Field Planetary Camera 2 (WFPC2) using the filter F606W obtained from the HST archive (program 8597 – PI: Regan, M.). We have overlaid on the HST image the contours (in green) of the narrow-band [O iii] image from Storchi-Bergmann & Bonatto (1991), which maps the ionization cone. The central rectangle shows the field-of-view of the GNIRS IFU observations, which covers only a small fraction of the ionization cone observed in [O iii]. In the bottom-right panel we present a Br flux distribution image reconstructed from the GNIRS IFU datacube, where we have marked, in magenta, the star clusters found by Wold & Galliano (2006a). These clusters delineate an elongated ring of recent star formation, with semi-major axis of , which was almost entirely covered by our observations.
In the bottom-left panel, we show three charateristic IFU spectra obtained within circular apertures of radius: the nuclear spectrum – centred on the location corresponding to the peak flux in the continuum (position N in the Br intensity map), and spectra from two locations at 17 NW (position A), and at 17 SE of the nucleus (position B), located in the star-forming ring. The spectra of the latter regions present emission lines of Brm, Hm and Hm, used to map the gaseous kinematics and flux distributions, and the stellar absorption band of 12CO (2,0) m, used to obtain the stellar kinematics. The nuclear spectrum is redder than those from the ring, with a flux in the continuum 1015 times higher than in the ring, and shows a narrow Br emission line, on the top of what seems to be a broad component of the line.
3.1 Emission-line flux distributions
Flux distributions in the emission lines were obtained directly from the datacube by integrating the flux under each emission-line profile and subtracting the continuum contribution using images obtained in windows adjacent to the emission line.
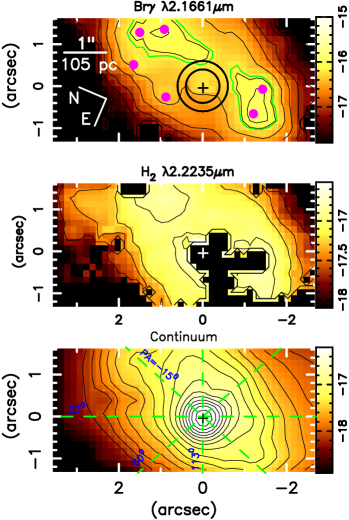
We have also adjusted Gaussian profiles to the emission lines in order to measure the gas radial velocity (from the central wavelength of the line) and velocity dispersion (from the width of the line). The fitting of each emission-line profile was obtained using the splot iraf task, and resulted also in an integrated flux for each line, from which we also obtained flux distributions. A comparison of the flux distributions obtained via the fitting of Gaussians to the flux distributions obtained directly from the datacube showed that, although both flux distributions agree with each other within the uncertainties, the ones obtained via Gaussian fitting are less noisy away from the nucleus. These flux distributions are shown in Figure 2 for the Br (top panel) and Hm (middle panel) emission lines with mean uncertainties of 6% and 11%, respectively. The Br emission is extended along the major axis of the galaxy (PA) and show flux enhancements in an arc shaped structure which approximately trace the star clusters observed by Wold & Galliano (2006a), shown again by the magenta circles. Two strong Br emission peaks in the ring are located at NW and SE of the nucleus, and are encircled by the green contours in Fig. 2 which correspond to the limits within which the flux in each pixel is higher than 50% of the peak flux in the region. We note that each of our encircled regions include two of the clusters identified by Wold & Galliano (2006a). While the Br flux distribution show intensity variations and enhacements in the position corresponding to the star clusters, mapping the ring of star-formation, the H2 flux distribution (middle panel of Fig. 2) is more uniform througouth the nuclear region, showing no enhancements at the star clusters. The black regions correspond to pixels for which the S/N ratio was too low to allow a reliable measurement of the emission line.
The bottom panel of Figure 2 shows the m continuum image obtained from interpolation between two continuum windows adjacent to the Br profile. The iso-intensity contours in the continuum image are assymetric, being more extended to the W–SW than to the E–NE, as expected, due to the strong dust absorption observed in optical images, in good agreement with the 1.6 m continuum image presented by Wold & Galliano (2006a).
3.2 Stellar kinematics
In order to obtain the stellar line-of-sight velocity distribution (LOSVD) we fitted the 12CO(2,0) stellar absorption bandhead at 2.2935 m in the -band spectra using the penalized Pixel-Fitting (pPXF) method of Cappellari & Emsellem (2004). The algorithm finds the best fit to a galaxy spectrum by convolving template stellar spectra with a given LOSVD. This procedure outputs the stellar radial velocity, velocity dispersion and higher-order Gauss-Hermite moments for each spectrum fitted. The pPXF method allows the use of several stellar templates, and also to vary the relative contribution of the different templates to obtain the best fit, thus minimizing the problem of template mismatch. For this study, we have selected as template spectra those of the Gemini spectroscopic library of late spectral type stars observed with the GNIRS IFU using the grating 111 l/mm in the K-band (Winge, Riffel & Storchi-Bergmann, 2007). In Riffel et al. (2008), we describe some properties of this library and discuss the problem of template mismatch using the CO absorption bandheads with the pPXF method.
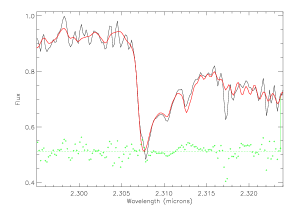
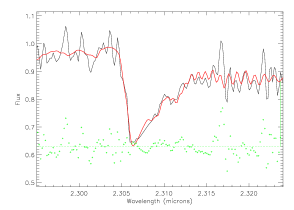
In Figure 3 we show the resulting fit for positions A (top) and B (bottom) marked in Fig. 1. For the regions where the signal-to-noise (hereafter S/N) ratio was lower than we replaced the spectrum of each single pixel by an average including the 9 nearest pixels. Even adopting this procedure, we could obtain measurements of the stellar kinematics only for the central region, as the S/N ratio of the spectra close to the borders of the IFU field becomes too low to obtain a reliable fit. For this same reason, we could not obtain stellar kinematic measurements also very close to the nucleus (radius03), as the CO bandhead feature becomes diluted by dust and line emission.
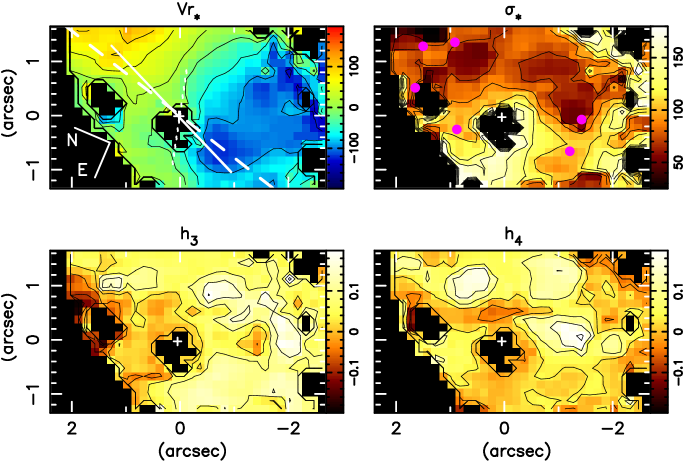
In Figure 4 we present 2D maps of the stellar kinematics. Black pixels in this figure correspond to the masked regions where we did not obtain a reliable fit. The central cross marks the position of the nucleus, defined as the locus of the peak of the band continuum and the dashed line shows the PA=165∘, which is the position angle of the major axis of the galaxy (Morris et al., 1985). The top left panel of Fig. 4 shows the stellar radial velocity field, from which we subtracted the systemic velocity of the galaxy listed in the HyperLeda111http://leda.univ-lyon1.fr database – (relative the local standard of rest), which agrees with our value for the nuclear region. The mean uncertainty in the radial velocity is . The radial velocity field shows bluehisfts to the SE and redshifts to the NW, suggesting rotation, although with the kinematical centre displaced from the peak of the continuum emission. The velocity field has an amplitude of (from to ) and seems not to be symmetric relative to the nucleus, with the highest blueshifts to the S–SW being reached closer to the nucleus than the highest redshifts to the N–NW. A one-dimensional cut along the galaxy major axis suggests that the turnover of the rotation curve to the S–SW is reached already at 100–150 pc from the nucleus, but the turnover to the N–NW seems to be beyond the border of the field (see Fig. 10).
In the top right panel of Fig. 4 we present the stellar velocity dispersion () map, with values ranging from 40 to 170 km s-1, and mean uncertainties of . The highest values are observed to the E and S of the nucleus. A partial ring of low values () is observed at from the nucleus, surrounding it from N to SW. The and Gauss-Hermite moments maps, which measure deviations of the LOSVD from a Gaussian distribution, are presented at the bottom panels of Fig. 4 and have mean uncertainties of 0.03. The values of and are between 0.18 and 0.18, which are similar to typical values obtained for a large number of galaxies in similar analyses (Emsellem et al., 2004; Ganda et al., 2006).
3.3 Gas kinematics
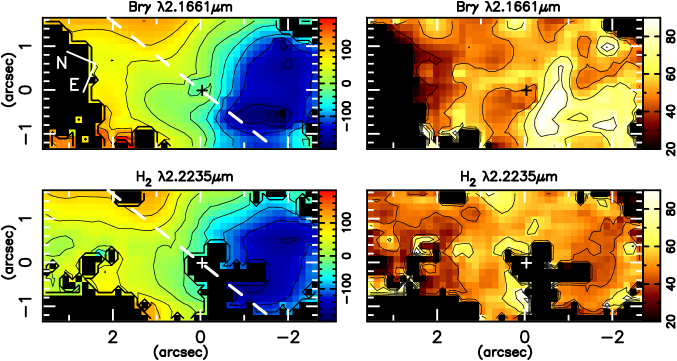
In the left panels of Figure 5 we present the radial velocity fields obtained from the peak wavelengths of the Br and H2.2235m emission lines, with mean uncertainties of 6 km s-1 and 9 km s-1, respectively. The systemic velocity of the galaxy has been subtracted from all the emission-line velocity maps. The velocity field of the Br emitting gas is very similar to that of the H2 emitting gas, being also similar to the stellar velocity field, with the S–SE side approaching and the N–NW side receeding. The largest blueshifts are observed S of the nucleus reaching values of , while the largest redshifts reach smaller values of and are observed NW of the nucleus.
The gas velocity dispersion () maps are shown in the right panels of Fig. 5. Mean uncertainties are 7 km s-1 for Br and 10 km s-1 for H2. The values were corrected for the instrumental broadening (), and range from to for Br and from to for H2. The Br velocity dispersion show regions of low values () to the N of the nucleus, and higher values to the S–SE. The highest values observed in the H2 line are located around the nucleus, and the lowest values in regions away from it.
3.4 Velocity Slices
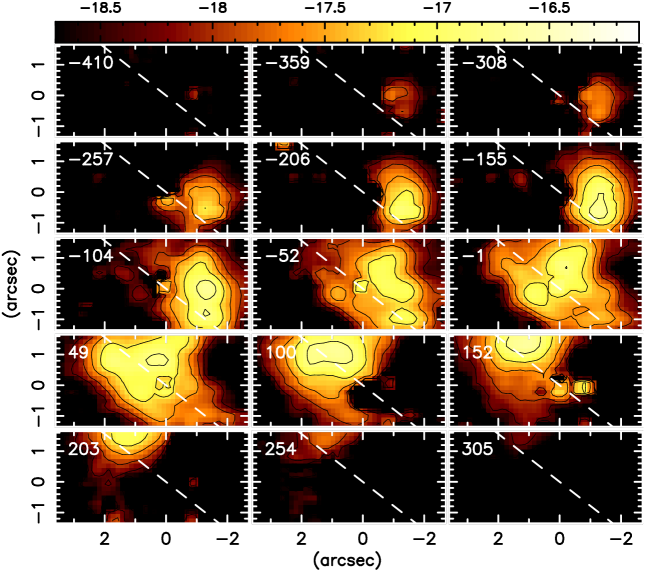
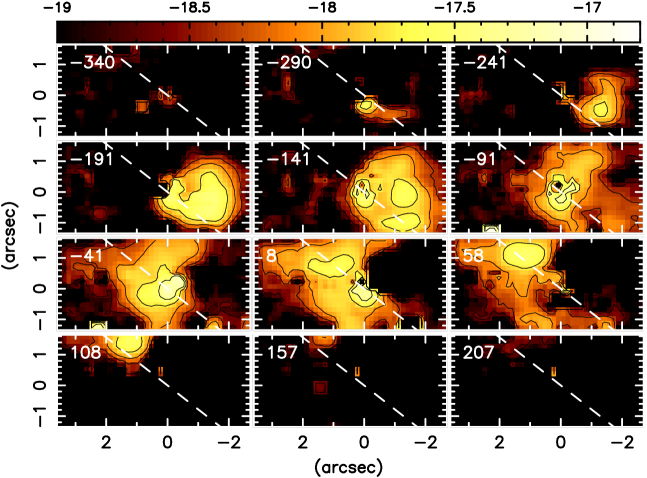
In order to better map the gaseous kinematics, and as our data has a relatively high spectral resolving power, we could “slice” the line profiles in a sequence of velocity channels. Our goal is to better sample the gas kinematics over the whole velocity distribution, including the emission-line wings (see Gerssen et al., 2006; Riffel et al., 2006, 2008). The flux distributions in the velocity slices were obtained after subtraction of the continuum contribution determined as the average of the flux from both sides of the emission lines. Each slice corresponds to a velocity bin of (two spectral pixels) and the resulting flux distributions are shown in Figs. 6 and 7. In these figures, the flux levels are presented in logarithmic units, and the slices trace the gas from negative (blueshifted, top left) to positive (redshifted, bottom right) velocities relative to the systemic velocity. For the Br emitting gas, the highest blueshifts of are observed at 1″ SW of the nucleus, while the highest redshifts of are observed at ″ NW of the nucleus. For the H2 emitting gas, the highest blueshifts reach and the highest redshifts , observed aproximately at the same locations as for the Br emision. While the highest blueshifts are observed displaced from the major axis, in the velocity range from 200 to 200 km s-1 the emission peak moves from S–SE to N–NW essentially parallel to the major axis, suggesting that, for this range of velocities, the emission is dominated by gas rotating in the plane of the galaxy.
4 Discussion
4.1 The nuclear spectrum

The flux distribution in the continuum shows an unresolved source at the nucleus (whose location we assume to coincide with the peak of the flux distribution). In order to isolate the spectrum of the nuclear source, we have extracted its spectrum within an aperture of radius 0, which corresponds to the radial distance where the point source profile decreases to 1/3 of its peak value. In order to subtract the underlying stellar contribution to the nuclear flux we have extracted a spectrum within a ring with inner and outer radii of 04 and 06, respectively, surrounding the nuclear aperture. We show the apertures corresponding to the nuclear and extranuclear spectra as circles in the top panel of Fig. 2. This choice of apertures was dictated by the need to isolate the nuclear spectrum from that of the circumnuclear ring of star formation. Larger apertures for the nuclear and extranuclear spectra would include contribution from the star-forming ring.
The resulting nuclear and extranuclear spectra are shown in Fig. 8 (top and bottom spectra). In the same Figure, we also show the difference between them (middle spectrum) after scaling the circumnuclear spectrum to the flux it would have if obtained through the same aperture as that of the nuclear spectrum. We note that the circumnuclear spectrum does not differ much from those of the star-forming regions A and B, suggesting that recent star formation is occurring also inside the ring. This is supported by previous studies of the stellar population in the optical (Storchi-Bergmann et al., 2001) and near-infrared (Davies et al., 2005).
The nuclear spectrum seems to present both a narrow and a broad component in the Br emission line. The fit of a Gaussian to the broad component, as illustrated in the top spectrum of Fig. 8, gives a FWHM 3900 km s-1, with the centre of the line blueshifted by km s-1 relative to the narrow component. The presence of a broad component in Br, with FWHM 4000 km s-1 has been previously reported by Davies et al. (2005), in long-slit observations obtained with the Very Large Telescope. A broad component, observed in H, was also reported by Aretxaga et al. (1999), although this component seems to have been produced by a transient event. These authors noted the appearance and subsequent fading of the broad H component as well as other optical emission lines and proposed three possible scenarios for its origin: capture and disruption of a star by a SMBH, a reddening change in a dusty torus surrounding the nucleus, and a Type IIn supernova exploding in a compact starburst.
The nuclear spectrum is redder than the extranuclear one, and the subtraction of the stellar contribution does seem to have eliminated the stellar 2.3m CO absorption, clearly observed prior to the subtraction. The resulting spectrum shows a red continuum similar to those of other red unresolved components observed in other AGN and attributed to emission from hot dust, possibly distributed in a toroidal structure around the SMBH, with temperature close to the dust sublimation temperature (Barvainis, 1987; Marco & Alloin, 1998, 2000; Rodríguez-Ardila, Contini & Viegas, 2005b; Rodríguez-Ardila & Mazzalay, 2006). Under the assumption that the red unresolved component is indeed due to emission by dust, we have derived its temperature and mass, by fitting a blackbody function to its spectrum. The resulting fit is shown as a dashed line in the middle spectrum of Fig. 8, corresponding to a temperature K, for which the maximuum of the blackbody curve is reached at m.
We have estimated the mass of the hot dust producing the emission in the unresolved component using the formalism of Barvainis (1987), for dust composed by grains of graphite. The infrared spectral luminosity of each dust grain, in erg s-1 Hz-1, can be written as:
| (1) |
where is the grain radius, is its absorption efficiency and is its spectral distribution assumed to be a Planck function for a temperature .
The total number of graphite grains can be obtained from:
| (2) |
where is the total luminosity of the hot dust, obtained by integrating the flux under the function fitted to the nuclear–extranuclear spectrum and adopting a distance to NGC 7582 of Mpc. In order to obtain we have adopted K, as derived above, m and (for in Hz) as in Barvainis (1987). Finally, we can obtain the total mass of the emitting dust as:
| (3) |
Adopting g cm-3 for the graphite density (Granato & Danese, 1994), we obtain . In Table 1 we compare this dust mass with masses of hot dust obtained for other AGN in previous studies. The hot dust mass in NGC 7582 is similar to those obtained for Mrk 766, NGC 1068 and NGC 3783, while it is smaller than the values for Mrk 1239, NGC 7469 and Fairall 9, and higher than those derived for NGC 1566 and NGC 4593.
| Galaxy | (M⊙) | Reference |
|---|---|---|
| NGC 7582 | This work | |
| Mrk 1239 | Rodríguez-Ardila & Mazzalay (2006) | |
| Mrk 766 | Rodríguez-Ardila, Contini & Viegas (2005b) | |
| NGC 1068 | Marco & Alloin (2000) | |
| NGC 7469 | Marco & Alloin (1998) | |
| NGC 4593 | Santos-Lléo et al. (1995) | |
| NGC 3783 | Glass (1992) | |
| NGC 1566 | Baribaud et al. (1992) | |
| Fairall 9 | Clavel, Wamsteker & Glass (1989) |
For Mrk 1239 (Rodríguez-Ardila & Mazzalay, 2006) and Mrk 766 (Rodríguez-Ardila, Contini & Viegas, 2005b) the dust mass values were derived from long-slit spectroscopy, with extraction apertures of the nuclear spectrum corresponding to more than 100 pc at the galaxies, while the spatial resolution of our data allow us to constrain the location of the hot dust as being within pc from the nucleus. As pointed out above, the band excess is probably due to the emission of hot dust from a circumnuclear torus which may be located even closer to the SMBH. In the case of NGC 1097, for example, Storchi-Bergmann et al. (2005) have found a heavily obscured starburst closer than 9 pc from the nucleus, which could be located in the outskirts of the torus. In the case of NGC 1068, interferometric mid-IR observations constrained the hot dust emission to originate much closer, in a region of aproximately 1 pc diameter (Jaffe et al., 2004).
4.2 Circumnuclear star-forming regions
NGC 7582 is known to present a kpc-scale H emitting disk which harbors recent star formation plus heavy dust obscuration in the nuclear region (Morris et al., 1985; Regan & Mulchaey, 1999; Storchi-Bergmann et al., 2001; Sosa-Brito et al., 2001; Wold & Galliano, 2006a). The presence of dust to the NE is responsible for the assymetric contours of the continuum flux map in the bottom panel of Fig. 2. The recent star-formation in the dust-embedded clusters reported by Wold & Galliano (2006a) (shown as magenta circles in Fig. 2) are seen as enhancements in our Br image, delineating a ring of major axis of 35 and minor axis of 15. This gives an axial ratio of , which is similar to the axial ratio of the galaxy (222from HyperLeda database (http://leda.univ-lyon1.fr)), suggesting that the star-forming ring is circular, with a radius of 190 pc and is located in the plane of the galaxy. As pointed out by Wold & Galliano (2006a), these star-forming clusters had not been previously seen neither in the optical nor in the near-infrared. The near-IR IFU data from Sosa-Brito et al. (2001), although consistent with our results, does not have the necessary spatial resolution to resolve these clusters.
In our data alone, clear peaks in the Br flux distribution are located in the ring at NW and SE of the nucleus, and are encircled by the green contours in Fig. 2, which comprise the pixels with fluxes higher than 50% of the peak flux. We will refer to each of these two regions – whose physical boundaries we define as corresponding to the green contours – as circumnuclear star-forming regions (CNSFRs), and will use our data for these regions to characterize the star-formation in the circumnuclear ring. From the locations of the star clusters found by Wold & Galliano (2006a) it can be seen that each of these CNSFRS correspond to two star clusters, thus we should bear in mind that the parameters we obtain for these regions correspond to two star clusters instead of one.
Following Riffel et al. (2008), we can estimate the mass of ionized hydrogen in each CNSFR as:
| (4) |
where is the line flux, is the distance of the galaxy and we have assumed an electron temperature K and electron density for the CNSFRs.
We can also obtain the emission rate of ionizing photons for each CNSFR using (Osterbrock, 1989):
| (5) |
where is the hydrogen recombination coefficient to all energy levels above the ground level, is the effective recombination coefficient for , is the Planck’s constant and is the frequency of the line. Using , and for case B recombination assuming an electronic temperature (Osterbrock, 1989), we obtain:
| (6) |
Finally, we can also obtain the star formation rate (SFR) using (Kennicutt, 1998):
| (7) |
under the same asumptions adoped to derive equation 6.
As there is considerable obscuration in the nuclear region of NGC 7582, the emission-line fluxes used in the above equations have been corrected for reddening. We have used , obtained by Schmitt, Storchi-Bergmann & Cid Fernandes (1999) in a spectrum extracted withing an aperture of 22 arcsec2, adopting the extinction law of Cardelli, Clayton & Mathis (1989).
Besides calculating the above quantities for the two CNSFRs, we have also calculated them for the nucleus and for the complete ring of star formation, as follows. In order to obtain the emission rate of ionizing photons for the nucleus, we integrated the Br emission-line flux within a circular aperture of 04 plus that emitted by the outflowing gas, under the assumption that the outflowing gas is ionized by the active nucleus. The flux in the outflowing gas was estimated as the sum of the fluxes in the velocity slices with km s-1. In this manner, we obtain only a lower limit for the rate of ionizing photons emitted by the nucleus, as our field of view covers only a very small portion of the outflow, as discussed in Sec. 3. An upper limit can be obtained under the assumption that the total flux in the outflow is the one observed times the ratio between the total area covered by the outflow (estimated from the [O iii] image) and that covered by our observations, which is 5. Considering that there should be a counterpart outflow to the opposite side of the galaxy plane, probably hidden by the dust in the plane, the Br flux in the outflow may be 10 times the one measured from our data. The Br flux of the star-forming ring was obtained by integrating its value over the whole IFU field and subtracting the contribution of the nuclear flux plus that of the outflowing gas.
Table 2 presents the results of the above calculations, together with the area used in the integrations and the Br emission-line luminosities corrected for reddening, For the nucleus we list both the lower limit (including only the contribution of the observed outflow) and the upper limit (including the contribution of the total estimated outflow). We also list the equivalent widths of the Br emission line.
| Parameter | NW | SE | Nucleus | Ring |
|---|---|---|---|---|
| Area (arcsec2) | 1.48 | 1.15 | 0.5 | 18.4 |
| log [erg s-1] | 38.530.03 | 38.450.03 | 37.810.04 | 39.090.03 |
| log | 52.400.03 | 52.320.03 | 51.680.04 | 52.960.03 |
| 0.280.02 | 0.230.02 | – | 1.010.07 | |
| EW(Br) [Å] | 14.71.4 | 13.61.3 | 0.80.1 | 7.10.6 |
| ( M⊙) | 8.20.6 | 6.80.5 | 1.50.2 | 29.42.0 |
| a Nucleus plus upper limit for the outflowing gas component. | ||||
| b Nucleus plus lower limit for the outflowing gas component. | ||||
Table 2 shows that the Br flux in inner 400 pc of NGC 7582 is dominated by emission from the circumnuclear star-forming ring, which ranges from 4 to 13 times that of the nucleus plus outflow. The Br fluxes of the two CNSFRs contribute with 50 % of the total emission from the star formation ring.
The emission rates of ionizing photons obtained for the two CNSFRs are in good agreement with values obtained for CNSFRs in other galaxies (e.g. Galliano & Alloin, 2008; Hägele et al., 2007), as well as with rates derived for NGC 7582 in the Mid-IR (Wold & Galliano, 2006a). Such rates correspond to about 1000 O6 stars in each CNSFR (Osterbrock, 1989). Considering that each CNSFR actually corresponds to two clusters, then this would correspond to 500 O stars per cluster.
The star-formation rates for the CNSFRs of , caracterize a moderate star-forming regime, and are in good agreement with the values derived by Shi, Gu & Peng (2006) for a sample of 385 CNSFRs in galaxies covering a range of Hubble types.
4.2.1 Age of the CNSFRs
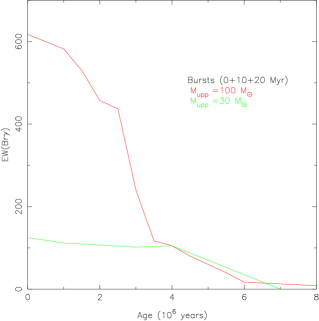
We can use our data also to estimate the age of the CNSFRs, applying the method described by Dors et al. (2008), which consists of comparing the observed values of EW(Br) to those predicted by evolutionary photoionization models. As stressed by those authors, the real age of the CNSFRs can only be obtained if the contributions both from the underlying bulge and from older stars in the CNSFRs are taken into account.
In order to obtain the contribution of the underlying bulge, we used aperture photometry in the continuum image (Fig. 2) to measure both the flux of the CNSFRs continua and that of the bulge in the surrounding regions. We find a bulge contribution of 50 % of the total flux at both CNSFRs, and thus the value of EW(Br) increases from 15 Å to 30 Å after this correction.
The presence in the CNSFRs of stars formed in previous bursts of star formation is supported by the work of Schmitt, Storchi-Bergmann & Cid Fernandes (1999), who found a large spread of age in the circumnuclear star-forming regions. In order to take this effect into account, we apply the same approach as Dors et al. (2008), representing the CNSFR stellar content by three bursts of star formation, with ages of 0.1, 10, and 20 Myr, and considering two values for the upper limit in stellar mass (= 100 and 30 ). The resulting evolutionary behaviour of EW(Br) is illustrated in Figure 9. For a value of EW(Br)30Å, we obtain an age of 5.0 Myr, which is similar to the values found for the CNSFRs in NGC 6951 and NGC 1097 by Dors et al. (2008).
4.3 Stellar Kinematics
As observed in Fig. 4 the stellar velocity field seems to be dominated by rotation. We have thus tried to fit the stellar velocities by a model of circular orbits in a plane subject to a Plummer potential, which sucessfully reproduced the stellar kinematics of the central regions of other Seyfert galaxies in previous studies (e.g. Barbosa et al., 2006; Riffel et al., 2008). Nevertheless, in the case of NGC 7582 this model fails, as the residuals are too large everywhere. The kinematic centre of the rotation in Fig.4 seems to be displaced from the nucleus by 5 NW (50 pc at the galaxy), an effect which can also be observed in one-dimensional cuts of the velocity field shown in Fig. 10. This is an interesting result which should be further investigated. Could this be the kinematic centre of the galaxy? If this is the case, then the peak flux of the infrared continuum would not correspond to the centre of the galaxy but instead to the location of the SMBH (the unresolved red source), and the ring of star formation would be centred on the SMBH instead of the galaxy centre. We believe this is unlikely, as the radius of influence of the SMBH is much smaller than the radius of the ring, and thus one would expect that the ring would be centred on the galaxy nucleus. Our field of view is too small for us to reach a firm conclusion, but one possibility is that the apparent displacement of the centre of the rotation field can be due to distortions in a circular velocity field. Observations in the mid-IR (Acosta-Pulido et al., 2003) show that NGC 7582 presents both a nuclear bar and two nuclear spiral arms, which could be related to the observed distortions. The nuclear bar is oriented along PA extending from E to W from the nucleus, while the nuclear spiral arms are oriented approximately along the major axis of the galaxy and extending to NW and SE of the nucleus. We show the orientation and extents of the nuclear bar and spiral as dotted and solid white lines, respectively in Fig. 4. We note that the SE arm seems to correspond to the location where there seems to be an “excess blueshift” in the stellar radial velocity field in Fig. 4.
The stellar velocity dispersion shows the highest values of 170 km s-1 to E and S of the nucleus (Fig. 4) which we interpret as representing the of the galaxy bulge. We use this value to estimate the mass of the SMBH () of NGC 7582 from the relation , where , and km s-1 (Tremaine et al., 2002). For , we obtain , in good agreement with the value obtained by Wold et al. (2006b) through modelling of the kinematics of [Ne ii]12.8m emitting gas.
The map (Fig.4) shows a region with low values () delineating a partial ring around the nucleus and which seems to be embedded in the bulge. These locations are close to those of the star clusters observed by Wold & Galliano (2006a), but somewhat displaced, being 50 pc closer to the nucleus. The lower values reveal that these stars have a “colder kinematics” than that of the stars of the bulge. We note that these values are similar to those of the H2 gas, suggesting that these stars have recently formed in the circumnuclear ring from kinematically cold gas, and which have not yet “thermalized” with the “hotter” stars in the bulge. But in order to present CO absorption, the stars should be at least 107 yr old (Oliva et al., 1995), what suggests that they belong to a previous burst of star-formation and not the one which is presently ionizing the gas. This interpretation is supported by the displacement of this ring relative to that in the ionized gas, which suggests that the star-formation is propagating outwards from the nucleus. Ring-like regions with low values have been observed also around other AGN (Barbosa et al., 2006; Riffel et al., 2008).
4.4 Gas Kinematics
The radial velocity maps of both the Br and H2 emitting gas (Fig. 5) are similar to the stellar one (Fig. 4). In order to better observe the possible differences, we have extracted one-dimensional cuts from the radial velocities maps which are shown in Figure 10. These cuts were obtained by averaging the velocities within pseudo-slits of width passing through the nucleus. The orientations of the slits were selected to provide a good coverage of the velocity fields, and are shown as dashed green lines in the bottom panel of Fig. 2. The top-left panel of Fig. 10 shows the velocities along PA=, which is the orientation of the major axis of the galaxy (Morris et al., 1985), while in the top-right panel we present the velocities along PA, in the bottom-left panel along PA and in the bottom-right panel along PA=.
The highest differences between the gaseous and stellar velocities are observed at 052 SW from the nucleus along PA, where the gaseous velocities reach values of up to , while the stellar velocities reach at most . For the PAs and 240 the gaseous velocities are still more blueshifted than the stellar but only by about 40 km s-1 (to SE–SW of the nucleus). Along PA=, to NW–W of the nucleus, the velocities observed for the stars are similar to those of the Br emitting gas, while the H2 emitting gas is blueshifted by 20 km s-1. We note that this orientation coincides with that of the nuclear bar, and suggest that, as this blueshift is observed against the far side of the galactic plane, we could be observing an inflow of molecular gas towards the nucleus along the bar (which could be in the galaxy plane). We have already observed similar H2 inflows towards the nucleus of another active galaxy, NGC 4051, not along a nuclear bar, but along a nuclear spiral arm (Riffel et al., 2008).

From Fig. 10 it can be concluded that the emitting gas is blueshifted relative to the stars to SW of the nucleus. This region is co-spatial with part of the [O iii] ionization cone observed by Storchi-Bergmann & Bonatto (1991), shown by the green contours in Fig. 1. We interpret this excess blueshift as due to the contribution of gas outflowing from the nucleus to the total gas emission. We note that we are observing only a small fraction of the outflowing gas because the field-of-view of our observations is much smaller than the dimensions of the ionization cone, along which the gas is outflowing (Morris et al., 1985).
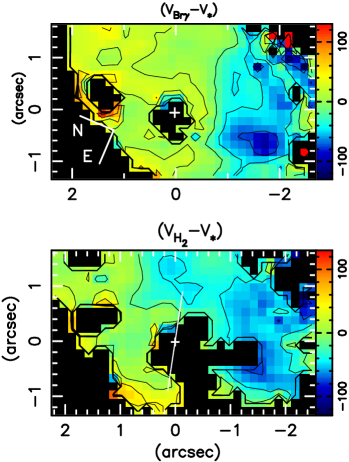
Figs. 4, 5 and 10 suggest that the radial velocity field of the gas is similar to that of the stars except for the region along the ionization cone/nuclear outflow and possibly along the nuclear bar where there may be an H2 inflow. In order to isolate the outflowing and inflowing components, we have subtracted the stellar velocity field from the Br and H2 velocity fields. These residual maps are shown in Figure 11. In the residual Br velocity map the velocity values to NE–N–NW of the nucleus are close to zero, while to the S–SW–W the gas is blueshifted by up to km s-1 relative to the stars. This velocity is of the order of those found by Morris et al. (1985) for the [O iii] emitting gas. In the residual H2 velocity map, the blueshift at PA 293(-67) can be observed in approximate alignment with the nuclear bar, whose orientation is shown as the white solid line in the bottom panel of Fig. 11.
Even higher blueshifts – of up to – are observed to the S–SW in the velocity channel maps (Fig. 6). The difference between the radial velocity maps and the velocity channel maps is due to the fact that the first give the peak velocity of the emission line for a given spatial position, while the latter show how the gas with a certain velocity is distributed along the NLR. The peak wavelength will usually correspond to the kinematics of the component(s) with the highest flux(es), while the channel maps will reveal also weaker components which contribute to the wings of the emission-line profiles. We thus attribute the high blueshifts seen in the velocity channel maps to low mass, high velocity outflows, originated close to the nucleus which compress and push the gas further out to the observed radial velocities of 100 km s-1. These high velocity outflows do not appear in the radial velocity maps due to their low flux, appearing only as a blue wing to the profile, thus not affecting the peak wavelenght used to derive the radial velocity. We have observed similar results in a recent study of the NLR of other nearby Seyfert galaxies using IFUs (Barbosa et al., 2009).
Outflows from the nucleus of active galaxies have been observed at optical wavelengths using long-slit spectroscopy (e.g. Storchi-Bergmann et al., 1992; Crenshaw & Kraemer, 2000; Das et al., 2005, 2006) and from radio observations (e.g. Morganti et al., 2007) and more recently by our group using IFUs (Riffel et al., 2006; Barbosa et al., 2009).
4.4.1 Mass outflow rates
We have used the velocity channel maps of Fig. 6 in order to estimate the mass outflow rate in ionized gas. Inspecting these maps, it can be concluded that radial velocities of up to 200 km s-1 are observed to both sides fo the nucleus, suggesting that up to these velocities, we are mapping gas motions in the galaxy disk. Above 200 km s-1, there are mostly blueshifts and almost no redshifts, what can be interpreted as due to the presence of ouflows. Our interpretation for this results is that these outflows are seen in blueshift to the S–SW because they are partially oriented towards us and are projected against the far side of the galaxy disk while the counterpart redshifted outflows are not seen because they are hidden behind the near side of the dusty disk. Thus, assuming that the emitting gas with blueshifts higher than 200 km s-1 is outflowing from the nucleus, we can estimate the mass outflow rate. In order to do this, we calculate the mass flux through a circular cross section with radius at from the nucleus, estimated from the shape of the light distribution in the velocity channels corresponding to and in Fig. 6. The mass outflow rate has been calculated as , where is the proton mass, is the electron density, is the velocity of the outflowing gas and is the filling factor (Storchi-Bergmann et al., 2007; Riffel et al., 2008) and the factor of 2 is to take into account the likely presence of a hidden counterpart outflow to the one we observe. Adopting and and adding the contribution of the two velocity bins above, we obtain .
This outflow rate is somewhat smaller than those quoted in the literature for active galaxies, which are between 0.1 and 10 (e.g. Veilleux, Cecil & Bland-Hawthorn, 2005). However, the latter values are generally obtained for objects with higher levels of activity than NGC 7582. For similar levels of activity and in comparable scales of hundreds of parsecs, Barbosa et al. (2009) have obtained similar ionized gas outflow rates of from 2D mapping of the gas kinematics in the central region of 6 nearby Seyfert galaxies, in good agreement with the value obtained here.
We now calculate the mass accretion rate necessary to produce the observed nuclear luminosity of NGC 7582. The latter can be estimated from , where is the bolometric luminosity, is the efficiency of conversion of the rest mass energy of the accreted material into radiation and is the speed of light. We adopt , a typical value for geometrically thin and optically thick accretion discs (e.g. Frank, King & Raine, 2002) and use the relation (Elvis et al., 1994), where is the hard X-ray luminosity (Piconcelli et al., 2007). The result is .
Comparing the mass outflow rate with the accretion rate calculated above, it can be concluded that the former is an order of magnitude larger than the latter, a relation similar to those reported by Veilleux, Cecil & Bland-Hawthorn (2005) for more luminous active galaxies, as well as to those obtained by Barbosa et al. (2009) for other nearby Seyfert galaxies and to that obtained by Crenshaw & Kraemer (2007) for the Seyfert galaxy NGC4151.
4.4.2 Feeding vs. feedback
Although the are similarities between the velocity fields observed for H2 and Br, there are also differences in the detailed kinematics for the two gas phases, as follows. (1) The small but systematic excess blueshift in the H2 emitting gas along PA, suggests there could be an inflow of molecular gas along a nuclear bar, as discussed above. (2) The Br map (Fig. 5) shows the highest values to the S–SE of the nucleus, approximately at the same location where the highest blueshifts are observed (see Fig. 11). This result supports an origin for at least part of the Br emission of this region in disturbed gas which is not confined to the galaxy plane but is outflowing from the nucleus along the ionization cone seen in [O iii]. The H map, on the other hand, presents overall lower values consistent with a dominant origin in molecular gas orbiting in the plane of the galaxy. (3) The velocity channel maps shown in Figs. 6 and 7 also support a larger contribution from outflowing gas to the Br than to the H2 emission, since the blueshifted emission in Br reaches larger velocity values and is found farther away from the line of nodes than in the H2 emitting gas.
Previous studies have also found that the H2 traces less disturbed kinematics than the ionized gas in the circumnuclear region of Seyfert galaxies (Storchi-Bergmann et al., 1999; Rodríguez-Ardila et al., 2004; Rodríguez-Ardila, Riffel & Pastoriza, 2005a; Riffel et al., 2006, 2008), leading to the suggestion that the molecular gas, orbiting in the plane, traces the feeding of the active nucleus via inflow of cold gas, while the ionized gas traces its feedback via the outflows. In Riffel et al. (2008) we could trace streaming motions in the H2 emitting gas towards the nucleus along a nuclear spiral arm. In the present observations, there is also some evidence of inflow along a nuclear bar. The compactness and high inclination of the circumnuclear ring of star-formation does not favor the detection of possible additional streaming motions between the ring and the nucleus. The H2 flux distribution shows that the molecular gas is not concentrated in the star-forming ring, but is distributed over the whole nuclear region, indicating the presence of similar density of molecular gas at the ring and between the nucleus and the ring. This molecular gas could be the material which is feeding and probably will continue to feed the active nucleus for some time in the future.
4.4.3 AGN-Starburst connection in NGC 7582
The total mass of hot H2 in the nuclear region of NGC 7582 can be estimated as (Riffel et al., 2008):
| (8) |
where we assume a vibrational temperature of K, which implies a population fraction (Scoville et al., 1982), and a transition probability s-1 (Turner, Kirby-Docken & Dalgarno, 1977). Integrating the flux of the Hm emission line over the wole IFU field we obtain and thus .
The above value is the mass of hot H2 emitting gas, which is probably only the “hot skin” of the molecular gas available in the nuclear region to feed the active nucleus. The total mass of molecular gas should be much higher, as it should be dominated by cold gas, which has been estimated to be 105 to 107 times that of the hot gas in galaxies for which both hot and cold molecular gas have been observed (Dale et al., 2005). Thus, there should be plenty of molecular gas, not only to feed the AGN but also to give origin to the recent bursts of star-formation in the ring.
The molecular gas accumulated in the nuclear region was probably the fuel which gave origin to the nuclear ring of star formation, as well as to the present episode of nuclear activity. Although both the star formation and nuclear activity could have been triggered simultaneously, there is also the possibility that the star formation was triggered first, and then the mass loss from stellar winds and supernova explosions in the CNSFRs have been the source of fuel for the SMBH. It is thus instructive to estimate the available mass to feed the SMBH under the above assumption. For solar metallicity and an age of 5 Myr, the total mass loss for the two CNSFRs is in the range 10 M⊙ (Leitherer & Heckman, 1995). Assuming a value of 104 M⊙, and that the duration of this process is a few 106 yr, one gets a rate of mass loss of M⊙ yr-1. (Note that this value is 5 times larger than the nuclear accretion rate calculated above, of , within the uncertainties of the calculations.) If this mass reaches the nucleus along a nuclear bar (as observed in NGC 7582) or nuclear spiral arms [as observed in NGC 1097 (Fathi et al., 2006) and NGC 6951 (Storchi-Bergmann et al., 2007)], with velocities of 2060 km s-1, this gas would take a few yr to reach the nucleus. This timescale alows for the coexistence of the nuclear activity and star-forming regions of 5 Myr under the hypothesis that the nuclear activity has been triggered by mass accretion originated from mass loss of young stars formed in the circumnuclear ring. Alternatively, the triggering may have happened during a previous burst of star-formation in the ring. The presence of such previous starburst is supported by the partial ring of low observed in the stellar kinematics. In addition, as pointed out in Sec. 4.1, the extranuclear spectrum does not differ significantly from those of the star-forming ring, suggesting that there may be regions of recent star formation even closer to the nucleus, which may be contributing to the SMBH feeding as well.
Finally, we quantify the AGN-Starburst connection in NGC 7582 by comparing the mass accretion rate to the SMBH with the star formation rate (SFR) in the circumnuclear region. As pointed out in the introduction, the M relation implies that the mass of the SMBH in galaxies grows in proportion to the growth of the bulge. If the bulge grows via star formation episodes, the mass accretion rate to the SMBH should be proportional to the SFR. Which should be the ratio between the mass accretion rate and the SFR? The same as the between the mass of the SMBH and the mass of the host galaxy bulge, which was first obtained by Magorrian et al. (1998), and today known as the Magorrian relation (Ferrarese & Merrit, 2001), which has been revised to a ratio of 0.1% between the mass of the SMBH and that of the bulge. Assuming that the total SFR can be represented by that of the ring, we get for NGC 7582 a ratio of 0.26% between the mass accretion rate and the SFR, a number which is close to that of the Magorrian relation, considering the uncertainties. These uncertainties include, in particular, a possible underestimate of the SFR in the nuclear region, as our observation misses the top border of the star-forming ring, and a possible contribution of a starburst included within the nuclear aperture.
5 Summary and conclusions
Two-dimensional near-IR band spectroscopy from the inner 660315 pc2 of the Seyfert galaxy NGC 7582, obtained with the Gemini GNIRS IFU at a spatial resolution of pc2 and spectral resolution of 3 Å, was used to map the molecular and ionized gas emission-line flux distributions and kinematics as well as the stellar kinematics. The region covered by the observations include most of a circumnuclear ring of star-formation in the plane of the galaxy plus a small part of an outflow extending to high galactic latitutes.
Our main conclusions are:
-
•
The nucleus contains an unresolved source whose continuum is well reproduced by a blackbody function with temperature T1050 K, which we atribute to emission by circumnuclear dust heated by the AGN, with an estimated mass of M⊙ located within 25 pc of the nucleus. The nuclear spectrum shows also a broad component in the Br emission line with FWHM3900 km s-1.
-
•
The Br flux distribution is dominated by emission from a circumnuclear ring of star formation, previously seen only in mid-IR observations, with radius of 190 pc, which contributes with 80–90% of the Br emission, the rest being contributed by the nuclear source. Two large star-forming regions with age 5 Myr contribute with 50% of the Br emission of the ring, resulting in 1000 O6 stars per region and a star-forming rate of 0.25 M⊙ yr-1. The total rate of ionizing photons emitted by the ring is s-1, the total star-forming rate is 1 M⊙ yr-1 and the total mass of ionized gas is M⊙.
-
•
The H2 flux distribution is more uniformly distributed over the nuclear region than the Br flux distribution and gives a mass of hot molecular gas of 620 M⊙. From previous studies, it can be concluded that the total mass of H2 gas (which is dominated by cold H2) can be 105–107 times larger.
-
•
The stellar velocity field shows a distorted rotation pattern whose centre appears to be displaced up to 50 pc from the nucleus (identified as the peak of the continuum emission). The distortion could be associated to a nuclear bar and a nuclear spiral previously seen in mid-infrared images. The velocity dispersion of the bulge is , implying in a mass of for the SMBH, in good agreement with previous determinations. Immersed in this bulge, there is a partial ring of lower (), which is close to the star-forming ring but displaced 50 pc inwards. As the velocity dispersion is similar to that of the molecular gas, this ring can be interpreted as due to stars recently formed from cold gas, although in a previous burst (age 107 yr), still keeping the gas kinematics as they did not have time yet to “thermalize” with the stars of the bulge.
-
•
The radial velocity field of the ionized gas is similar to that of the stellar component to the N–NW, while to the S–SW there is an additional blueshifted component ( km s-1), which we attribute to outflows along the ionization cone (previously observed in a narrow-band [O iii] image) which is partially covered by our observations. Velocity channel maps along the Br emission-line profile show even higher blueshifts, reaching km s-1 in the outflow, while the maximum redshift observed is km s-1. The velocity dispersion is enhanced in the region of the outflow.
-
•
The mass outflow rate in the ionized gas is estimated to be , which is an order of magnitude larger than the accretion rate to feed the AGN, a ratio which is similar to those found in other AGN. This large ratio indicates that the outflowing gas does not originate in the AGN, but is instead the circumnuclear gas from the host galaxy being pushed away by a nuclear outflow.
-
•
The kinematics of the hot molecular gas, traced by the H2 emission, shows smaller blueshifts along the outflow as well as lower velocity dispersions, which suggests that most of the molecular gas is in the galactic plane. An excess blueshift along PA, where a nuclear bar has been observed, can be interpreted as an inflow towards the nucleus. We thus conclude that the H2 kinematics traces the feeding of the AGN, while the ionized gas kinematics traces its feedback via the outflows.
-
•
The estimated mass loss rate from the evolving stars in the circumnuclear ring is M⊙ yr-1, which is 5 times the nuclear accretion rate. As the estimated time for this mass to reach the nucleus is a few 106 yr, this material could be the fuel which just triggered the nuclear activity. Nevertheless, as there is also a previous burst of star formation almost co-spatial with the ring, the fuel may have been available previously (e.g. yr). In addition, previous data suggest that there may be also recent star formation inside the ring, closer to the nucleus.
-
•
We conclude that the AGN–Starburst connection in NGC 7582 may have occurred in two ways: (1) there is a large molecular gas reservoir in the nuclear region which gave origin to both the star-formation in the circumnuclear ring and nuclear activity; (2) the molecular gas has given origin first to circumnuclear star formation and the mass loss from the evolving stars have then triggered the nuclear activity.
-
•
The ratio between the mass accretion rate and the SFR in the circumnuclear region, of 0.26% is close to the value implied by the Magorrian relation between the mass of the SMBH and the mass of the bulges of the host galaxies. This result shows that a growth of the SMBH proportional to the growth of the bulge can proceed via circumnuclear star formation around AGN.
Acknowledgments
We thank the anonymous referee for valuable suggestions which helped to improve the paper, as well as Dr. Michele Cappellari for help with the pPXF routine. Based on observations obtained at the Gemini Observatory, which is operated by the Association of Universities for Research in Astronomy, Inc., under a cooperative agreement with the NSF on behalf of the Gemini partnership: the National Science Foundation (United States), the Science and Technology Facilities Council (United Kingdom), the National Research Council (Canada), CONICYT (Chile), the Australian Research Council (Australia), Ministério da Ciência e Tecnologia (Brazil) and SECYT (Argentina). This work has been partially supported by the Brazilian institution CNPq.
References
- Acosta-Pulido et al. (2003) Acosta-Pulido, J. A., Pérez García, A. M., Prieto, M. A., Rodríguez-Espinosa, J. M., Cairós, L. M., 2003, RMxAC, 16, 198.
- Allington-Smith et al. (2006) Allington-Smith, J. R., Content, R., Dubbeldam, C. M., Robertson, D. J., Preuss, W., 2006, MNRAS, 371, 380
- Allington-Smith et al. (2007) Allington-Smith, J., Dubbeldam, C. M., Content, R., Robertson, D., Turner, J., Rodgers, B., Elias, J., Gerssen, J., Swinbank, M. 2007, MNRAS, 376, 785
- Aretxaga et al. (1999) Aretxaga, I., Joguet, B., Kunth, D., Melnick, J., & Terlevich, R. J. 1999, ApJ, 519, L123.
- Barbosa et al. (2006) Barbosa, F. K. B., Storchi-Bergmann, T., Cid Fernandes, R., Winge, C., Schmitt, H. 2006, MNRAS, 371, 170.
- Barbosa et al. (2009) Barbosa, F. K. B., Storchi-Bergmann, T., Cid Fernandes, R., Winge, C., Schmitt, H., 2009, submitted to MNRAS.
- Baribaud et al. (1992) Baribaud, T., Alloin, D., Glass, I., & Pelat, D., 1992, A&A, 256, 375.
- Barvainis (1987) Barvainis, R., 1987, ApJ, 320, 537.
- Cappellari & Emsellem (2004) Cappellari, M., Emsellem, E. 2004, PASP, 116, 138.
- Cardelli, Clayton & Mathis (1989) Cardelli, J. A., Clayton, G. C. & Mathis, J. S., 1989, ApJ, 345, 245.
- Cid Fernandes & Terlevich (1995) Cid Fernandes, R., & Terlevich, R. 1995, MNRAS, 272, 423.
- Cid Fernandes et al. (2001) Cid Fernandes, R., Heckman, T., Schmitt, H., González Delgado, R. M., Storchi-Bergmann, T. 2001, MNRAS, 558, 81.
- Cid Fernandes et al. (2005) Cid Fernandes, R., González Delgado, R. M., Storchi-Bergmann, T., Martins, L. Pires, & Schmitt, H. 2005, MNRAS, 356, 270.
- Clavel, Wamsteker & Glass (1989) Clavel, J., Wamsteker, W., Glass, I. S., 1989, ApJ, 337, 236.
- Crenshaw & Kraemer (2000) Crenshaw, D. M, Kraemer, S. B. 2000, ApJ, 532, L101.
- Crenshaw & Kraemer (2007) Crenshaw, D. M, Kraemer, S. B. 2007, ApJ, 659, 250.
- Dale et al. (2005) Dale, D. A., Sheth, K., Helou, G., Regan, M. W., & Hüttemeister, S., 2005, ApJ, 129, 2197.
- Das et al. (2005) Das, V., Crenshaw, D. M., Hutchings, J. B., Deo, R. P., Kraemer, S. B., Gull, T. R., Kaiser, M. E., Nelson, C. H., Weistrop, D. 2005, AJ, 130, 945.
- Das et al. (2006) Das, V., Crenshaw, D. M., Kraemer, S. B., Deo, R. P. 2006, AJ, 132, 620.
- Davies et al. (2005) Davies, R. I., Sternberg, A., Lehnert, M. D., & Tacconi-Garman, L. E. 2006, ApJ, 633, 105.
- Davies et al. (2007) Davies, R. I., Mueller Sánchez, F., Genzel, R., Tacconi, L. J., Hicks, E. K. S., Friedrich, S., & Sternberg, A. 2007, ApJ, 671, 1388.
- de Vaucouleurs et al. (1991) de Vaucouleurs G., de Vaucouleurs A., Corwin H. G., Jr, Buta R. J., Paturel G., Fouque P., 1991, Sky Telesc., 82, 621
- Dors et al. (2008) Dors, O. L., Jr., Storchi-Bergmann, T., Riffel, R. A., Schimdt, A. A., 2008, A&A, 482, 59.
- Elias et al. (1998) Elias J. H. et al. 1998, SPIE, 3354, 555.
- Emsellem et al. (2004) Emsellem, E. et al., 2004, MNRAS, 352, 721.
- Elvis et al. (1994) Elvis, M, et al., 1994, ApJS, 95, 1
- Fathi et al. (2006) Fathi, K., Storchi-Bergmann, T., Riffel, R. A., Winge, C., Axon, D. J., Robinson, A., Capetti, A., Marconi, A., 2006, ApJ, 641, L25.
- Ferrarese & Merrit (2000) Ferrarese, L. & Merrit, D. 2000, ApJ, 539, L9
- Ferrarese & Merrit (2001) Ferrarese, L. & Merrit, D. 2001, MNRAS, 320, L30
- Frank, King & Raine (2002) Frank, J., King, A. R., & Raine, D. J. 2002, Accretion Power in Astrophysics (3rd ed.; Cambridge: Cambridge Univ. Press).
- Galliano & Alloin (2008) Galliano, E., & Alloin, D. 2008, A&A, 487, 519.
- Ganda et al. (2006) Ganda, K., Falcón-Barroso, J., Peletier, R. F., Cappellari, M., Emsellem, E., McDermid, R. M., de Zeeuw, P. T., Carollo, C. M., 2006, MNRAS, 367, 46.
- Gebhardt et al. (2000) Gebhardt, K. et al. 2000, ApJ, 543, L5.
- Gerssen et al. (2006) Gerssen,J., Allington-Smith, J., Miller, B. W., Turner, J. e. H., Walker, A. 2006, MNRAS, 365, 29.
- Glass (1992) Glass, I., 1992, MNRAS, 256, 23P.
- González Delgado et al. (1998) González Delgado, R. M., Heckman, T., Leitherer, C., Meurer, G., Krolik, J., Wilson, A. S., Kinney, A., & Koratkar, A. 1998, ApJ, 505, 174.
- Granato & Danese (1994) Granato, G. L., & Danese, L. 1994, MNRAS, 268, 235.
- Hägele et al. (2007) Hägele, G. F., Díaz, A. I., Cardaci, M. V., Terlevich, E., & Terlevich, R. 2007, MNRAS, 378, 163.
- Hameed & Devereux (1999) Hameed, S., Devereux, N. 1999, AJ, 118, 730.
- Heckman et al. (1997) Heckman, T. M., González-Delgado, R., Leitherer, C., Meurer, G. R., Krolik, J., Wilson, A. S., Koratkar, A., & Kinney, A. 1997, ApJ, 482, 114.
- Jaffe et al. (2004) Jaffe, W. et al. 2004, Nature, 429, 47J.
- Kauffmann et al. (2003) Kauffmann, G. et al. 2003, MNRAS, 346, 1055.
- Kennicutt (1998) Kennicutt, R. C. 1998, ARA&A, 36, 189.
- Leitherer & Heckman (1995) Leitherer, C., & Heckman, T. M. 1995, ApJS, 96, 9.
- Magorrian et al. (1998) Magorrian, J. et al. 1998, AJ, 115, 2285.
- Marco & Alloin (1998) Marco, O., & Alloin, D., 1998, A&A, 336, 823.
- Marco & Alloin (2000) Marco, O., & Alloin, D., 2000, A&A, 353, 465.
- Morris et al. (1985) Morris, S., Ward, M., Whittle, M., Wilson, A. S., Taylor, K. 1985, MNRAS, 216, 193.
- Morganti et al. (2007) Morganti, R., Holt, J., Saripalli, L., Oosterloo, T. A., Tadhunter, C. N. 2007, A&A, 476, 735.
- Norman & Scoville (1988) Norman, C., & Scoville, N. 1988, ApJ, 332, 124.
- Oliva et al. (1995) Oliva, E., Origlia, L., Kotilainen, J. K. and Moorwood, A. F. M. 1995, A&A, 301, 55
- Osterbrock (1989) Osterbrock, D. E., 1989, Astrophysics of Gaseous Nebulae and Active Galactic Nuclei, University Science Books, Mill Valley, California.
- Piconcelli et al. (2007) Piconcelli, E., Bianchi, S., Guainazzi, M., Fiore, F., Chiaberge, M., 2007, A&A, 466, 855.
- Regan & Mulchaey (1999) Regan, M. W., Mulchaey, J. S., 1999, AJ, 117, 2676.
- Perry & Dyson (1985) Perry, J. J., & Dyson, J. E. 1985 MNRAS, 213, 665.
- Riffel et al. (2006) Riffel, R. A., Sorchi-Bergmann, T., Winge, C., Barbosa, F. K. B., 2006, MNRAS, 373, 2.
- Riffel et al. (2007) Riffel, R., Pastoriza, G., Rodrígues-Ardila, A., & Maraston, C. 2007, ApJ, 659, L103.
- Riffel et al. (2008) Riffel, R. A., Storchi-Bergmann, T., Winge, C., McGregor, P. J., Beck, T., Schmitt, H. 2008, MNRAS, 385, 1129.
- Rodríguez-Ardila et al. (2004) Rodríguez-Ardila, A., Pastoriza, M. G., Viegas, S., Sigut, T. A. A., & Pradhan, A. K., 2004, A&A, 425, 457.
- Rodríguez-Ardila, Riffel & Pastoriza (2005a) Rodríguez-Ardila, A., Riffel, R., & Pastoriza, M. G. 2005a, MNRAS, 364, 1041.
- Rodríguez-Ardila, Contini & Viegas (2005b) Rodríguez-Ardila, A., Contini, M., Viegas, S. 2005b, MNRAS, 357, 220.
- Rodríguez-Ardila & Mazzalay (2006) Rodríguez-Ardila, A., & Mazzalay, X. 2006, MNRAS, 367, L57.
- Santos-Lléo et al. (1995) Santos-Lléo, M., Clavel, J.; Barr, P., Glass, I. S., Pelat, D., Peterson, B. M., & Reichert, G., 1995, MNRAS, 274, 1.
- Schmitt, Storchi-Bergmann & Cid Fernandes (1999) Schmitt, H. R., Storchi-Bergmann, T., Cid Fernandes, R. 1999, MNRAS, 303, 173.
- Schmitt & Kinney (2000) Schmitt, H. R., & Kinney, A. L., ApJS, 128, 479.
- Scoville et al. (1982) Scoville, N. Z., Hall, D. N. B., Kleinmann, S. G., Ridgway, S. T. 1982, 253, 136.
- Simões Lopes et al. (2007) Simões Lopes, R. D., Storchi-Bergmann, T., de Fátima Saraiva, M., & Martini, P., ApJ, 655, 718.
- Shi, Gu & Peng (2006) Shi, L., Gu, Q. S., & Peng, Z. X. 2006, A&A, 450, 15.
- Sosa-Brito et al. (2001) Sosa-Brito, R. M, Tacconi-Garman, L. E., Lehnerth, M. D., Galimore, J. F. 2001, ApJS, 136, 61.
- Storchi-Bergmann & Bonatto (1991) Storchi-Bergmann, T., Bonatto, C. J. 1991, MNRAS, 250, 138.
- Storchi-Bergmann et al. (1992) Storchi-Bergmann T., Wiklson, A. S. & Baldwin, J. A., 1992, ApJ, 396, 45
- Storchi-Bergmann et al. (1999) Storchi-Bergmann, T., Winge, C., Ward, m. J. & Wilson, A. S. 1999, MNRAS, 304, 35.
- Storchi-Bergmann et al. (2001) Storchi-Bergmann, T., González Delgado, R. M., Schmitt, H. R., Cid Fernandes, R., & Heckman, T. 2001, ApJ, 559, 147.
- Storchi-Bergmann et al. (2005) Storchi-Bergmann, T., Nemmen, R. S., Spinelli, P. F., Eracleous, M., Wilson, A. S., Filippenko, A. V., & Livio, M., 2005, ApJ, 624, 13.
- Storchi-Bergmann et al. (2007) Storchi-Bergmann, T., Dors, O. L., Riffel, R. A., Fathi, K., Axon, D. J., Robinson, A., Marconi, A., Östlin, G., 2007, ApJ, 670, 959.
- Terlevich & Melnick (1985) Terlevich, R., & Melnick, J. 1985, MNRAS, 213, 841.
- Tremaine et al. (2002) Tremaine, S. et al., 2002, ApJ, 574, 740.
- Turner, Kirby-Docken & Dalgarno (1977) Turner, J., Kirby-Docken, K., Dalgarno, A. 1977, ApJS, 35,281.
- Veilleux, Cecil & Bland-Hawthorn (2005) Veilleux, S., Cecil, G., Bland-Hawthorn, J., 2005, ARAA, 43, 769.
- Winge, Riffel & Storchi-Bergmann (2007) Winge, C., Riffel, R. A., Storchi-Bergmann, T., 2007, http://www.gemini.edu/sciops/instruments/nir/spectemp/index.html
- Wold & Galliano (2006a) Wold, M., Galliano, E., 2006, MNRAS, 369, 47.
- Wold et al. (2006b) Wold, M., Lacy, M., Käufl, H. U., Siebenmorgen, R., 2006, A&A, 460, 449.