The timescales of chemical enrichment in the Galaxy
Abstract
The time-scales of chemical enrichment are fundamental to understand the evolution of abundances and abundance ratios in galaxies. In particular, the time-scales for the enrichment by SNe II and SNe Ia are crucial in interpreting the evolution of abundance ratios such as [/Fe]. In fact, the -elements are produced mainly by SNe II on time-scales of the order of 3 to 30 Myr, whereas the Fe is mainly produced by SNe Ia on a larger range of time-scales, going from 30 Myr to a Hubble time. This produces differences in the [/Fe] ratios at high and low redshift and it is known as ”time-delay” model. In this talk we review the most common progenitor models for SNe Ia and the derived rates together with the effect of the star formation history on the [/Fe] versus [Fe/H] diagram in the Galaxy. From these diagrams we can derive the timescale for the formation of the inner halo (roughly 2 Gyr), the timescale for the formation of the local disk (roughly 7-8 Gyr) as well the time-scales for the formation of the whole disk. These are functions of the galactocentric distance and vary from 2-3 Gyr in the inner disk up to a Hubble time in the outer disk (inside-out formation). Finally, the timescale for the formation of the bulge is found to be no longer than 0.3 Gyr, similar to the timescale for the formation of larger spheroids such as elliptical galaxies. We show the time-delay model applied to galaxies of different morphological type, identified by different star formation histories, and how it constrains differing galaxy formation models.
keywords:
Galaxy: abundances, Galaxy: bulge, Galaxy: disk, Galaxy: evolution, Galaxy: formation, galaxies: elliptical and lenticular, cD, galaxies: evolution, galaxies: formation1 How to model galactic chemical evolution: role of SNIa vs. SNII
Before going into the detailed chemical evolution history of the Milky Way, it is necessary to understand how to model, in general, galactic chemical evolution. The basic ingredients to build a model of galactic chemical evolution can be summarized as: i) Initial conditions; ii) Stellar birthrate function (the rate at which stars are formed from the gas and their mass spectrum); iii) Stellar yields (how elements are produced in stars and restored into the interstellar medium); iv) Gas flows (infall, outflow, radial flow). We refer the reader to Matteucci (2008) for a thorough review of their relative roles. Here we just briefly focus on some properties of both Type II and Ia SNe and recall the mass range of their progenitors:
1.0.1 Massive stars ()
In the mass range 10-40 , available calculations are from Woosley & Weaver (1995), Thielemann et al. (1996), Meynet & Maeder (2002), Nomoto et al. (2006), among others. These stars end their life as Type II SNe and explode by core-collapse; they produce mainly -elements (O, Ne, Mg, Si, S, Ca), some Fe-peak elements, s-process elements () and r-process elements. Lifetimes are below 30 Myr.
1.0.2 Type Ia SN progenitors
There is a general consensus about the fact that SNeIa originate from C-deflagration in C-O white dwarfs (WD) in binary systems, but several evolutionary paths can lead to such an event. The C-deflagration produces of Fe plus traces of other elements from C to Si, as observed in the spectra of Type Ia SNe. Two main evolutionary scenarios for the progenitors of Type Ia SNe have been proposed:
Single Degenerate (SD) scenario: the classical scenario of Whelan and Iben (1973), recently revised by Han & Podsiadlowsky (2004), namely C-deflagration in a C-O WD reaching the Chandrasekhar mass after accreting material from a red giant companion. One of the limitations of this scenario is that the accretion rate should be defined in a quite narrow range of values.
The clock to the explosion is given by the lifetime of the secondary star in the binary system, where the WD is the primary (the originally more massive one). Therefore, the largest mass for a secondary is , which is the maximum mass for the formation of a C-O WD. As a consequence, the minimum timescale for the occurrence of Type Ia SNe is Myr (i.e. the lifetime of a ) after the beginning of star formation. Recent observations in radio-galaxies by Mannucci et al. (2005, 2006) seem to confirm the existence of such prompt Type Ia SNe. The minimum mass for the secondary is , which is the star with lifetime equal to the age of the Universe. Stars with masses below this limit are obviously not considered.
Double Degenerate (DD) scenario: the merging of two C-O white dwarfs, due to loss of angular momentum caused by gravitational wave radiation, which explode by C-deflagration when is reached (Iben and Tutukov 1984). In this scenario, the two C-O WDs should be of in order to give rise to a Chandrasekhar mass after they merge, therefore their progenitors should be in the range (5-8). The clock to the explosion here is given by the lifetime of the secondary star plus the gravitational time delay which depends on the original separation of the two WDs. The minimum timescale for the appearance of the first Type Ia SNe in this scenario is one million years more than in the SD scenario (e.g. Greggio 2005 and references therein). At the same time, the maximum gravitational time delay can be as long as more than a Hubble time.
A way of defining the typical Type Ia SN timescale is to assume it as the time when the maximum in the Type Ia SN rate is reached (Matteucci & Recchi, 2001). This timescale varies according to the chosen progenitor model and to the assumed star formation history, which varies from galaxy to galaxy. For the solar vicinity, this timescale is at least 1 Gyr, if the SD scenario is assumed, whereas for elliptical galaxies, where the stars formed much more quickly, this timescale is only 0.5 Gyr (Matteucci & Greggio, 1986; Matteucci & Recchi 2001).
2 Chemical evolution time-scales and the formation of the Milky Way
The kinematical and chemical properties of the different Galactic stellar populations can be interpreted in terms of the Galaxy formation mechanism. Here we focus on the results of the two-infall model of Chiappini, Matteucci & Gratton (1997) to which we refer the reader for details. Such a scenario predicts two main episodes of gas accretion: during the first one, the halo the bulge and most of the thick disk formed, while the second gave rise to the thin disk. We first witness the sequence of the formation of the stellar halo, in particular the inner halo, following a monolithic-like collapse of gas (first infall episode) but with a longer timescale than originally suggested by Eggen et al. (1962): here the time scale is 0.8-1.0 Gyr. During the halo formation also the bulge is formed on a very short timescale in the range 0.1-0.5 Gyr (see below). During this phase also the thick disk assembles or at least part of it, since part of the thick disk, like the outer halo, could have been accreted. Then the thin disk formation, namely the assembly of the innermost disk regions just around the bulge, begins; this is due to the second infall episode. The thin-disk assembles inside-out, in the sense that the outermost regions take a much longer time to form. It is clear that the early phases of the halo and bulge formation are dominated by Type II SNe (and also by Type Ib/c SNe) producing mostly -elements such as O and Mg and part of Fe. On the other hand, Type Ia SNe start to be non negligible only after 1Gyr and they pollute the gas during the thick and thin disk phases.
More in detail, the main assumptions of the two-infall model are: the IMF is that of Scalo (1986) normalized over a mass range of 0.1-100. The infall law gives the rate at which the total surface mass density changes because of the infalling gas. It is normalised to reproduce the total present time surface mass density in the solar vicinity (= 51 6 , see Boissier & Prantzos 1999), 1 Gyr is the time for the maximum infall on the thin disk, 0.8 Gyr is the e-folding time for the formation of the halo thick-disk (which means a total duration of 2 Gyr for the complete halo-thick disk formation) and is the timescale for the formation of the thin disk and it is a function of the galactocentric distance (formation inside-out, Matteucci & François 1989; Chiappini et al. 2001). In particular, it is assumed that where is the galactocentric distance.
The SFR is the Kennicutt law with a dependence on the surface gas density and also on the total surface mass density (see Dopita & Ryder 1994). The exponent of the surface gas density is set equal to 1.5, similar to what suggested by Kennicutt (1998a). These choices for the parameters allow the model to fit very well the observational constraints, in particular in the solar vicinity. We recall that below a critical threshold for the surface gas density ( for the thin disk and for the halo phase) we assume that the star formation is halted. The existence of a threshold for the star formation has been suggested by Kennicutt (1998a,b).
2.1 The chemical enrichment history of the solar vicinity
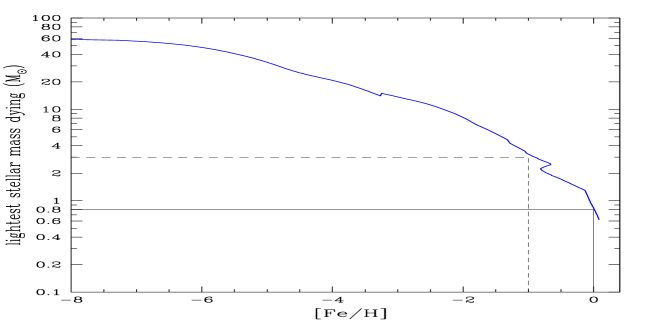
In Fig. 1 we show the smallest mass dying at any cosmic time corresponding to a given predicted abundance of [Fe/H] in the ISM. This is because there is an age-metallicity relation and the [Fe/H] abundance increases with time. Thus, it is clear that in the early phases of the halo only massive stars are dying and contributing to the chemical enrichment process. Clearly this graph depends upon the assumed stellar lifetimes and upon the age-[Fe/H] relation. It is worth noting that the Fe production from Type Ia SNe appears before the gas has reached [Fe/H] =-1.0, therefore during the halo and thick disk phase. This clearly depends upon the assumed Type Ia SN progenitors (in this case the single degenerate model).
2.1.1 The time-delay model
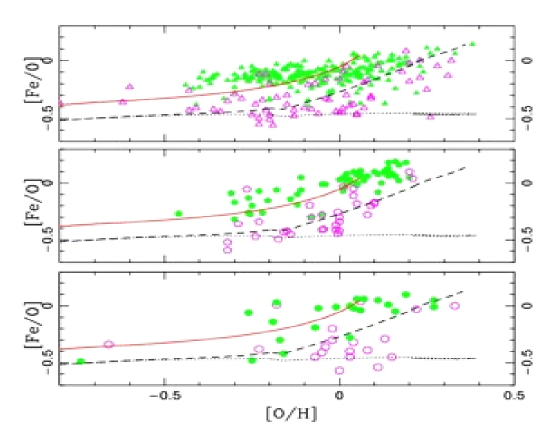
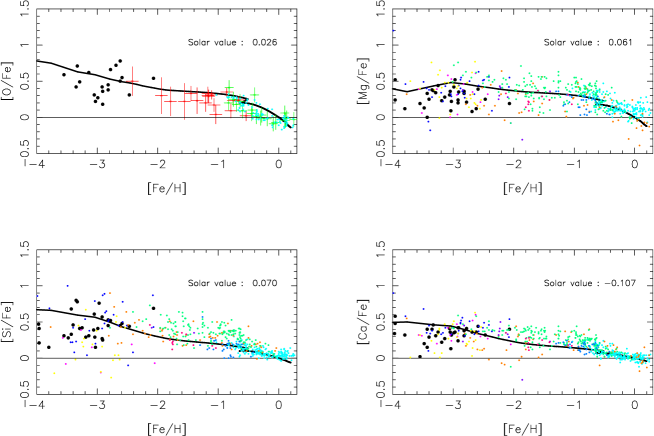
The time-delay refers to the delay with which Fe is ejected into the ISM by SNe Ia relative to the fast production of -elements by core-collapse SNe. Tinsley (1979) first suggested that this time delay would have produced a typical signature in the [/Fe] vs. [Fe/H] diagram. Matteucci & Greggio (1986) included for the first time the Type Ia SN rate formulated by Greggio & Renzini (1983) in a detailed numerical model for the chemical evolution of the Milky Way. The effect of the delayed Fe production is to create an overabundance of O relative to Fe ([O/Fe] 0) at low [Fe/H] values, and a continuous decline of the [O/Fe] ratio until the solar value ([O/Fe]) is reached for [Fe/H] dex. This is what is observed and indicates that during the halo phase the [O/Fe] ratio is due only to the production of O and Fe by SNe II. However, since the bulk of Fe is produced by Type Ia SNe, when these latter start to be important then the [O/Fe] ratio begins to decline. This effect was predicted by Matteucci & Greggio (1986) to occur also for other -elements (e.g. Mg, Si). At the present time, a great amount of stellar abundances is available and the trend of the -elements has been since long confirmed. In Fig. 2 shows one among our most recent models applied to the latest compilation of data (Frano̧is et al. 2004). A good fit of the [O/Fe] ratio as a function of [Fe/H] is obtained only if the -elements are mainly produced by Type II SNe and the Fe by Type Ia SNe. If one assumes that only SNe Ia produce Fe as well as if one assumes that only Type II SNe produce Fe, the agreement with observations is lost. Therefore, the conclusion is that both Types of SNe should produce Fe in the proportions of 1/3 for Type II SNe and 2/3 for Type Ia SNe. The model in Fig. 2 does not distinguish between the thin and the thick disk. Recently, Chiappini (2008) presented a model where the evolutions of the thin and thick disks were considered separately. The main hypothesis was that the thick disk formed and evolved faster than the thin disk (see Fig. 3), and the conclusion was that a good agreement with the observed abundances in thick disk stars can be obtained if the thick disk assembled by gas accretion on a timescale no longer than 2 Gyr. This conclusion favors the formation of the thick disk stars in situ instead than by accretion of extant stellar satellites.
2.1.2 The G-dwarf metallicity distribution and constraints on the thin disk formation
The G-dwarf metallicity distribution is quite an important constraint for the chemical evolution of the solar vicinity: it is the fossil record of the star formation history of the thin disk. Originally, there was the “G-dwarf problem” which means that the Simple Model of galactic chemical evolution could not reproduce the distribution of the G-dwarfs. It has been since long demonstrated that relaxing the closed-box assumption and allowing for the solar region to form gradually by accretion of gas can solve the problem (Tinsley, 1980). Assuming that the disk forms from pre-enriched gas can also solve the problem but still the gas infall is necessary to have a realistic picture of the disk formation. The two-infall model can reproduce very well the G-dwarf distribution and also that of K-dwarfs (see Fig. 4), as long as a timescale for the formation of the disk in the solar vicinity of 7-8 Gyr is assumed. This conclusion is shared by other authors (Alibés et al. 2001; Prantzos & Boissier 1999)

2.2 The Galactic disk
The chemical abundances measured along the disk of the Galaxy suggest that the metal content decreases from the innermost to the outermost regions, in other words there is a negative gradient in metals.
In Fig. 5 we show theoretical predictions of abundance gradients along the disk of the Milky Way compared with data from HII regions, B stars and PNe. The adopted model is from Chiappini et al. (2001) and is based on an inside-out formation of the thin disk. The model does not allow for exchange of gas between different regions of the disk. The disk is, in fact, divided in several concentric shells 2 Kpc wide with no interaction between them.
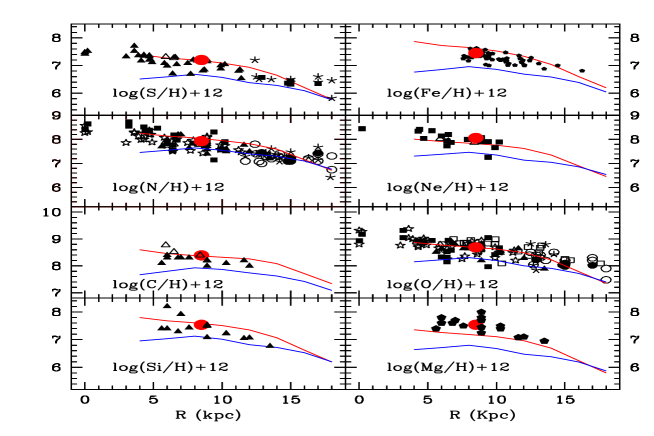
The reason for the steepening is that in the model of Chiappini et al. there is included a threshold density for SF, which induces the SF to stop when the density decreases below the threshold. This effect is particularly strong in the external regions of the Galactic disk, thus contributing to a slower evolution and therefore to a steepening of the gradients with time. Other authors (e.g. Boissier & Prantzos, 1999) found a flattening of the gradient with time in absence of a star formation threshold.
2.3 The Galactic bulge
In the context of chemical evolution, the Galactic bulge was first modeled by Matteucci & Brocato (1990) who predicted that the [/Fe] ratio for some elements (O, Si and Mg) should be super-solar over almost the whole metallicity range, in analogy with the halo stars, as a consequence of assuming a fast bulge evolution which involved rapid gas enrichment in Fe mainly by Type II SNe. Recent data concerning medium- and high-resolution spectroscopy of bulge stars (Rich & McWilliam, 2000; Fulbright et al., 2006, 2007; Zoccali et al., 2006; Lecureur et al. 2007) and more recent models (e.g. Ballero et al. 2007) have confirmed the previous predictions and suggested that the bulge must have formed on a time scale of Gyr and in any case no longer than 0.5 Gyr. This is in agreement with Elmegreen (1999) and Ferreras et al. (2003). A similar model, although updated with the inclusion of the development of a galactic wind and more recent stellar yields, has been presented by Pipino et al. (2008b): it shows how a model with intense star formation and rapid assembly of gas can best reproduce the most recent accurate data on abundance ratios (both in single stars and in the integrated spectra) as well as the metallicity distribution .
3 From the Bulge to external galaxies: Ellipticals
In Fig. 6 we present the predictions by Matteucci (2003) of the [/Fe] ratios as functions of [Fe/H] in galaxies of different morphological type. In particular, for the Galactic bulge or an elliptical galaxy of the same mass, for the solar vicinity region and for an irregular Magellanic galaxy (LMC and SMC). The underlying assumption is that different objects undergo different histories of star formation, being very fast in the spheroids (bulges and ellipticals), moderate in spiral disks and slow and perhaps gasping in irregular gas rich galaxies. The effect of different star formation histories is evident in Fig. 6 where the predicted [/Fe] ratios in the bulge and ellipticals remain high and almost constant for a large interval of [Fe/H]. This is due to the fact that, since star formation is very intense, the bulge reaches very soon a solar metallicity thanks only to the SNe II; then, when SNe Ia start exploding and ejecting Fe into the ISM, the change in the slope occurs at larger [Fe/H] than in the solar vicinity. In the extreme case of irregular galaxies the situation is opposite: here the star formation is slow and when the SNe Ia start exploding the gas is still very metal poor. This scheme is quite useful since it can be used to identify galaxies only by looking at their abundance ratios.

The above mentioned models for the bulge can be extended to study elliptical galaxies. In fact, similarly to bulges, elliptical galaxies show over-solar [/Fe] ratios. Moreover, these ratios are found to increase with galactic mass. In the framework of the time-delay model, we can explain such a behaviour as an increase of the SF efficiency as a function of galactic mass (Matteucci 1994, Pipino & Matteucci, 2004). To explain the higher star formation efficiency in the most massive galaxies in the framework of the monolithic collapse, Pipino et al. (2008c) appeal to massive black holes-triggered SF: a short ( yr) super-Eddington phase can provide the accelerated triggering of associated star formation. According to Pipino et al. (2008c) models, the galaxy is fully assembled on a time-scale of 0.3-0.5 Gyr.
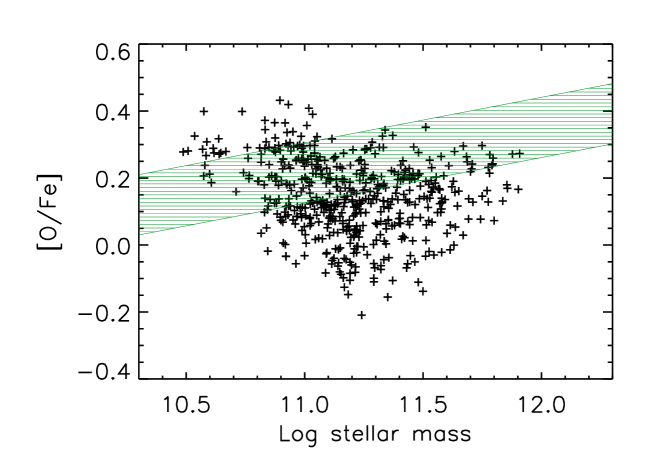
On the other hand, when the same detailed treatment for the chemical evolution is implemented in a semi-analytic model for galaxy formation based on the hierarchical clustering scenario (e.g. White & Rees, 1978), it does not produce the observed mass-[/Fe] relation (Pipino et al. 2008a). In particular, the slope is too shallow and the scatter too large (see Fig. 7), in particular in the low and intermediate mass range. The model shows significant improvement at the highest masses and velocity dispersions, where the predicted [/Fe] ratios are now marginally consistent with observed values. Moreover, an excess of low-mass ellipticals with too high a [/Fe] ratio is predicted.
A thorough exploration of the parameter space shows that the failure in reproducing the mass- and -[/Fe] relations can partly be attributed to the way in which star formation and feedback are currently modelled. The merger process is responsible for a part of the scatter. We suggest that the next generation of semi-analytical model should feature feedback (either stellar of from AGN) mechanisms linked to single galaxies and not only to the halo, especially in the low and intermediate mass range. The scatter is also intrinsic to the merger history, thus calling for further modification of the baryons behaviour with respect to the CDM. In other words we envisage a lack of a self-regulating mechanisms which acts on a galactic scale and counterbalances to some extent the random nature of the merger trees.
4 Conclusions
From the discussions of the previous sections we can extract some important conclusions on the formation and evolution of the Milky Way, derived from chemical abundances. In particular, the inner halo formed on a timescale of 1-2 Gyr at maximum, the outer halo formed on longer time-scales perhaps from accretion of satellites or gas. The disk at the solar ring formed on a timescale not shorter than 7 Gyr. The whole disk formed inside out with time-scales of the order of 2 Gyr or less in the inner regions and 10 Gyr or more in the outermost regions. The bulge is very old and formed very quickly on a timescale smaller than even the inner halo and not larger than 0.5 Gyr. The abundance gradients arise naturally from the assumption of the inside-out formation of the disk. A threshold density for the star formation helps in steepening the gradients in the outer disk regions. The IMF seems to be different in the bulge and the disk, being flatter in the bulge, although more abundance data are necessary before drawing firm conclusions. Elliptical galaxies and bulges share similar chemical properties (at a given mass), therefore a very short and intense formation is predicted for them. While this can be accommodated in the monolithic framework by means of, e.g., AGN-triggered star formation, it is still hard for models based on hierarchical clustering to account for the observed chemical properties.
References
- [] Alibés, A., Labay, J. & Canal, R., 2001, A&A, 370, 1103 B.J. Jarvis & D.M. Terndrup, ESO/CTO Workshop, p.83
- [] Ballero, S., Matteucci, F., Origlia, L. & Rich, R.M. 2007, A&A 467, 123
- [] Boissier, S., Prantzos, N., 1999, MNRAS 307, 857 121, 753 2004, AJ 128, 1676 350, 38
- [] Chiappini, C., 2008, in Formation and Evolution of Galaxy Disks ASP Conference Series, Vol. 396, Proceedings of the conference held 1-5 October, 2007 at the Centro Convegni Matteo Ricci, Rome, Italy. Edited by José G. Funes, S.J., and Enrico Maria Corsini. San Francisco: Astronomical Society of the Pacific, 2008., p.113
- [] Chiappini, C., Matteucci F. & Gratton R. 1997, ApJ 477, 765
- [] Chiappini, C., Matteucci, F., & Romano, D., 2001, ApJ 554, 1044
- [] Dopita, M.A.& Ryder, S.D., 1994, ApJ 430, 163
- [] Eggen, O.J., Lynden-Bell, D. & Sandage, A.R., 1962, ApJ, 136, 748
- [] Elmegreen, B.G., 1999, ApJ 517, 103
- [] Ferreras, I., Wyse, F.G. & Silk, J., 2003, MNRAS 345, 1381 521, 81
- [] François, P., Matteucci, F. Cayrel, R., Spite, M., Spite, F. & Chiappini, C., 2004, A&A 421, 613
- [] Fulbright, J.P., McWilliam, A. & Rich, R.M., 2006, ApJ 636, 831
- [] Fulbright, J.P., McWilliam, A. & Rich, R.M., 2007, ApJ 661, 1152
- [] Greggio, L., 2005, A&A 441, 1055
- [] Greggio, L. & Renzini, A., 1983, A&A 118, 217
- [] Han, Z. & Podsiadlowski, Ph., 2004, MNRAS 350, 1301
- [] Iben, I. Jr. & Tutukov, A., 1984, ApJ 284, 719
- [] Kennicutt, R.C. Jr., 1998a, ApJ 498, 541
- [] Kennicutt, R.C. Jr., 1998b, ARA&A 36, 189
- [] Kotoneva, E., Flynn, C., Chiappini, C., Matteucci, F. 2002, MNRAS, 336, 879
- [] Lecureur, A., Hill, V., Zoccali, M., Barbuy, B., Gomez, A., Minniti, D., Ortolani, S. & Renzini, A., 2007, A&A 465, 799 2003, A&A 401, 939
- [] Mannucci, F., Della Valle, M., Panagia, N., Cappellaro, E., Cresci, G., Maiolino, R., Petrosian, A. & Turatto, M., 2005, A&A 433, 807
- [] Mannucci, F., Della Valle, M.& Panagia, N., 2006, MNRAS 370, 773
- [] Matteucci, F., 2001, The Chemical Evolution of the Galaxy, ASSL, Kluwer Academic Publisher
- [] Matteucci, F. 2008, To appear on the Proceedings of the 37th Saas-Fee Advanced Course of the Swiss Society for Astrophysics and Astronomy, ” The Origin of the Galaxy and the Local Group”, eds. E. Grebel and B. Moore, astro-ph/0804.1492
- [] Matteucci, F., Brocato, E., 1990, ApJ 365, 539
- [] Matteucci, F. & François, P., 1989, MNRAS 239, 885
- [] Matteucci, F. & Greggio, L., 1986, A&A 154, 279
- [] Matteucci, F. & Recchi, S., 2001, ApJ 558, 351
- [] Matteucci, F., Romano, D., Molaro, P., 1999, A&A 341, 458
- [] Meynet, G. & Maeder, A., 2002, A&A 390, 561 493
- [] Nomoto, K., Tominaga, N., Umeda, H., Kobayashi, C. & Maeda, K., 2006, Nucl. Phys. A777, 424
- [] Pipino, A., Devriendt, J.E.G., Thomas, D., Silk, J., Kaviraj, S., 2008a submitted, arXiv0810.5753
- [] Pipino, A., Matteucci, F. 2004, MNRAS, 347, 968
- [] Pipino, A.,Matteucci, F, D’Ercole, A., 2008b, IAUS, 245, 19
- [] Pipino, A., Silk, J., Matteucci, F, 2008c, MNRAS in press, arXiv0810.2045
- [] Prantzos, N., 2003, A&A 404, 211
- [] Prantzos, N. & Boissier, S., 2000, MNRAS 313, 338
- [] Rich, R.M. & McWilliam, A., 2000, in Discoveries and Research Prospects from 8- to 10-Meter-Class Telescopes, Ed. Jacqueline Bergeron, Proc. SPIE Vol. 4005, p. 150
- [] Salpeter, E.E., 1955, ApJ 121, 161
- [] Scalo, J.M., 1986, Fund. Cosmic Phys. 11, 1
- [] Schmidt, M., 1959, ApJ 129, 243 2007, ApJS 170, 335
- [] Thielemann, F.K., Nomoto, K. & Hashimoto, M., 1996, ApJ 460, 408
- [] Tinsley, B.M., 1980, Fund. Cosmic Phys. Vol. 5, 287
- [] Tinsley, B.M, 1979, ApJ 229, 1046 A&A 393, 215
- [] Whelan, J. & Iben, I. Jr., 1973, ApJ 186, 1007
- [] White, S.D.M., & Rees, M.J., 1978, MNRAS 183, 341
- [] Woosley, S.E. & Weaver, T.A., 1995, ApJS 101, 181
- [] Zoccali, M., Lecureur, A., Barbuy, B., Hill, V., Renzini, A., Minniti, D., Momany, Y., Gómez, A., Ortolani, S., 2006, A&A 457, L1