High-velocity neon line emission from the ULIRG IRAS F00183–7111:
revealing the optically obscured base of a nuclear outflow
Abstract
We report the first mid-infrared detection of highly disturbed ionized gas in the ultraluminous infrared galaxy (ULIRG) IRAS F00183–7111. The gas, traced by the 12.81 m [Ne ii] and 15.56 m [Ne iii] lines, spans a velocity range of –3500 to +3000 km s-1 with respect to systemic velocity. Optical and near-infrared spectroscopic studies show no evidence for similarly high velocity gas components in forbidden lines at shorter wavelengths. We interpret this as the result of strong extinction (AV=10–50) on the high-velocity gas, which identifies the base of the outflow traced in 5007 Å [O iii] as a plausible origin. Unusual excitation conditions are implied by a comparison of the mid-infrared low-excitation neon line emission and the Polycyclic Aromatic Hydrocarbon (PAH) emission for a sample of 56 ULIRGs. For IRAS F00183–7111, the neon/PAH ratio is 8 times higher than the average ratio. Similar mid-infrared kinematic and excitation characteristics are found for only two other ULIRGs in our sample: IRAS 12127–1412NE and IRAS 13451+1232. Both sources have an elevated neon/PAH ratio and exhibit pronounced blue wings in their 15.56 m [Ne iii] line profiles. IRAS 13451+1232 even shows a strongly blue shifted and broad 14.32 m [Ne v] line. While for IRAS 13451+1232 the observed [Ne iii]/[Ne ii] and [Ne v]/[Ne ii] line ratios indicate exposure of the blue shifted gas to direct radiation from the AGN, for IRAS F00183–7111 and IRAS 12127–1412NE the neon line ratios are consistent with an origin in fast shocks in a high-density environment, and with an evolutionary scenario in which strongly blue shifted [Ne ii] and [Ne iii] emission trace the (partial) disruption of the obscuring medium around a buried AGN. The detection of strongly blue shifted [Ne v] emission in IRAS 13451+1232 would then indicate this process to be much further advanced in this ULIRG than in IRAS F00183–7111 and IRAS 12127–1412NE, where this line is undetected.
Subject headings:
galaxies: jets and outflows — infrared: ISM — galaxies: ISM — galaxies: active — galaxies: individual (IRAS F00183–7111, IRAS 12127–1412, IRAS 13451+1232)1. Introduction
Large-scale galactic outflows of gas (sometimes called ”superwinds”) are seen in galaxies both at low and high redshifts (e.g. Veilleux, Cecil & Bland-Hawthorn, 2005; Pettini et al., 2002). Superwinds are generated when the kinetic energy in the outflows from massive stars and supernovae is thermalized, generating a region of very hot (T106–107 K) low-density gas in the ISM of a starburst galaxy (Chevalier & Clegg, 1985). As the bubble breaks out of the disk of the galaxy, it will rupture, producing a weakly-collimated bipolar outflow into the galaxy halo. As the bubble expands it sweeps up and shocks ambient material, creating an outflowing wind (Castor, McRay & Weaver, 1975; Weaver et al., 1977). Superwinds may also be driven, at least in part, by radiation pressure on dust grains (Murray, Quaetert & Thompson, 2005). They may also be driven directly by the interaction of jets on the dense ISM surrounding an AGN (e.g. Holt, Tadhunter & Morganti, 2003).
There is morphological, physical and kinematic evidence for superwinds in nearby starburst and infrared luminous galaxies (e.g. Heckman, Armus & Miley, 1990). Large-scale optical emission-line and associated X-ray nebulae are ubiquitous in starbursts (Armus, Heckman & Miley, 1990; Lehnert, Heckman & Weaver, 1999; Strickland et al., 2004), and these increase in size and luminosity from dwarf starbursts all the way to ULIRGs (where they can be tens of Kpc in size — (Grimes et al., 2005). In addition, the winds are often seen via blue-shifted absorption features (e.g. Na D) against the starburst nuclei (Heckman et al., 2000; Rupke et al., 2005; Martin, 2005) indicating that the neutral, cold ISM is being swept-up in the outflow. At high redshifts, superwinds have been seen in Lyman break galaxies at z=2–3 (Pettini et al., 2001; Shapley et al., 2003).
The ultraluminous infrared galaxy (ULIRG: L(8–1000 m)=1012-13 L⊙) IRAS F00183–7111 is known from optical emission line spectroscopy to harbour such a galactic-scale outflow (Heckman, Armus & Miley, 1990). In this paper, we study the mid-infrared evidence for this outflow based on the Spitzer-IRS emission line spectroscopy. The emission line data is analyzed and presented along with new 3.6, 5.8, 70 and 160 m Spitzer photometric observations, obtained to better constrain the infrared spectral energy distribution of this interesting ULIRG.
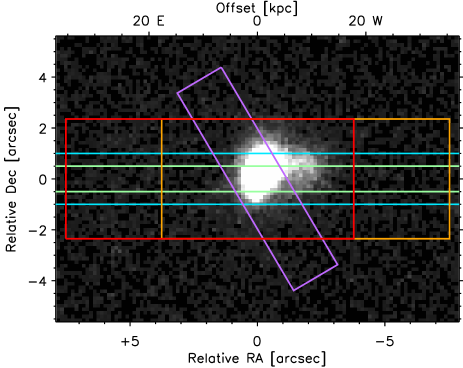
With an integrated 8–1000 m luminosity of 8.61.31012 L⊙ (this work) IRAS F00183–7111 is one of the most luminous ULIRGs discovered by IRAS. Near-infrared imaging by Rigopoulou et al. (1999) (Fig. 1) shows a disturbed morphology and what appears to be a single nucleus. Evidence for the presence of an accreting central supermassive black hole is provided by the radio luminosity, which is in the range of powerful radio galaxies and a factor ten in excess of what would be expected for starburst galaxies based on the far-infrared luminosity (q=1.14; Roy & Norris, 1997; Norris et al., 1988). The presence of an AGN was recently confirmed by Nandra & Iwasawa (2007), who detected a 6.7 keV Fe K line (Fe xxv) with a large equivalent width, indicative of reflected light from a compton thick AGN.
The most common star formation tracers, the PAH emission bands, were not detected in the 5–12 m ISO-CAM-CVF spectrum (Tran et al., 2001). Instead, the spectrum is dominated by a strong silicate absorption band centered at 9.7 m, indicative of strong absorption of a background continuum source, most likely a deeply buried AGN (Tran et al., 2001). One of the PAH emission bands, the C–H bending mode at 11.2 m, was later identified in the Spitzer-IRS low-resolution spectrum and was used to constrain the contribution of mid-infrared detectable star formation to the energy budget of IRAS F00183–7111 to be 30% (Spoon et al., 2004). The same spectrum may also offer indications for ongoing buried star formation through the detection of absorption bands of crystalline silicate features at 16, 19 and 23 m (Spoon et al., 2006). Crystalline silicates are known to be forged by young stars in their circumstellar disks and by evolved stars in their dense stellar winds (Molster & Kemper, 2005, and references therein). Their presence in the general ISM of IRAS F00183–7111 may indicate fierce ongoing star formation at mid-infrared optical depths significantly larger than one (Spoon et al., 2006).
Optical long-slit spectroscopy of IRAS F00183–7111 has revealed the presence of kinematically highly disturbed ionized gas extending from 10 kpc West to 25 kpc East of the nucleus. This gas, traced in both the 4959 and 5008Å [O iii] lines, is clearly blue shifted between 5 and 20 kpc East and shows line widths in excess of 600 km s-1 (FWHM) over a range of 25 kpc. The double peaked profile of both [O iii] lines in this range is in agreement with a superwind model in which the line emission originates from the thin outer shell of shock-heated, swept-up ambient gas. Beyond 25 kpc East, the gas is much more quiescent, with line widths of 200 km s-1 centered close to systemic velocity (Heckman, Armus & Miley, 1990).
Recently, Nandra & Iwasawa (2007) have pointed out that the presence of an outflow may also explain the clear eastward offset by about 22 kpc of the soft (0.3–1.0 keV) X-ray radiation detected from IRAS F00183–7111. It also may identify the secondary peak at 25 kpc East in the R-band image111at the redshift of the source the R-band filter includes the 5008Å [O iii] line (Drake et al., 2004) by Drake et al. (2004) to be related to this outflow (Nandra & Iwasawa, 2007). A corresponding K-band peak is absent in the 2.2 m image (rest frame 1.65 m) by Rigopoulou et al. (1999) (Fig. 1).
In this paper we report the first identification in a ULIRG of broad, asymmetric and somewhat blue shifted emission lines of [Ne ii] at 12.81 m and [Ne iii] at 15.56 m in the high-resolution Spitzer-IRS spectrum of IRAS F00183–7111. We compare our detection to available optical and near-infrared spectroscopy to investigate the processes responsible for this broadening. Our paper is organized as follows. In Section 2 we present our observations of IRAS F00183–7111. In Section 3 we present the 1–120 m SED and an analysis of the mid-infrared emission line spectrum. In Section 4 we analyze line profiles of two other ULIRGs which display strong blue shifts in their fine-structure neon line profiles. Results are discussed in Section 5 and conclusions are provided in Section 6. Additional results for IRAS F00183–7111 are presented in the Appendix. Throughout this paper we assume H0 = 71 km s-1 Mpc-1, = 0.27, = 0.73 and = 0.
| Band | Flux density | |
|---|---|---|
| (m) | (mJy) | |
| IRAC-1 | 2.7 | 2.9 0.3 |
| IRAC-3 | 4.4 | 22 2 |
| IRAS-12 | 9.0 | 60aaIRAS Faint Source Catalog v2 |
| IRAS-25 | 18.8 | 133 10aaIRAS Faint Source Catalog v2 |
| IRAS-60 | 45 | 1200 837aaIRAS Faint Source Catalog v2 |
| MIPS-70 | 53 | 1500 225 |
| IRAS-100 | 75 | 1190 119aaIRAS Faint Source Catalog v2 |
| MIPS-160 | 121 | 540 80 |
2. Observations and data reduction
2.1. IRAC and MIPS photometry
Spitzer Space Telescope (Werner et al., 2004) IRAC (Fazio et al., 2004) 3.6 and 5.8 m photometry was obtained on 2006 August 14 (AOR key 17517824). IRAS F00183–7111 was imaged at 5 dither positions using 2 sec ramp times. The source flux density was measured by integrating over a 12” radius aperture placed upon the SSC pipeline-produced (S14) post-BCD mosaic. We estimate the uncertainty in the photometry due to the background to be 2%. The absolute calibration uncertainties of the IRAC post-BCD images are 10%. As part of the same program we obtained MIPS (Rieke et al., 2004) 70 and 160 m photometry on 2006 June 17 (AOR key 17528320). IRAS F00183–7111 was imaged for 1 cycle at 70 m and for 4 cycles at 160 m using 3 sec ramps. The source flux densities were measured from the SSC pipeline-produced (S14) unfiltered post-BCD images by integrating the flux within 8 and 20” radius apertures at 70 and 160 m, respectively. Aperture corrections were applied to recover the full point-source flux densities. We estimate the uncertainty on the 70 and 160 m flux densities due to the background to be around 1 and 2%, respectively. The absolute calibration uncertainties of the MIPS post-BCD images are 10–20%. We present the results of our photometric observations in Table 1. The calculation of infrared luminosities which utilize this photometry are described in Section 3.1.

2.2. IRS spectroscopy
High resolution (500 km s-1; R600) 10–37 m IRS (Houck et al., 2004) spectra of IRAS F00183–7111 were obtained at two epochs: 2005 June 2 (AOR key 6651904) and 2008 June 1 (AOR keys 25289472 and 25289984). In both cases the source was acquired using a high-accuracy blue peak-up and observed in staring mode. The 10–19.5 m portion of the spectrum was obtained in 9 cycles of 120 sec integrations in IRS Short High (SH; slit size 4.711) at PA=91. The 19.3–37.0 m portion of the spectrum was obtained in 2 sets of 35 cycles of 60 sec integrations, alternated with sky background observations (30 cycles of 60 sec), in IRS Long High (LH; slit size 11.122.3) at PA=-15. Figure 1 shows the SH slit overplotted on the K-band image of the source (Rigopoulou et al., 1999). The LH slit is not shown as it is more than twice as wide and long as the SH slit.
Data reduction started from 2D droop level (i.e. pre-flatfield) images provided by the S17.2 pipeline of the Spitzer Science Center (SSC). For SH, in a first step we used IRSCLEAN to interpolate over the bad and ’rogue’ pixels. For LH, this step was preceeded by subtraction of the contemporaneous sky background images. We then used the SMART data reduction package (Higdon et al., 2004) to extract the 1D target spectrum in ‘full slit’ mode. The same procedure was followed for a large number of observations of the calibration star Dra. The final spectrum was obtained by multiplying the spectrum of IRAS F00183–7111 by the relative spectral response function created from the ratio of the observed spectrum of Dra to the stellar reference spectrum (Cohen et al., 2003, G.C. Sloan priv.comm.). Note that given the absence of contemporaneous SH background observations, the SH portion of the spectrum is not background-subtracted.
The wavelength calibration of our spectrum is accurate to about 1/5 (SSC, priv. comm.) of a resolution element (500 km s-1), which amounts to 100 km s-1.
| Band | Flux density | Uncertainty | |
|---|---|---|---|
| (m) | (mJy) | ||
| IRAC-1 | 3.6 | 8.6 | 1% |
| IRAC-2 | 4.5 | 29.6 | 1% |
| IRAC-3 | 5.8 | 47.3 | 1% |
| IRAC-4 | 8.0 | 48.6 | 1% |
| MIPS-24 | 24 | 370 | 1% |
| IRAS-25 | 25 | 360 | 1% |
| IRAS-60 | 60 | 1410 | 1% |
| MIPS-70 | 70 | 1190 | 2% |
| IRAS-100 | 100 | 890 | 3% |
| MIPS-160 | 160 | 490 | 5% |
| SCUBA-450 | 450 | 20 | 6% |
| SCUBA-850 | 850 | 2.0 | 6% |
3. Analysis
3.1. Infrared SED
With the addition of the IRAC 3.6 m and MIPS 70 and 160 m photometry it is possible to fit the infrared SED of IRAS F00183–7111 over the entire rest frame wavelength range of 1–120 m. Especially important is the addition of the MIPS 160 m point, which extends the sampling of the rest frame SED from 75 m (pre-Spitzer) to 120 m (see Fig.2), allowing a more reliable extrapolation of the SED into the submillimetre range. For the latter, we have used the multi-component spectral energy distribution decomposition code of Marshall et al. (2007).
Based on our fit, we have computed the following integrated rest frame infrared luminosities for IRAS F00183-7111: L(1–1000 m)=9.91.31012 L⊙, L(8–1000 m)=8.61.31012 L⊙, L(40–500 m)=4.40.81012 L⊙ and L(40–120 m)=4.00.61012 L⊙. We have further used the results of the fit to derive rest frame filter flux densities for the IRAC, MIPS, IRAS and SCUBA bands. These values are tabulated in Table 2. Given the 15% absolute calibration uncertainty of the MIPS 70 and 160 m data, and the fact that the MIPS 160 m data is the longest wavelength point constraining our fit, there is clearly some uncertainty in our extrapolation of the flux density out to 1000 m. The spectral shape of the extrapolated flux density beyond 160 m is a function of the chosen power-law spectral index of the far-IR dust opacity. The above stated uncertainties in the integrated luminosities incorporate both the systematic uncertainty resulting from our choice of this dust opacity spectral index as well as the statistical uncertainty resulting from the MIPS calibration uncertainty.
The ratio of the observed IRAS-25 to IRAS-60 filter fluxes is commonly used to classify ULIRGs as ”warm” (25/60 m 0.2) or ”cold” (25/60 m 0.2), separating ULIRGs believed to be AGN-dominated from those which are thought to be powered predominantly by star formation (de Grijp et al., 1985; Sanders et al., 1988). For the classification to be meaningful also for higher redshift targets like IRAS F00183–7111, rest frame synthetic IRAS fluxes should be used. For IRAS F00183–7111, this results in an IRAS-25 to IRAS-60 flux ratio of 0.26, which places it among the class of ”warm”, AGN-dominated ULIRGs, in agreement with results obtained at other wavelengths (see Section 1).
3.2. Emission lines
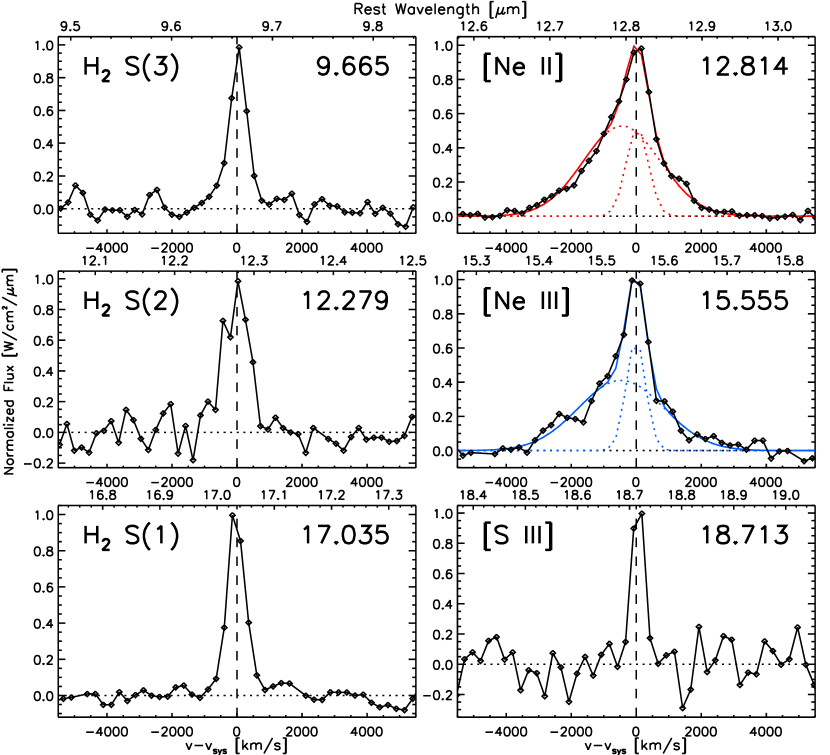
The high-resolution Spitzer-IRS spectrum of IRAS F00183–7111 covers the rest frame wavelength range of 7.5–27.8 m. In Table 3 we list the line fluxes and 3 upper limits for 17 emission lines, as well as for the 11.2 m PAH emission feature. For the latter, the feature flux was measured above a spline continuum defined shortward of 11.1 m and longward of 11.6 m. The only lines that are detected in our spectrum are the S(1), S(2) and S(3) pure rotational lines of molecular hydrogen, and the 12.81 m [Ne ii], 15.56 m [Ne iii] and 18.71 m [S iii] fine-structure lines. In Fig. 3 we present their continuum-subtracted line profiles as a function of velocity relative to systemic222 In the absence of CO or 21cm redshift determinations, we have used the mid-infrared S(1) and S(3) molecular hydrogen lines to determine the recession velocity of IRAS F00183–7111 to be 98400200 km s-1 (z=0.328 0.001). This redshift is 360 km s-1 higher than the value adopted by Heckman, Armus & Miley (1990) and 180 km s-1 higher than the value used by Roy & Norris (1997).
| Feature ID | Flux | obs. FWHM | true FWHM | |
|---|---|---|---|---|
| (m) | (10-21 W cm-2) | (km s-1) | (km s-1) | |
| Ne vi | 7.65 | 0.25 | … | … |
| H2 S(4) | 8.03 | 0.26 | … | … |
| Ar iii | 8.99 | 0.07 | … | … |
| H2 S(3) | 9.66 | 0.52 0.03 | 65040 | 41050 |
| S iv | 10.51 | 0.08 | … | … |
| PAH | 11.2 | 2.7 0.4 | … | … |
| H2 S(2) | 12.28 | 0.59 0.1 | 950130 | 810120 |
| Hu | 12.37 | 0.12 | … | … |
| Ne ii | 12.81 | 6.3 0.3 | 1500100 | 1410100 |
| Ne v | 14.32 | 0.13 | … | … |
| Cl ii | 14.37 | 0.14 | … | … |
| Ne iii | 15.56 | 2.1 0.2 | 1300120 | 1200120 |
| H2 S(1) | 17.04 | 0.83 0.05 | 66050 | 43055 |
| Fe ii | 17.94 | 0.10 | … | … |
| S iii | 18.71 | 0.23 0.03 | 49050 | 200 |
| Ne v | 24.30 | 0.20 | … | … |
| O iv | 25.89 | 0.35 | … | … |
| Fe ii | 25.99 | 0.31 | … | … |
| O iiibbBuchanan et al. (2006) | 0.5007 | 0.45 | … | 890 |
| O iiiccHeckman, Armus & Miley (1990) | 0.5007 | … | 600–1000 | |
| HbbBuchanan et al. (2006) | 0.6565 | 0.510.03 | … | 720 |
| Fe iiaaDannerbauer et al. (2005) | 1.257 | 0.228: | … | 900: |
| PaaaDannerbauer et al. (2005) | 1.282 | 0.115: | … | 600: |
| Fe iiaaDannerbauer et al. (2005) | 1.644 | 0.376: | … | 1000: |
Of the six detected emission lines, the two neon fine-structure lines appear clearly resolved beyond the instrumental resolution (500 km s-1; =600), most notably the [Neii] line, at an observed FWHM of 1500100 km s-1 (Table 3). The other emission lines have observed FWHM ranging from 49050 to 950130 km s-1. In what follows any FWHM values quoted in the text refer to the true FWHM, i.e. the observed FWHM corrected for the instrumental profile.

3.3. Neon line profile analysis
Extracting a [Ne ii] line profile requires careful removal of the underlying spectral structure. As illustrated in Fig. 4 by the starburst galaxy NGC 2146 and the ULIRG NGC 6240, the [Neii] line is superimposed on the 12.7 m PAH emission feature, which arises over a velocity range of -13500 to +3500 km s-1 relative to the [Ne ii] line. However, unlike NGC 2146 and NGC 6240, the spectrum of IRAS F00183–7111 shows hardly any PAH emission, with the exception of the PAH feature at 11.2 m, which is detected at very low equivalent width. We conclude that the remarkable width of the 12.81 m [Ne ii] line can not be ascribed to inproper subtraction of the underlying spectral structure. In fact, the resulting profile is consistent with that of the 15.56 m [Ne iii] line.
The shape of the [Ne ii] line profile is asymmetric, with the peak emission arising very close to systemic velocity. To characterize the asymmetry we have decomposed the line profile into two Gaussian components (Fig. 3). The resulting fit is good. We find the dominant component to have a FWHM of 257090 km s-1, centered at a blueshift of 40050 km s-1 w.r.t. systemic. The narrow component has a FWHM of 61060 km s-1 and a redshift of 6020 km s-1 w.r.t. systemic. The fit components are shown overplotted in red onto the observed [Ne ii] profile in the top-right panel of Fig. 3. Further fit details are provided in Table 4.
Unlike the 12.81 m [Ne ii] line, the 15.56 m [Ne iii] line resides in a relatively uncomplicated part of the spectrum. We determined its profile by defining and subtracting a local third-order polynomial continuum. We then performed a 2-component decomposition in the same way as for the [Ne ii] line. The narrow component has a FWHM of 46090 km s-1 and is centered at the systemic velocity, whereas the broad component has a FWHM of 2850240 km s-1 and is blue shifted by 450100 km s-1. The fraction of the [Ne iii] flux emitted in the broad component is 3/4, slightly lower than the fraction found for the [Ne ii] line, 4/5. As a result, the [Ne iii]/[Ne ii] ratios are 0.310.03 for the broad component and 0.390.08 for the narrow component.
3.3.1 Comparison to other line measurements for IRAS F00183–7111
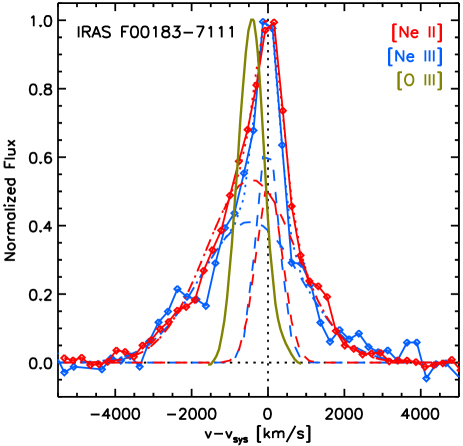
The most detailed spectral line study that we are aware of focusses on the [O iii] doublet at 4959 and 5007 Å and was published by Heckman, Armus & Miley (1990). They observed IRAS F00183–7111 in a 2100 slit along PA 90 (see Fig. 1) at a spectral resolution =1900. In Fig. 5 we compare the 5007 Å [O iii] profile obtained at a position 3 (13 kpc) East of the nucleus to that of our galaxy-integrated spectrum, after degrading the spectral resolution of the [O iii] line from 1900 to 600. According to Fig. 12 of Heckman, Armus & Miley (1990), at this position the centroid of the [O iii] line profile has its highest blueshift (700 km s-1; using our preferred redshift of 0.3280.001) at a FWHM 600 km s-1, typical for the entire region extending from 10 kpc West to 20 kpc East of the nucleus. Clearly, the [Ne ii] and [Ne iii] emission extends to much higher velocities than the [O iii] line emission does.
More recently, Buchanan et al. (2006) published line fluxes and FWHMs for 11 optical lines observed at =1000 in a 29 slit oriented along PA=329 (C.L. Buchanan, private communication). For the H line, which is strongly blended with the N ii line on either side, they infer a FWHM of 720 km s-1 (compared to 700 km s-1 reported by Armus, Heckman & Miley, 1989). For the 4959/5007 Å [O iii] doublet, they report FWHMs of 800–900 km s-1 (Table 1), which are comparable to those given by Heckman, Armus & Miley (1990) in their Figure 12, even though the slit orientations in the two studies in question differ by 239 degrees (Fig. 1).
We also compared our mid-infrared results to near-infrared H and K band spectroscopy by Dannerbauer et al. (2005) obtained using a 1290 slit oriented at PA=90 (Fig. 1). Their data have similar spectral resolution as ours. The two detected [Fe ii] lines at 1.257 and 1.644 m have FWHMs in the range 900–1000 km s-1, while the 1.282 m Pa line appears to be unresolved. Again, like in the optical range, none of the lines have FWHMs as large as the mid-infrared neon lines (see Table 3).
3.4. AGN tracing mid-infrared lines
The rest wavelength range covered by the Spitzer IRS high-resolution modules includes three high-ionization lines commonly used as tracers of AGN activity: 7.65 m [Ne vi] and 14.32 &24.32 m [Ne v] (e.g. Sturm et al., 2002). None of them are detected (Table 3). The 3 limit on the fraction of 8–1000 m infrared power contained in the 14.32 m [Ne v] line is L[Nev]/LIR 1.310-5, which is 1–2 orders of magnitude smaller than the detections for classical AGNs, but similar to the limits derived for other ULIRGs with deep 9.7 m silicate features like IRAS 08572+3915, IRAS 15250+3609 and IRAS 20100–4156, and for the type-1 ULIRG/LoBAL-quasar Mrk 231 (Armus et al., 2007). For the limit on 7.65 m [Ne vi] no ULIRG comparison data exists. However, the 3 upper limit L[Nevi]/LIR 2.610-5 is at least an order of magnitude below what is found for classical AGNs (Sturm et al., 2002).
3.5. PAH emission
The quality of our Spitzer IRS high-resolution spectrum allows us to measure the flux in the 11.2 m PAH feature more accurately than has been possible from the low-resolution spectrum (Spoon et al., 2004). The latter showed strong disagreements between the spectra obtained in nod positions 1 and 2 at the short wavelength end of IRS Long-Low order 2. The new feature flux, measured from the IRS SH spectrum is tabulated in Table 3 and is 25% smaller than previously reported by Spoon et al. (2004) based on the low-resolution spectrum. We also remeasured the upper limit on the 6.2 m PAH feature from a re-extracted low-resolution spectrum, using the same continuum pivots at 5.65, 6.07 and 6.50 m to define the local spline continuum as in Spoon et al. (2004). Given the clear reduction in noise and artefacts between IRS pipeline versions 9.1 and 14.2, the new 3 upper limit on the 6.2 m PAH flux is 1.9 10-21 W cm-2, which is a factor of 2 lower than previously reported by Spoon et al. (2004). Note that we do not attempt to measure the flux in the 7.7 m PAH band, as this emission feature — if present — would be strongly blended with the silicate feature.
Based on the new PAH fluxes we compute an upper limit on the ratio of 6.2-to-11.2 m PAH of 0.70. This is at the low end of the range found for starburst nuclei and ULIRGs in our sample (2 below the average ratio of 1.4), but not untypical for a sample of IR-faint LINERs (LIR=107.83-10.59) studied by Sturm et al. (2006), and for the spiral arms of M 51 and the halo of M 82 (Galliano et al., 2008).
The low 6.2-to-11.2 m PAH ratio may indicate a high ratio of neutral to ionized PAHs, which would imply a low ratio of the ionizing radiation field to the electron density, and physical conditions similar to those in the Galactic reflection nebula NGC 2023 (Galliano et al., 2008). In IRAS F00183–7111 these conditions could plausibly exist outside the deeply buried nucleus. Alternatively, the low observed 6.2-to-11.2 m PAH ratio for IRAS F00183–7111 may indicate destruction of small PAHs exposed to hard radiation from an AGN. This would selectively lower the fluxes emitted in the PAH emission bands at 3.3, 6.2 and 7.7 m relative to those at 11.2 m and beyond (Smith et al., 2007). Given, however, the absence of detections of high ionization lines, indicative of a hard AGN radiation field, this scenario may not hold for IRAS F00183–7111.
Note that strong extinction on the PAH emitting region can be ruled out as a third explanation for the low observed 6.2-to-11.2 m PAH ratio, as this would have the opposite effect on the PAH ratio: the attenuation on the 11.2 m PAH feature is stronger than the attenuation on the 6.2 m PAH feature (e.g. Chiar & Tielens, 2006).
4. Other ULIRGs showing resolved mid-IR neon lines
The discovery of high velocity [Ne ii] emission in IRAS F00183–7111 raises the question whether there are other luminous infrared galaxies that show evidence for disturbed (FWHM800 km s-1) neon gas in their Spitzer-IRS spectra. If so, do these galaxies have properties similar to IRAS F00183–7111? To address this question we have inspected the line profiles of the low-ionization emission lines 12.81 m [Ne ii] and 15.56 m [Ne iii] of the 53 ULIRGs in the sample of Farrah et al. (2007), as well as the archival spectra of the ULIRG IRAS 12127–1412NE and the HyLIRGs IRAS F09104+4109 and IRAS F15307+3252. In our search we distinguish two classes. One consisting of sources with symmetric resolved neon line profiles, and another with sources which show asymmetric resolved line profiles.
| Feature | Component | vc | obs. FWHM | true FWHM | Flux | |
|---|---|---|---|---|---|---|
| (m) | (km s-1) | (km s-1) | (km s-1) | (10-21 W cm-2) | ||
| IRAS 00183–7111 | ||||||
| Ne ii | n | 12.816 | + 60 20 | 790 60 | 610 60 | 1.4 0.16 |
| Ne ii | b | 12.796 | -400 50 | 2620 90 | 2570 90 | 4.9 0.20 |
| Ne iii | n | 15.555 | 0 30 | 680 90 | 460 80 | 0.55 0.09 |
| Ne iii | b | 15.532 | -450 100 | 2890 240 | 2850 240 | 1.5 0.12 |
| Ne v | - | 14.322 | – | – | – | 0.13 |
| IRAS 12127–1412NE | ||||||
| Ne ii | n | 12.818 | -80 10 | 530 20 | 175 45 | 1.68 0.08 |
| Ne ii | b | 12.799 | -530 60 | 1740 100 | 1670 100 | 1.47 0.10 |
| Ne iii | n | 15.565 | -7 40 | 430 120 | 200 | 0.16 0.07 |
| Ne iii | b | 15.531 | -650 200 | 1580 360 | 1500 340 | 0.42 0.10 |
| Ne v | - | 14.322 | – | – | – | 0.08 |
| IRAS 13451+1232 | ||||||
| Ne ii | n | 12.808 | -120 10 | 790 40 | 610 50 | 4.3 0.30 |
| Ne ii | b | 12.758 | -1290 215 | 2520 350 | 2470 340 | 2.5 0.40 |
| Ne iii | n | 15.545 | -200 25 | 840 70 | 670 70 | 1.9 0.25 |
| Ne iii | b | 15.506 | -950 85 | 2410 110 | 2360 110 | 4.1 0.30 |
| Ne v | b | 14.263 | -1240 80 | 2360 190 | 2300 190 | 1.9 0.15 |
The class of asymmetric resolved [Ne ii] and [Ne iii] line profiles consists of only two sources besides IRAS F00183–7111. In all three cases the line asymmetry takes the form of a blue wing.
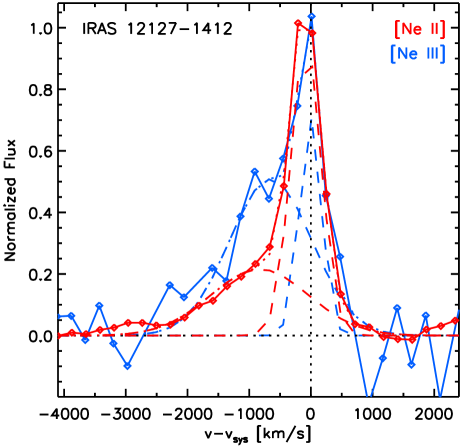
4.1. IRAS 12127–1412NE
One source is IRAS 12127–1412NE (Fig. 6), the brighter of the two nuclei in this widely separated LINER system (projected nuclear separation 9, or 21.9 kpc; Veilleux, Kim & Sanders, 1999). In the near-infrared, Imanishi, Dudley & Maloney (2006) classified the NE nucleus as a buried AGN based on the absence of 3.3 m PAH emission and the presence of 3.0 m water ice and 3.4 m hydrocarbon absorption bands. The deeply buried nature of the nuclear power source(s) is confirmed by the presence of a deep 10 m silicate feature in the Spitzer-IRS low-resolution spectrum (Imanishi et al., 2007).
On 2008 July 10, we reobserved the source in staring mode in IRS-SH, using an integration time of 12 cycles of 120 sec. Sky-subtraction was performed using a contemporaneous sky background observation of 6 cycles of 120 sec. Data reduction proceeded along the same steps as detailed in Sect. 2.1.
Like for IRAS F00183–7111, the asymmetry of the neon emission lines of IRAS 12127–1412NE may be characterized using a 2-component gaussian fit. For the [Ne ii] line the narrow component is practically unresolved (FWHM = 17545 km s-1) and is centered close to systemic velocity333We infer the systemic velocity of IRAS 12127–1412NE from the line centers of the H2 S(1) and S(3) lines and find 39870200 km s-1 (z=0.1330), in good agreement with the redshift of 0.133 quoted by Veilleux, Kim & Sanders (2002) (-8010 km s-1). The other component has a FWHM of 1670100 km s-1 and is centered at a blue shift of 53060 km s-1 (Fig. 6). The fraction of the [Ne ii] line flux emitted in the broad component is slightly smaller than that in the narrow component. This is less than for IRAS F00183–7111, for which about 4/5 of the line flux is associated with the broad component. We also examined the 15.56 m [Ne iii] profile. Its shape is not as well constrained as that of the [Ne ii] line due to a five times lower line flux, but the profile clearly shows the presence of a blue wing. A 2-component Gauss fit results in an unresolved narrow component centered at systemic velocity (-740 km s-1) and a broad component with FWHM of 1500340 km s-1 blueshifted by 650200 km s-1. We find that the contribution of the broad component to the [Ne iii] line profile is far stronger than to the [Ne ii] profile, 3/4 as compared to 1/2 (Fig. 6). This implies a difference in excitation of the narrow and broad components. For the narrow component we find a [Ne iii]/[Ne ii] ratio of 0.0950.04, while for the broad component we compute a ratio of 0.290.08 Unfortunately, a comparison to the line profile of the optical [O iii] doublet is not possible as the equivalent widths of these lines in the spectrum of Veilleux, Kim & Sanders (1999) are too low for a meaningful analysis of their profiles.
4.2. IRAS 13451+1232
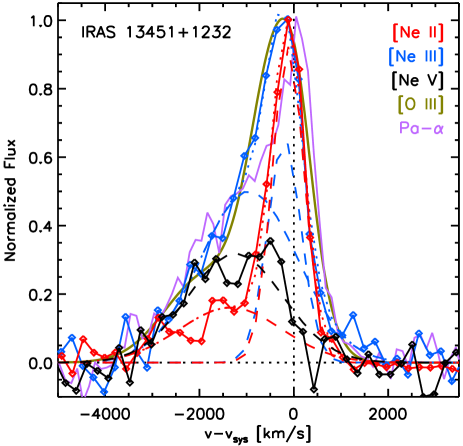
The third ULIRG with asymmetric neon line profiles is IRAS 13451+1232444We adopt z=0.121740.00001 as the systemic velocity for IRAS 13451+1232. This velocity corresponds to the velocity center of the narrow component in the 3-component fit to the 4959 & 5007 Å [O iii] doublet in the =1200 spectrum of Holt, Tadhunter & Morganti (2003). Using this redshift, the line centers of the H2 S(1) and S(3) lines occur at 40 and 2035 km s-1, respectively. Note that our adopted redshift is 200 km s-1 lower than the value derived from CO observations (Evans et al., 1999), also known as PKS 1345+12 (Fig. 7). The source, which is optically classified as Seyfert-2 (Veilleux, Sanders & Kim, 1997), comprises two nuclei separated by 1.8 (4.3 kpc; unresolved at the spatial resolution of Spitzer-IRS). Both the low resolution near-infrared 2.6–3.65 m (Imanishi, Dudley & Maloney, 2006) and the Spitzer mid-infrared spectrum is virtually featureless, characteristic of AGN heated hot dust. At the higher resolving power of IRS-SH, emission line profiles of 12.81 m [Ne ii], 15.56 m [Ne iii] and 14.32 m [Ne v] can be discerned on the continuum, the clearest of which is the is the [Ne iii] line. We fit its profile with a broad component of FWHM 2360110 km s-1 blue shifted by 95085 km s-1 and a narrow component of FWHM 67070 km s-1 blueshifted by 20025 km s-1. The broad component is responsible for 2/3 of the [Ne iii] emission, significantly more than for IRAS F00183–7111 but somewhat less than for IRAS 12127–1412NE. For the [Ne ii] line profile the 2-component decomposition results in a narrow component with a FWHM of 61050 km s-1 blueshifted by 12010 km s-1 and a broad component with FWHM 2470340 km s-1 blueshifted by 1290220 km s-1. The broad component carries 1/3 of the total [Ne ii] line flux, significantly less than for IRAS F00183–7111 and IRAS 12127–1412NE. The third line, the [Ne v] coronal line at 14.32 m, only has a blue shifted component, centered at a -124080 km s-1, which we fit with a Gaussian profile of FWHM 2300190 km s-1. The presence of [Ne v] emission only at blueshifted wavelengths is consistent with the difference in excitation between the narrow and broad components as measured from the [Ne iii]/[Ne ii] ratio. For the narrow component this ratio is 0.440.07, while for the broad component it is 1.60.3. The [Ne v]/[Ne ii] ratio for the broad component is 0.760.14.
In Fig. 7 we also show the sum of a 3-component fit to the profile of the 5007 Å [O iii] line, centered on the nucleus (Holt, Tadhunter & Morganti, 2003). The spectral resolution was degraded from =1200 to 600 for a proper comparison to our IRS-SH data. As a result of the degradation, the narrowest (FWHM=34023 km s-1) and weakest of the three kinematic components, centered at systemic velocity, gets blended with the intermediate width component (FWHM=125512 km s-1) centered at -4029 km s-1. The broadest, most blueshifted component (FWHM=194465 km s-1), centered at -198036 km s-1, can however still be recognized as a separate component. We also overplot the line profile of Pa (Veilleux, Sanders & Kim, 1997) with a narrow component of FWHM=773 km s-1 and a broad component of FWHM=2588 km s-1. The overlay suggests that the 15.56 m [Ne iii] line traces more or less the same blue shifted kinematic components as the 5007 Å [O iii] and Pa lines. The comparison further shows that, unlike IRAS F00183–7111, there is no evidence for the 5007 Å [O iii] line to cover a more limited velocity range than the 12.81 m [Ne ii] and 15.56 m [Ne iii] lines (Figs. 5 & 7). The latter is in agreement with the differences in the distribution of the obscuring medium as probed by the 9.7 m silicate absorption features (see Section 5.4).
5. Discussion
5.1. AGN activity in IRAS F00183–7111
Observations at various wavelengths suggest that IRAS F00183–7111 derives a substantial fraction of its bolometric power from accretion onto a central black hole. Especially important in this respect is the detection by Nandra & Iwasawa (2007) of a 6.7 keV Fe K line (Fe xxv) with a large equivalent width, indicating the presence of a Compton-thick AGN in IRAS F00183–7111. Another clear indication is a higher than expected radio power based on the radio-far-infrared correlation for starburst galaxies (Roy & Norris, 1997), as well as unpublished radio interferometric data showing the nucleus to be unresolved on the 200 pc scale (R.P. Norris, 2004, private communication).
The non-detection of several common mid-infrared AGN tracers in our Spitzer-IRS high resolution spectrum may hence indicate that the AGN coronal line region (CLR) is small or absent or, alternatively, that our line of sight to the AGN CLR is strongly obscured. The latter would be in agreement with the detection of a deep 9.7 m silicate absorption feature (Spoon et al., 2004, Fig 2), which is unusual for classical seyfert galaxies and quasars (Spoon et al., 2007; Hao et al., 2007). Even stronger obscuration, along all lines of sight, is suggested by Lutz et al. (2004), who concluded from a study of the 4.7 m CO gas absorption band that the strong detection of this feature in IRAS F00183–7111 (Spoon et al., 2004) and its non-detection in local AGNs observed with ISO indicates that the central power source in IRAS F00183–7111 must be fully covered rather than blocked by an edge-on torus.
5.2. Excitation conditions in the outflow of IRAS F00183–7111
To gain insight into the processes responsible for the presence of high velocity gas in IRAS F00183–7111 we compare IRAS F00183–7111 to the only other two ULIRGs in our sample that show pronounced blue wings in their 12.81 m [Ne ii] and 15.56 m [Ne iii] line profiles: IRAS 12127-1412NE (Fig. 6) and IRAS 13451+1232 (Fig. 7).
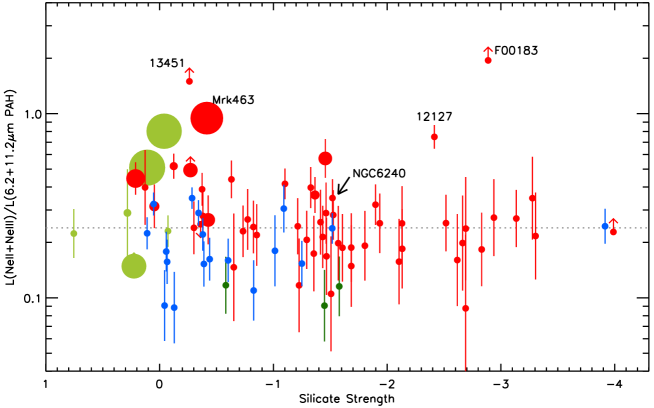
Clear evidence for unusual excitation conditions in IRAS F00183–7111 emerge if we compare the PAH emission and low-ionization neon line emission for AGNs, ULIRGs and starburst galaxies from the various Spitzer-IRS GTO programs, (U)LIRGs from Spitzer program 1096 and IRAS 12127–1412NE. The PAH luminosity should track the low-ionization neon line luminosity to within a factor two, if predominantly excited in star forming regions. This was indeed found to be the case for the sample of ULIRGs published by Farrah et al. (2007). In Fig.8 we plot the ratio of these two quantities (the combined [Ne ii]+[Ne iii] luminosity and the combined luminosity of the 6.2 and 11.2 m PAH features) as a function of increasing apparent depth of the 9.7 m silicate feature (i.e. the negative of the silicate strength, Ssil; Spoon et al., 2007). The symbol size scales linearly with the [Ne v]/[Ne ii] ratio above a threshold value of 0.4. This distinguishes ULIRGs with a strong AGN contribution to the [Ne ii]+[Ne iii] luminosity (e.g. Mrk 463; Farrah et al., 2007) from those without. As expected, for the sources lacking a strong AGN signature the average value of neon/PAH has a reasonably low scatter of a factor 1.4555In this computation we excluded the outliers IRAS F00183–7111, IRAS 12127–1412NE and IRAS 13451+1232. Keeping them included would increase the scatter to a factor 1.7, in agreement with the scaling relation between neon and PAH flux for ULIRGs found by Farrah et al. (2007). The notable exception is IRAS F00183–7111, which appears to be at least 8 times overluminous in the neon lines compared to its combined PAH luminosity. Another exception in the Ssil–1.5 regime is IRAS 12127–1412NE, which is overluminous in neon/PAH by a factor of 3. At Ssil–1.5, the situation is less straightforward. In this regime there are several sources with large [Ne v]/[Ne ii] ratios for which the AGN contributes significantly to the [Ne ii]+[Ne iii] luminosity, thereby raising the neon/PAH ratio (Fig.8). The only ULIRG in this regime which has an elevated neon/PAH ratio despite a low [Ne v]/[Ne ii] ratio of 0.28 is IRAS 13451+1232, at 6 times the average neon/PAH ratio (Fig.8). This brings the number of ULIRGs with unusual excitation conditions to three. Since these same three ULIRGs are also the only ULIRGs in our sample that show pronounced blue wings in their 12.81 m [Ne ii] and 15.56 m [Ne iii] line profiles, it seems plausible that the high neon/PAH ratios for these sources could be the result of additional neon line emission contributed by these blue wings rather than unusually weak PAH emission in these three sources.
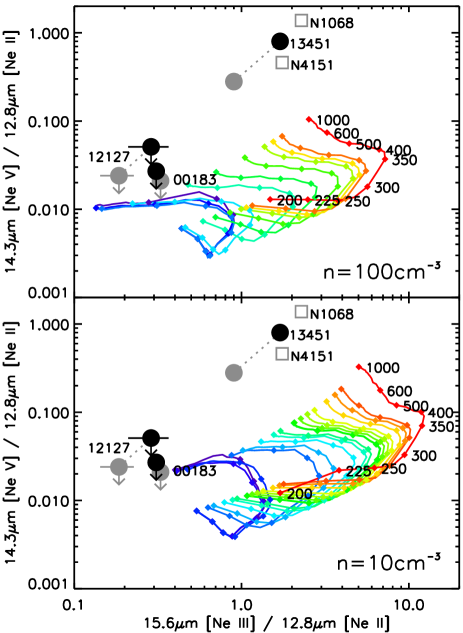
In Fig. 9 we show a mid-infrared diagnostic diagram based on the 12.81 m [Ne ii], 15.56 m [Ne iii] and 14.32 m [Ne v] lines. In the diagram we plot shock excitation models from the MAPPINGS IIIq library (Allen et al., 2008) for solar metallicity gas with densities n=100 cm-3 (upper panel) and n=10 cm-3 (lower panel). The model tracks plotted include the ionizing effects from UV and soft X-ray photons in the shock cooling zone on the gas ahead of the shock front. Overplotted are the positions of IRAS F00183–7111, IRAS 12127+1412NE and IRAS 13451+1232 from our Spitzer observations. Black filled circles indicate the results for just the broad blue-shifted emission line components, the gray versions denote the results based on the velocity-integrated line fluxes (i.e. the narrow and broad components combined). For IRAS F00183–7111 and IRAS 12127+1412NE the low observed [Ne iii]/[Ne ii] line ratios are consistent with high-velocity shocks (v500 km s-1) in high-density environments (n100 cm-3) with low magnetic field strengths (1 G). At lower gas densities (n10 cm-3), only the highest velocity shocks (v=1000 km s-1) at the lowest magnetic field strengths (0.1 G) are consistent with the observed [Ne iii]/[Ne ii] line ratios. Below this density the observed line ratios cannot have an origin in shock emission. Given the absence of density measurements we cannot rule out either scenario. However, as we will argue later, if the neon line emission originates at the base of the optical outflow, gas densities of n100 cm-3 may not be unreasonable. In IRAS 13451+1232 it is the high observed [Ne v]/[Ne ii] ratio which appears to rule out shocks of any velocity and density as the source of excitation for the neon lines. For the latter source, exposure of the blue shifted gas to direct radiation from the AGN seems a likely explanation for the presence of [Ne v] emission at the observed ratio to [Ne ii]. This explanation is supported by the proximity of the blue shifted component of IRAS 13451+1232 to the positions of the classical AGNs NGC 1068 and NGC 4151 in Fig. 9.
5.3. Strong obscuration on the outflow in IRAS F00183–7111
In Sect. 3.3 we analyzed the velocity structure of the 12.81 m [Ne ii] and 15.56 m [Ne iii] lines in IRAS F00183–7111 and compared the results to those of studies of its optical and near-infrared forbidden lines. This revealed that the mid-infrared neon emission lines have strongly blue shifted components not detected in both the optical 5007 Å [O iii] and near-infrared 1.644 m [Fe ii] line profiles. Given the mid-infrared spectral evidence for strong obscuration in the nucleus of IRAS F00183–7111 (Spoon et al., 2004), the simplest explanation for the absence of strongly blue shifted gas components in the optical and near-infrared emission lines is extinction. We estimate the required extinction by assuming line emission at any wavelength to be effectively suppressed by a specific extinction A()2. The level of screen extinction required to obscure the high-velocity components of the 5007 Å [O iii] line then amounts to A = AV2. If the same screen is responsible for obscuring the high-velocity components of the 1.644 m [Fe ii] line, the required extinction increases to AV10 (A1.64μm2). Then to still be able to see the strongly blue shifted 12.81 m [Ne ii] emission through this screen, the maximum extinction is constrained to AV50 (A12.81μm1). This implies a column density of the obscuring screen of NH = 2–10 1022 cm-2, assuming NH = 1.9 1021 AV.
In the absence of spatial information for the mid-infrared neon line emission, the location of the screen blocking the optical and near-infrared line emission cannot be determined with any certainty. However, it is plausible for the screen to be situated at the base of the outflow traced in 5007 Å [O iii]. The observed strong decrease in blueshift of the 5007 Å [O iii] line from 3 to 0 East of the nucleus (Fig. 12 of Heckman, Armus & Miley, 1990) may hence indicate that the material that obscures the most highly disturbed optical (but not mid-infrared) line emission is located within the inner 10 kpc.
5.4. The evolutionary state of IRAS F00183–7111
IRAS F00183–7111 is a clear outlier in a mid-infrared diagnostic diagram which combines the equivalent width of the 6.2 m PAH emission feature and the silicate strength in the so-called ‘fork’ diagram (Spoon et al., 2007). In this diagram most ULIRGs are found along one of two branches. One branch connects starburst-dominated mid-infrared spectra (e.g. NGC 7714 and M 82) to spectra of deeply buried central sources, characterized by very deep silicate features and the (virtual) absence of PAH emission (e.g. IRAS 08572+3915). The other branch connects starburst-dominated sources with featureless hot dust-dominated sources, which are mostly AGN dominated.
IRAS F00183–7111 is located in the scarcely populated region in between the tips of the two branches and has IRAS 12127+1412NE as its nearest neighbor. Their location, away from other deeply obscured sources, either implies a more than 10 times lower 6.2 m PAH equivalent width than other ULIRGs with similar silicate strength, or a less pronounced silicate feature than other deeply obscured ULIRGs. Spoon et al. (2007) have proposed that sources in between the two branches may be AGN evolving from a fully covered obscuring geometry to an incomplete or clumpy obscuring geometry, with a decrease in apparent depth of the silicate feature as a result. In this scenario, the detection of strongly blue shifted neon line emission would then trace a unique phase in the (partial) disruption of the obscuring medium around the powerful AGN. Alternatively, the isolated positions of IRAS F00183–7111 and IRAS 12127+1412NE in the fork diagram may be the result of unusual lines of sight into these systems. The unusual mid-infrared excitation conditions and kinematics may then be associated to that.
If sources with mid-infrared kinematic properties and neon/PAH ratios similar to IRAS F00183–7111 and IRAS 12127+1412NE are indeed AGN evolving from full to incomplete or clumpy obscuration, there should be observational characteristics linking them. However, the only ULIRG in our sample with these same mid-infrared properties, IRAS 13451+1232, has a mid-infrared continuum spectrum which is very different from the other two sources, displaying only a weak silicate absorption feature on an otherwise featureless power law spectrum. This places it firmly on the AGN branch in the fork diagram, far off from the other two sources. Evidence supporting an unusual evolutionary stage is presented by Holt, Tadhunter & Morganti (2003). Based on the shape of its radio SED and a kinematic study of its optical emission line spectrum, they conclude that IRAS 13451+1232 must be a young compact radio source whose radio jets are expanding through a dense nuclear dust shell, entraining gas and dust from this shell. They infer the reddening to be highest toward the broadest (most disturbed) most blue shifted kinematic component in their optical line study, reminiscent of our findings for IRAS F00183–7111 using optical, near and mid-infrared line profiles.
6. Conclusions
We have discovered high-velocity ionized gas with velocities ranging from -3500 to +3000 km s-1 as part of a nuclear outflow from the ULIRG IRAS F00183–7111. The gas is traced by the mid-infrared 12.81 m [Ne ii] and 15.51 m [Ne iii] lines, which are dominated by blue shifted components. Optical and near-infrared spectroscopic studies show no evidence for similar high-velocity gas components in forbidden lines at shorter wavelengths. We interpret this as the result of strong extinction (AV=10–50; A12.81μm1) on the blue shifted gas, identifying the base of the optical outflow (3 East) as its most likely origin.
Unusual excitation conditions in IRAS F00183–7111 are further implied by a comparison of the combined [Ne ii] and [Ne iii] luminosity and the combined 6.2 and 11.2 m PAH luminosity for a large sample of AGNs, ULIRGs and starburst galaxies. This reveals the neon line emission in IRAS F00183–7111 to be at least 8 times stronger compared to its PAH emission than the typical ratio for the sample.
Two other ULIRGs in our sample of 56 display mid-infrared excitation and kinematic properties similar to IRAS F00183–7111: IRAS 12127–1412NE and IRAS 13451+1232. Both sources have elevated neon/PAH ratios and exhibit pronounced blue wings in their 15.56 m [Ne iii] line profiles. Wings are also present in their 12.81 m [Ne ii] profiles, but are less pronounced, indicating blue shifted gas to have a higher [Ne iii]/[Ne ii] ratio than gas closer to systemic velocity. IRAS 13451+1232 even shows strongly blue shifted 14.32 m [Ne v] emission.
While for IRAS 13451+1232 the observed [Ne iii]/[Ne ii] and [Ne v]/[Ne ii] ratios indicate exposure of the blue shifted gas to direct radiation from the AGN, for IRAS F00183–7111 and IRAS 12127–1412NE the observed ratios are consistent with an origin in fast shocks (v500 km s-1) in an environment with gas densities n10 cm-3.
IRAS F00183–7111 and IRAS 12127–1412NE are clear outliers in the mid-infrared diagnostic diagram of silicate strength and 6.2 m PAH equivalent width, the so-called ‘fork’ diagram (Spoon et al., 2007). The sources are found in between the two branches which separate deeply buried nuclei and sources with incomplete or clumpy obscuring geometries. Spoon et al. (2007) have proposed that ULIRGs in between the tips of these branches may be AGN in the process of disrupting their fully covered geometry before settling on the AGN branch. IRAS 13451+1232 would then already be there, given its nearly featureless mid-infrared power law spectrum.
The results from our mid-infrared kinematic and excitation study are consistent with the above evolutionary scenario in that the strongly blue shifted [Ne ii] and [Ne iii] emission (from shocks) may trace the (partial) disruption of the obscuring medium around buried AGNs in IRAS F00183–7111 and IRAS 12127–1412NE. The detection of strongly blue shifted [Ne v] emission in IRAS 13451+1232 may then indicate the lifting of the obscuration around the AGN coronal line region to be further advanced in this ULIRG than in IRAS F00183–7111 and IRAS 12127–1412NE, where this line is undetected.
.1. Molecular hydrogen lines
Our measurements of the S(1), S(2), S(3) and S(4) pure rotational molecular hydrogen lines allow us to investigate the properties of warm molecular hydrogen in IRAS F00183–7111. Unfortunately, a measurement of the important S(0) line is lacking as it is outside the IRS-LH bandpass. In Fig. 10 we show the excitation diagram for molecular hydrogen for the four measured lines. Given the placement of the S(3) line at the peak of the silicate absorption feature, we can attempt an extinction correction on the four data points under the assumption that a) the excitation temperature should be constant or increase monotonically with increasing upper level energy Eu(,J), b) that the ortho-to-para ratio is 3 (i.e. assuming LTE), and c) that the cooler gas probed by the S(1) and S(2) lines is more or less co-spatial with the warmer gas probed by the S(3) and S(4) lines. Adopting the local ISM extinction law of Chiar & Tielens (2006), we then find that the extinction on the H2 lines ranges between AV=15 and 25. This is far lower than the extinction on the continuum source, which is AV54 based on the apparent depth of the 9.7 m silicate feature (=3.0; Spoon et al., 2006) and AV/=18 (Roche & Aitken, 1984).
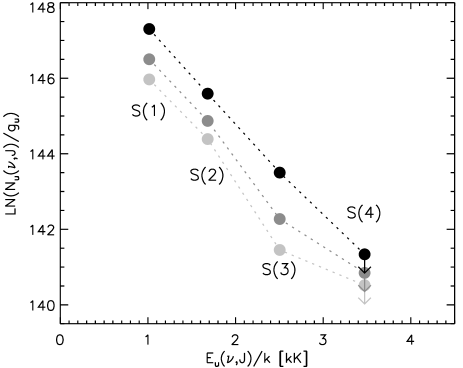
Based on the two detected ortho-H2 lines, it is possible to infer an excitation temperature for the warm molecular hydrogen. The value ranges from 330 to 390 K for extinction corrections ranging from AV=0 to 25. Assuming all H2 levels to be in LTE at 330–390 K, we derive a total warm molecular hydrogen mass of 8–20 108 M⊙. This value becomes a lower limit if the excitation temperature based on the upper level populations of the S(0) and S(1) lines is lower than those based on the S(1) and S(3) lines – which is usually the case (e.g. Higdon et al., 2006). Unfortunately, we cannot determine the warm to total molecular hydrogen fraction and compare this to other ULIRGs, as no millimeter CO line measurement exists for IRAS F00183–7111 from which to infer the cold molecular hydrogen mass.
.2. Non-detection of absorption bands of C2H2 and HCN gas
Several ULIRGs show absorption bands of C2H2 and HCN gas in their 13.7–14.1 m Spitzer IRS-SH spectra (Spoon et al., 2005; Lahuis et al., 2007). Detections are especially strong among ULIRGs with pronounced silicate absorption features, like IRAS 20100–4156 and IRAS 15250+3609. Far weaker detections are reported for ULIRGs with AGN-like spectra, like IRAS 05189–2524, IRAS 01003–2238 and Mrk 231 (Lahuis et al., 2007). Detections at these levels require spectra to have signal-to-noise ratios of at least 100 in their continua. The IRS-SH spectrum of IRAS F00183–7111 does not show any indication for the presence of either feature, despite a continuum S/N of 70. This translates into upper limits on the C2H2 and HCN gas column densities of N(C2H2)1.21016 cm-2 and N(HCN)3.01016 cm-2 for an adopted excitation temperature of 300 K (F. Lahuis, private communication).
References
- Allen et al. (2008) Allen, M.G., Groves, B.A., Dopita, M.A., Sutherland, R.S., Kewley, L.J., 2008, ApJS, 178, 20
- Armus, Heckman & Miley (1989) Armus, L., Heckman, T.M., Miley, G.K., 1989, ApJ, 347, 727
- Armus, Heckman & Miley (1990) Armus, L., Heckman, T.M., & Miley, G.K., 1990, ApJ, 364, 471
- Armus et al. (2006) Armus, L., et al. 2006, ApJ, 640, 204
- Armus et al. (2007) Armus, L., et al. 2007, ApJ, 656, 148
- Buchanan et al. (2006) Buchanan, C.L., McGregor, P.J., Bicknell, G.V., Dopita, M.A., 2006, AJ, 132, 27
- Castor, McRay & Weaver (1975) Castor, J., McRay, R., Weaver, R., 1975, ApJ, 200, L107
- Chevalier & Clegg (1985) Chevalier, R.A., Clegg, A.W. 1985, Nature, 317, 44
- Chiar & Tielens (2006) Chiar, J.E., Tielens, A.G.G.M., 2006, ApJ, 637, 774
- Cohen et al. (2003) Cohen, M., Megeath, S.T., Hammersley, P.L., Martín-Luis, F., Stauffer, J., 2003, AJ, 125, 2645
- Dasyra et al. (2008) Dasyra, K.M., et al. 2008, ApJ, 674, L9
- Dannerbauer et al. (2005) Dannerbauer, H., Rigopoulou, D., Lutz, D., Genzel, R., Sturm, E., Moorwood, A.F.M., 2005, A&A, 441, 999
- de Grijp et al. (1985) de Grijp, M.K.H., Miley, G.K., Lub, J., de Jong, T., 1985, Nature, 314, 240
- Drake et al. (2004) Drake, C.L., McGregor, P.J., Dopita, M.A., 2004, AJ, 128, 955
- Evans et al. (1999) Evans, A.S., Kim, D.C., Mazzarella, J.M., Scoville, N.Z., Sanders, D.B., 1999, ApJ, 521, L107
- Farrah et al. (2007) Farrah, D., et al., 2007, ApJ, 667, 149
- Fazio et al. (2004) Fazio, G.G., et al. 2004, ApJS, 154, 10
- Fisher et al. (1995) Fisher, K.B., Huchra, J.P., Strauss, M.A., Davis, M., Yahil, A., Schlegel, D., 1995, ApJS, 100, 69
- Galliano et al. (2008) Galliano, F., Madden, S.C., Tielens, A.G.G.M., Peeters, E., Jones, A.P., 2008, ApJ, 679, 310
- Grimes et al. (2005) Grimes, J.P., Heckman, T.M., Strickland, D., Ptak, A., 2005, ApJ, 628, 187
- Hao et al. (2007) Hao, L., Weedman, D.W., Spoon, H.W.W., Marshall, J.A., Levenson, N.A., Elitzur, M., Houck, J.R., 2007, ApJ655, 77
- Heckman, Armus & Miley (1990) Heckman, T.M., Armus, L., Miley, G.K., 1990, ApJS, 74, 833
- Heckman et al. (2000) Heckman, T.M., Lehnert, M.D., Strickland, D.K., Armus, L., 2000, ApJS, 129, 493
- Higdon et al. (2004) Higdon, S.J.U., et al., 2004, PASP, 116, 975
- Higdon et al. (2006) Higdon, S.J.U., Armus, L., Higdon, J.L., Soifer, B.T., Spoon, H.W.W., 2006, ApJ, 648, 323
- Holt, Tadhunter & Morganti (2003) Holt, J., Tadhunter, C.N., Morganti, R., 2003, MNRAS, 342, 227
- Houck et al. (2004) Houck, J.R., et al. 2004, ApJS, 154, 18
- Imanishi, Dudley & Maloney (2006) Imanishi, M., Dudley, C.C., Maloney, P.R., 2006, ApJ, 637, 114
- Imanishi et al. (2007) Imanishi, M., Dudley, C.C., Maiolino, R., Maloney, P.R., Nakagawa, T., Risaliti, G., 2007, ApJS, 171, 72
- Lahuis et al. (2007) Lahuis, F., et al., 2007, ApJ659, 296
- Lehnert, Heckman & Weaver (1999) Lehnert, M.D., Heckman, T.M., & Weaver, K.A., 1999, ApJ, 523, 575
- Lutz et al. (1998) Lutz, D., Kunze, D., Spoon, H.W.W., Thornley, M.D., 1998, A&A, 333, L75
- Lutz et al. (2004) Lutz, D., Maiolino, R., Spoon, H.W.W., Moorwood, A.F.M., 2004, A&A, 418, 465
- Marshall et al. (2007) Marshall, J.A., Herter, T.L., Armus, L., Charmandaris, V., Spoon, H.W.W., Bernard-Salas, J., Houck, J.R., 2007, ApJ, 670, 129
- Martin (2005) Martin, C.L., 2005, ApJ, 619, L1
- Molster & Kemper (2005) Molster, F., Kemper, C., 2005, Space Sci. Rev., 119, 3
- Murray, Quaetert & Thompson (2005) Murray, N., Quaetert, E., & Thompson, T.A., 2005, ApJ, 681, 569
- Nandra & Iwasawa (2007) Nandra, K., Iwasawa, K., 2007, MNRAS, 382, L1
- Norris et al. (1988) Norris, R.P., Kesteven, M.J., Troupe, E., Allen, D.A., 1988, MNRAS, 234, P51
- Pettini et al. (2001) Pettini, M., et al., 2001, ApJ, 554, 981
- Pettini et al. (2002) Pettini, M., Rix, S.A., Steidel, C.C., Adelberger, K.L., Hunt, M.P., Shapley, A.E., 2002, ApJ, 569, 742
- Rieke et al. (2004) Rieke, G.H., et al. 2004, ApJS, 154, 25
- Rigopoulou et al. (1999) Rigopoulou, D., Spoon, H.W.W., Genzel, R., Lutz, D., Moorwood, A.F.M., Tran, Q.D., 1999, AJ, 118, 2625
- Roche & Aitken (1984) Roche, P.F., Aitken, D.K., 1984, MNRAS, 208, 481
- Roy & Norris (1997) Roy, A.L., Norris, R.P., 1997, MNRAS,289, 824
- Rupke et al. (2005) Rupke, D.S., Veilleux, S., Sanders, D.B., 2005, ApJ, 632, 751
- Sanders et al. (1988) Sanders, D.B., Soifer, B.T., Elias, J.H., Neugebauer, G., Matthews, K., 1988, ApJ, 328, L35
- Shapley et al. (2003) Shapley, A.E., Steidel, C.C., Pettini, M., Adelberger, K.L., 2003, ApJ, 588, 65
- Smith et al. (2007) Smith, J.-D., et al. 2007, ApJ, 656, 770
- Spoon et al. (2002) Spoon, H.W.W., Keane, J.V., Tielens, A.G.G.M., Lutz, D., Moorwood, A.F.M., Laurent, O., 2002, A&A, 385, 1022
- Spoon et al. (2004) Spoon, H.W.W., et al., 2004, ApJS, 154, 184
- Spoon et al. (2005) Spoon, H.W.W., Keane, J.V., Cami, J., Lahuis, F., Tielens, A.G.G.M., Armus, L., Charmandaris, V., 2005, in IAU Symp. 231, Astrochemistry: Recent Successes and Current Challenges, eds. D.C. Lis, G.A. Blake & E. Herbst, (Cambridge: Cambridge Univ. Press)
- Spoon et al. (2006) Spoon, H.W.W., et al., 2006, ApJ, 638, 759
- Spoon et al. (2007) Spoon, H.W.W., Marshall, J.A., Houck, J.R., Elitzur, M., Hao, L., Armus, L., Brandl, B.R., Charmandaris, V., 2007, ApJ, 654, 49
- Strickland et al. (2004) Strickland, D.K., Heckman, T.M., Colbert, E.J.M., Hoopes, C.G., Weaver, K.A., 2004, ApJ, 606, 829
- Sturm et al. (2002) Sturm, E., Lutz, D., Verma, A., Netzer, H., Sternberg, A., Moorwood, A.F.M., Oliva, E., Genzel, R., 2002, A&A, 393, 821
- Sturm et al. (2006) Sturm, E., et al., 2006, ApJ, 653, L13
- Tran et al. (2001) Tran, Q.D., et al., 2001, ApJ, 552, 527
- Veilleux, Sanders & Kim (1997) Veilleux, S., Sanders, D.B., Kim, D.-C., 1997, ApJ, 484, 92
- Veilleux, Kim & Sanders (1999) Veilleux, S., Kim, D.-C., Sanders, D.B., 1999, ApJ, 522, 113
- Veilleux, Kim & Sanders (2002) Veilleux, S., Kim, D.-C., Sanders, D.B., 2002, ApJS, 143, 315
- Veilleux, Cecil & Bland-Hawthorn (2005) Veilleux, S., Cecil, G., Bland-Hawthorn, J., 2005, ARA&A, 43, 769
- Weaver et al. (1977) Weaver, R., McCray, R., Castor, J., Shapiro, P., Moore, R., 1977, ApJ, 218, 377
- Werner et al. (2004) Werner, M.W., et al., 2004, ApJS, 154, 1