X-ray imaging of the dynamic magnetic vortex core deformation
Abstract
Magnetic platelets with a vortex configuration are attracting considerable attention. The discovery that excitation with small in-plane magnetic fields Van Waeyenberge et al. (2006) or spin polarised currents Yamada et al. (2007) can switch the polarisation of the vortex core did not only open the possibility of using such systems in magnetic memories, but also initiated the fundamental investigation of the core switching mechanism itself. Micromagnetic models predict that the switching is mediated by a vortex-antivortex pair, nucleated in a dynamically induced vortex core deformation. This theoretical framework also predicts a critical core velocity, above which switching occurs Yamada et al. (2007); Guslienko et al. (2008). Although this model is extensively studied and generally accepted Kim et al. (2007, 2008); Gliga et al. (2008a, b, c); Guslienko et al. (2008); Liu et al. (2007a, b); Lee et al. (2007); Xiao et al. (2007); Kravchuk et al. (2007); Hertel et al. (2007), experimental support has been lacking until now. In this work, we have used high-resolution time-resolved X-ray microscopy to study the detailed dynamics of vortices. We reveal the dynamic vortex core deformation preceding the core switching. In addition, the threshold velocity is directly measured, allowing for a quantitative comparison with micromagnetic models.
pacs:
75.75.+a, 76.50.+g, 07.85.TtA magnetic vortex appears as the ground state in soft magnetic, micron-sized structures with adequate dimensions. This configuration is characterised by an in-plane curling magnetisation, and an out-of-plane vortex core at the centre of
the structure Feldtkeller and Thomas (1965); Raabe et al. (2000). The diameter of the vortex core is typically only 10 – 25 nm Wachowiak et al. (2002); Chou et al. (2007), depending on the material and thickness.
It was shown that a low-field excitation of the so-called vortex gyration mode Huber (1982); Argyle et al. (1984); Guslienko et al. (2002) can switch the out-of-plane polarisation of the vortex core Van Waeyenberge et al. (2006). This was experimentally observed by determining the vortex core polarisation before and after the application of short bursts of an alternating magnetic field Van Waeyenberge et al. (2006). The dynamic process behind the switching could not be inferred from this experiment. However, micromagnetic modelling showed that near a moving vortex core, a region appears where the magnetisation acquires an out-of-plane component opposing the vortex core polarisation. If this so-called vortex core deformation becomes so strong that it points fully out of the sample plane, a vortex-antivortex pair is nucleated. At this point, the switching is initiated, as the antivortex rapidly annihilates with the original vortex, leaving behind only the newly created vortex with an opposite core polarisation Van Waeyenberge et al. (2006); Hertel et al. (2007); Gaididei et al. (2008). This annihilation process involves a magnetic singularity, which is necessary for the switching Thiaville et al. (2003).
Apart from micromagnetic simulations, the dynamic core deformation had already been included in theoretical calculations by Novosad et al. Novosad et al. (2005). Its origin and relevance for the switching process were investigated by Yamada et al. Yamada et al. (2007) and by Guslienko et al. Guslienko et al. (2008). These authors show that near a moving vortex,
a strong out-of-plane “kinetic” term in the effective field appears. It is this field that pushes the magnetisation towards the opposite direction of the core polarisation, causing the dynamic deformation.
Since the effective out-of-plane field is proportional to the velocity of the vortex movement Yamada et al. (2007), a critical velocity must exist at which a vortex-antivortex pair is created and core switching will occur Yamada et al. (2007). The critical velocity is predicted to be independent of the strength and type of the applied excitation and to only depend on the exchange parameter Guslienko et al. (2008). Calculated critical velocities for typical Permalloy systems range from 250 m/s Yamada et al. (2007) to 320 m/s Guslienko et al. (2008).
We have used time-resolved magnetic scanning transmission X-ray microscopy (STXM) to image the detailed dynamics of the out-of-plane component of the magnetisation in Permalloy nanostructures. A spatial resolution of about 30 nm and a temporal resolution of 100 ps could be reached (see Methods). Micromagnetic simulations (see Methods) yield a vortex core diameter of 25.4 nm (full width half maximum, averaged over the layer thickness) for the investigated structure. Although this is smaller than the lateral resolution of the microscope, it can still be resolved but appears smeared out Chou et al. (2007).
Fig. 1a-b shows STXM images of the centre portion of a 500 nm 500 nm 50 nm Permalloy square structure. The structure is excited with a continuous in-plane rf magnetic field oscillating at a frequency of 562.5 MHz, close to the eigenfrequency of its gyrotropic mode Vansteenkiste et al. (2008). Under these conditions, a steady-state gyration of the vortex is obtained. In order to remove the non-magnetic contrast contributions, reference images recorded at a 180∘ phase shift of the rf excitation are subtracted from the respective images. In these so-called differential images, the vortex core appears twice: once from the original image, and once with inverted contrast from the reference image. The positions of these two vortex core images are mirrored
with respect to the structure-centre and appear well-separated when the gyration radius is larger than the lateral resolution of the microscope — about 30 nm.
The stroboscopic images were recorded at eight phases of the gyration cycle, with time intervals of 222 ps between them. The last four images were then subtracted from the respective first four, and
the resulting four differential images are shown. In Fig. 1a, the vortex core points up and appears as a red spot, marked
with a circle. Note that the vortex core gyrates counterclockwise, as dictated by its polarisation Huber (1982). The blue spot in the image originates from the subtraction of the reference image, and corresponds to a negative image of the core appearing with a 180∘ phase shift in the gyration cycle. The amplitude of the excitation is here 0.32 mT and causes the core to
gyrate with an average velocity of (160 20) m/s. This velocity was determined from the average radius of the
gyration, since the angular velocity is fixed and . The trajectory was thus assumed to be approximately circular, which is verified by the simulations in Fig. 1c-d.
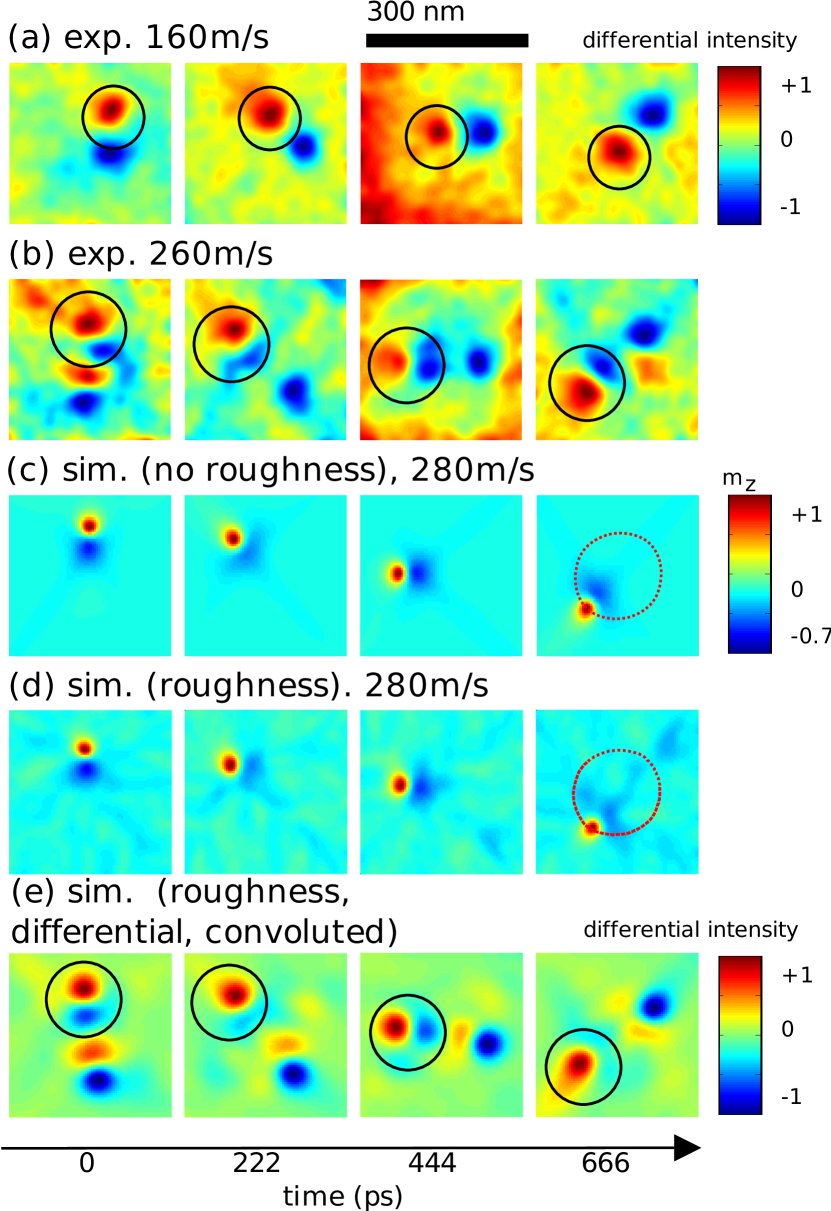
When the excitation amplitude is increased, a larger gyration amplitude, and consequently a larger velocity, can be observed.
At 0.89 mT (Fig. 1b) the average gyration velocity is (260 20) m/s. This excitation is already very close to the switching threshold. When the field was increased to 1 mT, the vortex core polarisation was found to be switching back and forth. Further investigation of the images recorded just below the switching threshold reveals an additional spot near the vortex core (also shown in Fig. 2). Having a magnetisation opposite to the core, this spot is identified as the dynamic vortex core deformation. This deformation was predicted as the nucleation site of the vortex-antivortex pair when the gyration velocity reaches the threshold for core switching Yamada et al. (2007); Guslienko et al. (2008).
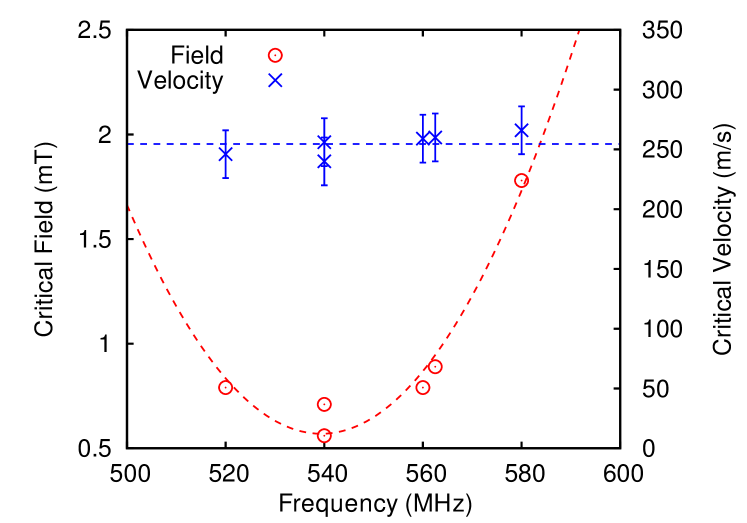
Besides the direct observation of the dynamic vortex core deformation, these experiments also allow to determine the critical velocity for core switching. This was done by increasing the excitation in small steps of maximum 12 % until vortex core reversal was observed. The critical switching velocity was estimated by determining the maximum core velocity, right below the switching threshold Yamada et al. (2007). This procedure was repeated when the excitation frequency was detuned, away from the gyrotropic resonance where higher excitation amplitudes are necessary to achieve switching. The highest measured velocities of various samples at different excitation amplitudes are shown in Fig. 3. Even when the magnetic field amplitude required for switching varied by more than a factor of two, the core velocity just below the threshold was found to be constant within the experimental error. The vortex core velocity thus appears indeed to be the critical switching parameter, regardless of excitation amplitude and frequency.
The experimental results could be well reproduced by micromagnetic simulations. A Permalloy platelet with the same dimensions as the experimentally investigated ones was simulated. In Fig. 1c, the simulated out-of-plane component of the magnetisation is shown during a steady-state gyration just below the switching threshold. The vortex core deformation can be distinguished as a spot with opposite polarisation next to the vortex core. The strength of the deformation is not entirely constant, but its fluctuations follow the 4-fold symmetry of the square sample. In order to reproduce the experimental results as well as possible, simulations including a small surface roughness (see Methods) were performed as well (Fig. 1d). In our evaporated thin films, such surface roughness is inevitable. The roughness did not change the underlying switching mechanism itself, but was found to only induce some additional fluctuations in the deformation profile as well as some additional out-of-plane magnetisation components, as is also seen in the experimental images.
To illustrate the correspondence between the simulations with roughness and the experiment, a series of differential images was generated from these simulations (Fig. 1d). These are obtained via the same procedure as the experimental differential images (from each image, the image corresponding to a 180∘ phase shift of the rf excitation has been subtracted), and have been convoluted with a gaussian function corresponding to the lateral resolution of the microscope. The position and size of the deformation in these images can be seen to correspond well to the experimental data in Fig. 1b.
From the simulations, an instantaneous critical velocity of 300 m/s was found, which is well in the range of the predicted velocities Yamada et al. (2007); Guslienko et al. (2008). The vortex core velocity was however found to fluctuate along the trajectory. This is not only due to the repetitive acceleration by the rf field, but also due to the surface roughness, which causes some additional fluctuations. Therefore, the average velocity over one period was slightly lower than the peak velocity: about 280 m/s. This is in good agreement with the experimental average velocities, considering that the experimental values are lower limits of the actual switching threshold.
In conclusion, we have experimentally observed the dynamic vortex core deformation and threshold velocity, providing the first strong experimental support for the microscopic switching model via vortex-antivortex creation and annihilation. This is the first time that “internal” dynamics of the vortex core could be imaged by time-resolved X-ray microscopy. Further improvement of the spatial and temporal resolution may even open the possibility to observe the vortex-antivortex pair creation and annihilation itself.
Methods
Experiments
High-resolution images of the vortex core dynamics in Permalloy nanostructures were recored using the scanning transmission X-ray microscope at the Advanced Light Source (ALS, beamline 11.0.2) Kilcoyne et al. (2003). This microscope has a resolution of about 30 nm. Since the pixel size was only 5 nm, the presented images could be slightly smoothed to reduce the noise, without loosing significant information (no such smoothing was applied during the quantitative analysis). The investigated nanostructures were square-shaped and patterned from an evaporated Permalloy film on top of a 2.5 m wide and 150 nm thick Cu stripline used for the magnetic excitation. The magnetisation is imaged using the X-ray magnetic circular dichroism (XMCD) effect Schütz et al. (1987). By orienting the sample plane perpendicular to the photon beam, the out-of-plane component of the magnetisation is measured, allowing direct imaging of the vortex core Chou et al. (2007). An rf current is transmitted through the stripline underneath the magnetic structures and induces an in-plane rf magnetic field . By synchronising the excitation with the X-ray flashes of the synchrotron, stroboscopic images of the moving vortex core can be recorded. The time resolution of these images is limited by the width of the photon flashes to about 100 ps.
Simulations
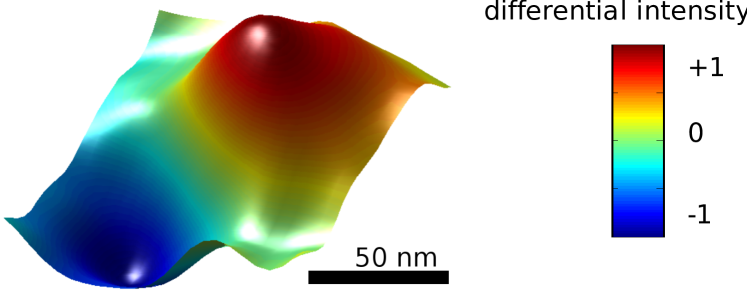
A 500 nm 500 nm 50 nm platelet was simulated with a cell size of 3.9 nm 3.9 nm 12.5 nm. Typical material parameters for Permalloy were used: saturation magnetisation =800 103 A/m, exchange constant =13 10-12 J/m, damping parameter =0.01, anisotropy constant =0. An excitation of 1.9 mT at 562.5 MHz was applied, which is just below the switching threshold. The amumag micromagnetic package, an in-house developed 3D finite-element code, was used to solve the Landau-Lifshitz equation Landau and Lifshitz (1935). The source code is available at http://code.google.com/p/amumag. The Fast Multipole Method Visscher and Apalkov (2004) was employed to calculate the magnetostatic fields, assuming constant magnetisation in each of the hexahedral cells. The simulations did not include thermal fluctuations. In order to match the realistic sample geometry as close as possible, a small random surface roughness was introduced (rms amplitude 5 nm, correlation length 20 nm).
References
- Van Waeyenberge et al. (2006) B. Van Waeyenberge, A. Puzic, H. Stoll, K. W. Chou, T. Tyliszczak, R. Hertel, M. Fahnle, H. Bruckl, K. Rott, G. Reiss, et al., Nature 444, 461 (2006).
- Yamada et al. (2007) K. Yamada, S. Kasai, Y. Nakatani, K. Kobayashi, H. Kohno, A. Thiaville, and T. Ono, Nat. Mater. 6, 269 (2007).
- Guslienko et al. (2008) K. Y. Guslienko, K. S. Lee, and S. K. Kim, Phys. Rev. Lett. 100, 027203 (2008).
- Kim et al. (2007) S. K. Kim, Y. S. Choi, K. S. Lee, K. Y. Guslienko, and D. E. Jeong, Appl. Phys. Lett. 91, 082506 (2007).
- Kim et al. (2008) S. K. Kim, J. Y. Lee, Y. S. Choi, K. Y. Guslienko, and K. S. Lee, Appl. Phys. Lett. 93, 052503 (2008).
- Gliga et al. (2008a) S. Gliga, M. Yan, R. Hertel, and C. M. Schneider, Phys. Rev. B 77, 060404 (2008a).
- Gliga et al. (2008b) S. Gliga, R. Hertel, and C. M. Schneider, Physica B-condensed Matter 403, 334 (2008b).
- Gliga et al. (2008c) S. Gliga, R. Hertel, and C. M. Schneider, J. Appl. Phys. 103, 07B115 (2008c).
- Liu et al. (2007a) Y. W. Liu, H. He, and Z. Z. Zhang, Appl. Phys. Lett. 91, 242501 (2007a).
- Liu et al. (2007b) Y. Liu, S. Gliga, R. Hertel, and C. M. Schneider, Appl. Phys. Lett. 91, 112501 (2007b).
- Lee et al. (2007) K. S. Lee, K. Y. Guslienko, J. Y. Lee, and S. K. Kim, Phys. Rev. B 76, 174410 (2007).
- Xiao et al. (2007) Q. F. Xiao, J. Rudge, E. Girgis, J. Kolthammer, B. C. Choi, Y. K. Hong, and G. W. Donohoe, J. Appl. Phys. 102, 103904 (2007).
- Kravchuk et al. (2007) V. P. Kravchuk, D. D. Sheka, Y. Gaididei, and F. G. Mertens, J. Appl. Phys. 102, 043908 (2007).
- Hertel et al. (2007) R. Hertel, S. Gliga, M. Fahnle, and C. M. Schneider, Phys. Rev. Lett. (USA) 98, 117201/1 (2007).
- Feldtkeller and Thomas (1965) E. Feldtkeller and H. Thomas, Phys Kondens Mater 4, 8 (1965).
- Raabe et al. (2000) J. Raabe, R. Pulwey, R. Sattler, T. Schweinbock, J. Zweck, and D. Weiss, J. Appl. Phys. 88, 4437 (2000).
- Wachowiak et al. (2002) A. Wachowiak, J. Wiebe, M. Bode, O. Pietzsch, M. Morgenstern, and R. Wiesendanger, Science 298, 577 (2002).
- Chou et al. (2007) K. W. Chou, A. Puzic, H. Stoll, D. Dolgos, G. Schutz, B. V. Waeyenberge, A. Vansteenkiste, T. Tyliszczak, G. Woltersdorf, and C. H. Back, Appl. Phys. Lett. 90, 202505 (2007).
- Huber (1982) D. L. Huber, J. Appl. Phys. 53, 1899 (1982).
- Argyle et al. (1984) B. E. Argyle, E. Terrenzio, and J. C. Slonczewski, 1984 Digests Of Intermag ’84. International Magnetics Conference (cat. No. 84ch1918-2) pp. 350–350 (1984).
- Guslienko et al. (2002) K. Y. Guslienko, B. A. Ivanov, V. Novosad, Y. Otani, H. Shima, and K. Fukamichi, J. Appl. Phys. 91, 8037 (2002).
- Gaididei et al. (2008) Y. B. Gaididei, V. P. Kravchuk, D. D. Sheka, and F. G. Mertens, Low Temperature Physics 34, 528 (2008).
- Thiaville et al. (2003) A. Thiaville, J. M. Garcia, R. Dittrich, J. Miltat, and T. Schrefl, Phys. Rev., B, Condens, Matter Mater. Phys. (USA) 67, 94410 (2003).
- Novosad et al. (2005) V. Novosad, F. Y. Fradin, P. E. Roy, K. S. Buchanan, K. Y. Guslienko, and S. D. Bader, Phys. Rev. B 72, 024455 (2005).
- Vansteenkiste et al. (2008) A. Vansteenkiste, J. D. Baerdemaeker, K. W. Chou, H. Stoll, M. Curcic, T. Tyliszczak, G. Woltersdorf, C. H. Back, G. Schutz, and B. V. Waeyenberge, Phys. Rev. B 77, 144420 (2008).
- Kilcoyne et al. (2003) A. Kilcoyne, T. Tyliszczak, W. Steele, S. Fakra, P. Hitchcock, K. Franck, E. Anderson, B. Harteneck, E. Rightor, G. Mitchell, et al., Journal of Synchrotron Radiation 10, 125 (2003).
- Schütz et al. (1987) G. Schütz, W. Wagner, W. Wilhelm, P. Kienle, R. Zeller, R. Frahm, and G. Materlik, Phys. Rev. Lett. 58, 737 (1987).
- Landau and Lifshitz (1935) L. Landau and E. Lifshitz, Phys. Z. Sowietunion 8 (1935).
- Visscher and Apalkov (2004) P. B. Visscher and D. M. Apalkov, Physica B 343, 184 (2004).
Acknowledgements
Financial support by The Institute for the promotion of Innovation by Science and Technology in Flanders (IWT-Flanders) and by the Research Foundation Flanders (FWO-Flanders) through the research grant 60170.06 are gratefully acknowledged. The Advanced Light Source is supported by the Director, Office of Science, Office of Basic Energy Sciences, of the U.S. Department of Energy.
Author contributions
Analyses and micromagnetic simulations: A.V.; Experiments: A.V., K.W.C., M.W., M.C., V.S., H.S., T.T.; Writing the paper: A.V., K.W.C., G.W., C.H.B., H.S., B.V.; Sample preparation: G.W., C.H.B.; Project planning: H.S., B.V., G.S.