The WEBT Campaign on the Intermediate BL Lac Object 3C 66A in 2007 – 2008111The radio-to-optical data presented in this paper are stored in the WEBT archive; for questions regarding their availability, please contact the WEBT President Massimo Villata (villata@oato.inaf.it).
Abstract
Prompted by a high optical state in September 2007, the Whole Earth Blazar Telescope (WEBT) consortium organized an intensive optical, near-IR (JHK) and radio observing campaign on the intermediate BL Lac object 3C 66A throughout the fall and winter of 2007 – 2008. In this paper, we present data from 28 observatories in 12 countries, covering the observing season from late July 2007 through February 2008.
The source remained in a high optical state throughout the observing period and exhibited several bright flares on time scales of days. This included an exceptional outburst around September 15 – 20, 2007, reaching a peak brightness at . Our campaign revealed microvariability with flux changes up to mag/hr.
Our observations do not reveal evidence for systematic spectral variability in the overall high state covered by our campaign, in agreement with previous results. In particular, we do not find evidence for spectral hysteresis in 3C 66A for which hints were found in an earlier campaign in a somewhat lower flux state. We did also not find any evidence for spectral lags in the discrete correlation functions between different optical bands.
We infer a value of the magnetic field in the emission region of G, where is the magnetic field equipartition fraction, is the shortest observed variability time scale in units of hours, and is the Doppler factor in units of 10. From the lack of systematic spectral variability, we can derive an upper limit on the Doppler factor, . This is in perfect agreement with superluminal motion measurements with the VLBI/VLBA of and argues against models with very high Lorentz factors of , required for a one-zone synchrotron-self-Compton interpretation of some high-frequency-peaked BL Lac objects detected at TeV -ray energies.
1 Introduction
Blazars are the most violent class of active galactic nuclei, consisting of flat-spectrum radio quasars (FSRQs) and BL Lac objects. They exhibit rapid variability down to time scales as short as a few minutes (Aharonian et al., 2007; Albert et al., 2007b). Their observed flux is dominated by a non-thermal continuum exhibiting two broad spectral bumps: A low-frequency bump from radio to UV – X-ray frequencies, and a high-frequency component from X-ray to -rays.
In the framework of relativistic jet models, the low-frequency (radio – optical/UV) emission from blazars is interpreted as synchrotron emission from nonthermal electrons in a relativistic jet. The high-frequency (X-ray – -ray) emission could either be produced via Compton upscattering of low frequency radiation by the same electrons responsible for the synchrotron emission (leptonic jet models; for a recent review see, e.g., Böttcher, 2007), or due to hadronic processes initiated by relativistic protons co-accelerated with the electrons (hadronic models, for a recent discussion see, e.g., Mücke & Protheroe, 2001; Mücke et al., 2003).
The blazar 3C 66A (= 0219+428) is classified as a low-frequency peaked BL Lac object (LBL), a class also commonly referred to as radio selected BL Lac objects. Its nonthermal low-frequency spectral component extends from radio frequencies through soft X-rays and typically peaks in the optical frequency range. The high-frequency component seems to peak in the multi-MeV – GeV energy range. Since its optical identification by Wills & Wills (1974), 3C 66A has been the target of many radio, IR, optical, X-ray, and -ray observations in the past, although it is not as regularly monitored at radio frequencies as many other blazars due to problems with source confusion with the nearby radio galaxy 3C 66B (6’.5 from 3C 66A), in particular at lower (4.8 and 8 GHz) frequencies (Aller, Aller, & Hughes, 1994; Takalo et al., 1996).
To date, about 2 dozen blazars have been detected at very high energies ( GeV) with ground-based air Čerenkov telescope facilities. Until very recently, all TeV blazars belonged to the sub-class of high-frequency peaked BL Lac objects (HBLs). However, the recent detections of the intermediate BL Lac object W Comae (Acciari et al., 2008), the low-frequency peaked BL Lac object BL Lacertae (Albert et al., 2007a), and even the flat-spectrum radio quasar 3C 279 (Albert et al., 2008) demonstrate the potential to extend the extragalactic TeV source list to all classes of blazars, in particular intermediate and low-frequency peaked BL Lac objects (LBLs) with lower peak frequencies in their broadband spectral energy distributions (SEDs).
3C 66A has been suggested for quite some time as a promising candidate for detection by the new generation of atmospheric Čerenkov telescope facilities like MAGIC or VERITAS (e.g. Costamante & Ghisellini, 2002) (it is too far north in the sky to be observed by HESS), and intensive observations of 3C 66A by the VERITAS collaboration have recently resulted in the significant detection of VHE -ray emission from 3C 66A in September – October 2008 (Swordy et al., 2008).
In the optical, 3C 66A is generally observed as a point source, with no indication of the host galaxy. The host galaxy of 3C 66A was marginally resolved by Wurtz, Stocke, & Yee (1996). They found for the host galaxy; the Hubble type could not be determined. In 3C 66A, a weak Mg II emission line has been detected by Miller, French, & Hawley (1978). This led to the determination of its redshift at , which was later confirmed by the detection of a weak Ly line in the IUE spectrum of 3C 66A (Lanzetta, Turnshek, & Sandoval, 1993). However, as recently pointed out by Bramel et al. (2005), these redshift determinations are actually still quite uncertain (see also Finke et al., 2008a). In this paper, we do base our analysis on a redshift value of , but remind the reader that some results of the physical interpretation should be considered as tentative pending a more solid redshift determination.
The long-term variability of 3C 66A at near-infrared (J, H, and K bands) and optical (U, B, V, R, I) wavelengths has recently been compiled and analyzed by Fan & Lin (1999) and Fan & Lin (2000), respectively. Variability at those wavelengths is typically characterized by variations over mag on time scales ranging from week to several years. A positive correlation between the B – R color (spectral hardness) and the R magnitude has been found by Vagnetti et al. (2003). The most recent multiwavelength campaign on 3C 66A in 2003 – 2004 (Böttcher et al., 2005) found hints for spectral hysteresis, with the B – R hardness peaking several days prior to the R- and B-band fluxes during large flares. That campaign also confirmed the results from an intensive long-monitoring effort by Takalo et al. (1996), revealing evidence for rapid microvariability, including a decline mag within hr. Lainela et al. (1999) also report a 65-day periodicity of the source in its optically bright state, which has so far not been confirmed in any other analysis. However, the campaign of Böttcher et al. (2005) showed several major outbursts separated by – 57 days, possibly also indicating a quasi-periodic behavior.
Superluminal motion of individual radio components of the jet has been detected by Jorstad et al. (2001). While the identification of radio knots across different observing epochs is not unique, Jorstad et al. (2001) favor an interpretation implying superluminal motions of up to , where km s-1 Mpc-1) parameterizes the Hubble constant. This would imply a lower limit on the bulk Lorentz factor of the radio emitting regions of . Theoretical modeling using a time-dependent leptonic jet model produced an acceptable fit to the SED and light curve of 3C 66A during the 2003 – 2004 campaign with such a choice of (Joshi & Böttcher, 2007).
In the fall of 2007, 3C 66A was found in a very active state, reaching a peak brightness around Sept. 14 of . This triggered a new optical – IR – radio observing campaign by the Whole Earth Blazar Telescope (WEBT222http://www.oato.inaf.it/blazars/webt/) collaboration with intensive monitoring throughout fall and winter 2007 – 2008. In this paper we present collected data from late July 2007 through early March 2008. This high optical state also triggered very-high-energy -ray observations with the VERITAS array. Continued observations by VERITAS throughout the observing season in 2008 resulted in the VHE -ray detection mentioned above (Swordy et al., 2008). Details of those observations will be published in a separate paper. In the following, we will present in §2 a summary of the observations and data analysis, and present light curves in the various frequency bands. In §3 we test for spectral variability to be derived from our results. Cross-correlations between the variability in different optical bands are presented in §4. We discuss our results and derive limits on the magnetic field and the Doppler factor in §5, and we summarize in §6.
Throughout this paper, we refer to as the energy spectral index, [Jy] . A cosmology with , , and km s-1 Mpc-1 is used. In this cosmology, and using the redshift of , the luminosity distance of 3C 66A is Gpc.
2 Observations, data reduction, and light curves
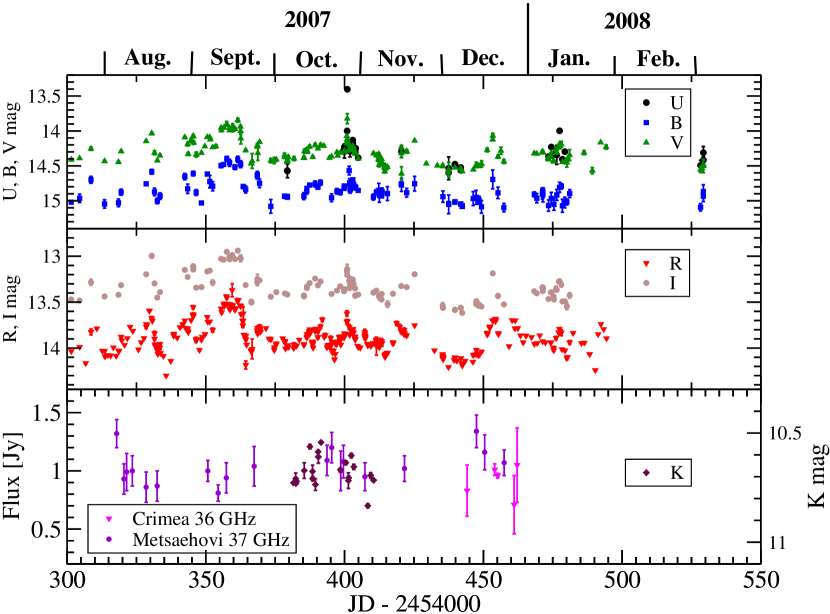
3C 66A was observed in a coordinated multiwavelength campaign at radio, near-IR, and optical frequencies by the WEBT collaboration during the 2007 – 2008 observing season, from late July 2007 through early March 2008. The object is being continuously monitored at radio to optical wavelengths by the GLAST-AGILE Support Program (GASP; see Villata et al., 2008), whose observers contributed also to this campaign. The overall timeline of the campaign, along with the measured long-term light curves at radio, infrared, and optical frequencies is illustrated in Fig. 1. Table 1 lists all participating observatories which contributed data to this campaign. In this section, we will describe the individual observations in the various frequency ranges and outline the data reduction and analysis.
| Observatory | Specifications | frequency / filters / energy range | |
|---|---|---|---|
| Radio Observatories | |||
| Crimean Radio Obs., Ukraine | 22 m | 36 GHz | 5 |
| Medicina, Italy | 32 m | 5, 8, 22 GHz | 19 |
| Metsähovi, Finland | 14 m | 37 GHz | 32 |
| Noto, Italy | 32 m | 43 GHz | 19 |
| UMRAO, Michigan, USA | 26 m | 4.8, 8, 14.5 GHz | 12 |
| Infrared Observatories | |||
| Campo Imperatore, Italy | 1.1 m | J, H, K | 72 |
| Optical Observatories | |||
| ARIES, Nainital, India | 104 cm | B, V, R, I | 15 |
| Armenzano, Italy | 35, 40 cm | B, V, R, I | 70 |
| Belogradchik, Bulgaria | 60 cm | V, R, I | 17 |
| Obs. de Bordeaux, France | 20 cm | V | 34 |
| Catania, Italy | 91 cm | U, B, V | 60 |
| Crimean Astr. Obs., Ukraine | 70 cm | B, V, R, I | 147 |
| Gualba Obs., Spain | 35 cm | V, R, I | 12 |
| Jakokoski Obs., Finland | 51 cm | R | 69 |
| Kitt Peak (MDM), Arizona, USA | 130 cm | U, B, V, R, I | 333 |
| L’Ampolla, Spain | 36 cm | R | 396 |
| Michael Adrian Obs., Germany | 120 cm | R | 180 |
| New Mexico Skies Obs., USA | 30 cm | V, R, I | 18 |
| Perugia, Italy | 40 cm | R | 25 |
| Roque (KVA), Canary Islands | 35 cm | R | 318 |
| Rozhen, Bulgaria | 200 cm | U, B, V, R, I | 139 |
| Sabadell, Spain | 50 cm | V, R | 464 |
| San Pedro Mártir, Mexico | 84 cm | R | 10 |
| St. Petersburg, Russia | 38 cm | B, V,. R, I | 50 |
| Torino, Italy | 105 cm | B, V, R, I | 77 |
| Tuorla, Finland | 103 cm | R | 19 |
| Valle d’Aosta, Italy | 81 cm | B, V, R, I | 53 |
| Xinglong, China | 60 cm | c, i, o | 699 |
2.1 Optical and infrared observations
In the optical component of the WEBT campaign, 22 observatories in 12 countries contributed 3461 individual photometric data points. The observing strategy and data analysis followed to a large extent the standard procedure used for the previous, successful WEBT campaign on 3C 66A in 2003 – 2004 (Böttcher et al., 2005). Observers were asked to perform bias (and, where necessary, dark) corrections as well as flat-fielding on their frames, and obtain instrumental magnitudes, applying either aperture photometry (using IRAF or CCDPHOT) or Gaussian fitting for the source 3C 66A and the comparison stars no. 13, 14, 21, and 23 in the tables of González-Pérez et al. (2001), where high-precision standard magnitudes for these stars have been published. This calibration has then been used to convert instrumental to standard photometric magnitudes for each data set. In the next step, unreliable data points (with large error bars at times when higher-quality data points were available) were discarded. Our data did not provide evidence for significant variability on sub-hour time scales. Consequently, error bars on individual data sets could be further reduced by re-binning on time scales of 20 min. Finally, there may be systematic offsets between different instruments and telescopes. Wherever our data sets contained sufficient independent measurements to clearly identify such offsets, individual data sets were corrected by applying appropriate correction factors. The resulting offsets, by which individual data sets have been corrected to create a uniform light curve, are listed in Tab. 2.
In order to provide information on the intrinsic broadband spectral shape (and, in particular, a reliable extraction of B - R color indices), the data were de-reddened. For this purpose, Galactic Extinction coefficients were calculated using Table 3 of Cardelli et al. (1989), based on mag333http://nedwww.ipac.caltech.edu/ and . As mentioned in the introduction, the R magnitude of the host galaxy of 3C 66A is mag, so its contribution is negligible compared to the average AGN magnitude of , and no host-galaxy correction was applied.
| Observatory | B | V | R | I |
|---|---|---|---|---|
| ARIES | +0.12 | - | - | - |
| Belogradchik | - | - | - | +0.03 |
| Rozhen | +0.06 | - | - | - |
| Torino | -0.12 | - | - | - |
| Valle d’Aosta | - | - | - | +0.035 |
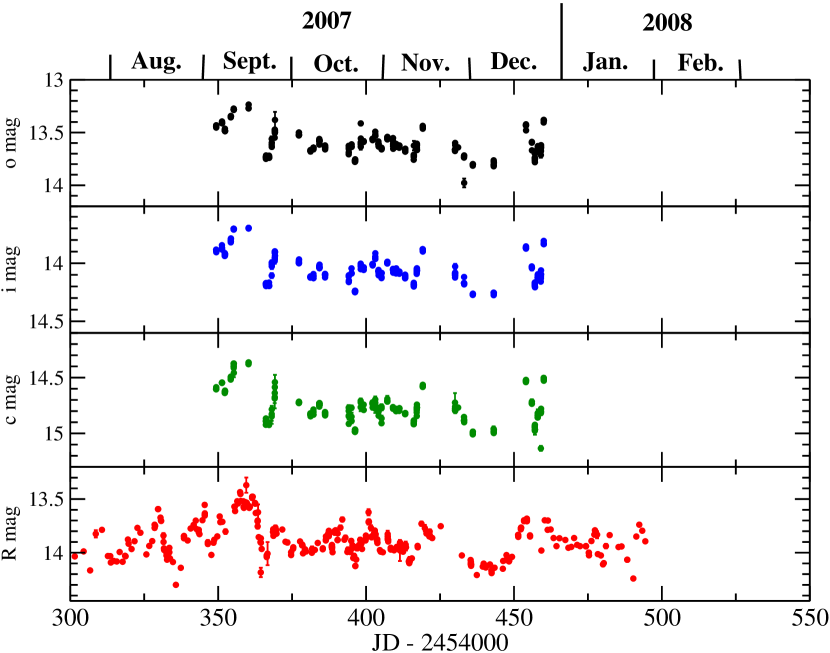
As a consequence of the chosen observing strategy, the R- and B-band light curves are the most densely sampled ones. The R-band light curve over the entire duration of the campaign is compared to the light curves at all other optical bands as well as the near-IR K-band and 36/37 GHz radio light curves in Figs. 1 and 2. These figures illustrate that the object remained in a very bright and active state, with an average magnitude of , throughout the campaign. The source exhibited several large flares with mag out to – , on characteristic time scales of days. The most dramatic outburst occurred around September 14, with a peak magnitude of . As already found in 2003 – 2004 (Böttcher et al., 2005), visual inspection of individual major outbursts suggests periods of more rapid decline than rise (see, e.g., Fig. 3).
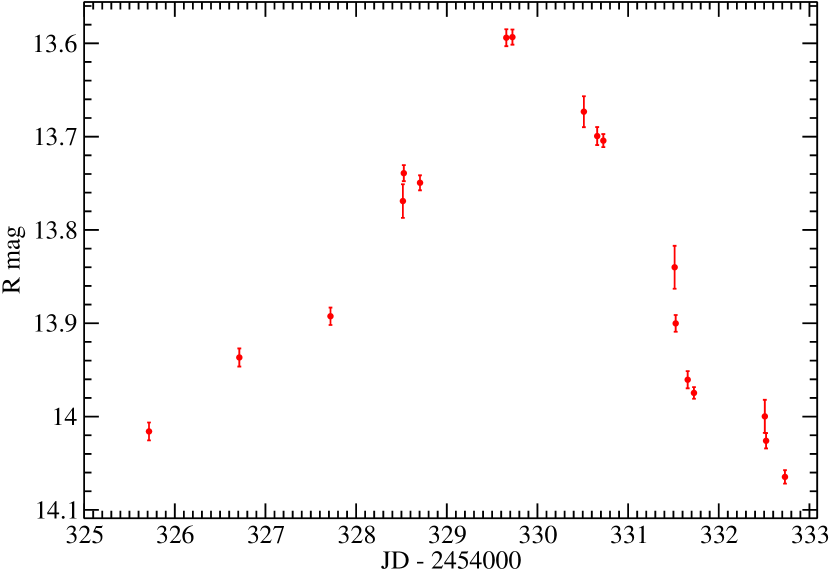
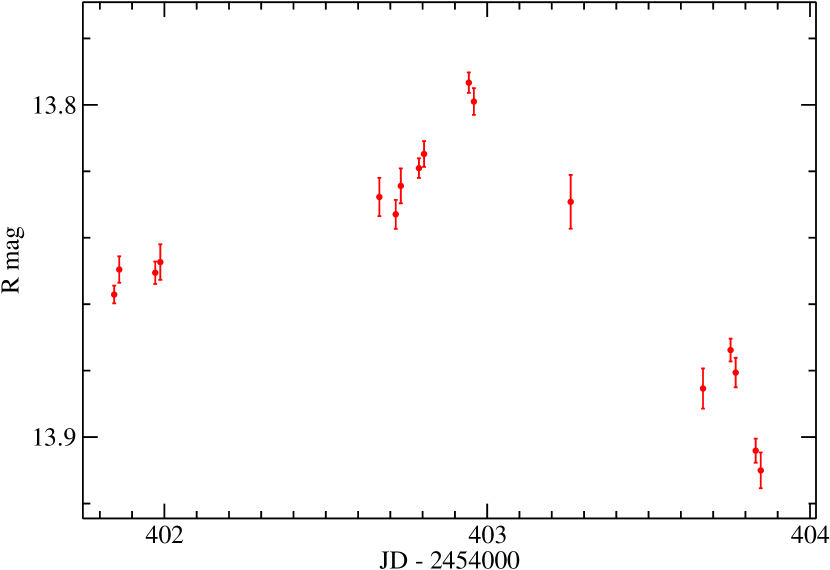
Our campaign revealed clear evidence for rapid intraday microvariability. Two examples are shown in Figures 3 and 4, revealing a rapid decline of the optical brightness by mag/hr on JD 2454331 (August 18, 2007), and a rapid rise by mag/hr on JD 2454402 (October 28, 2007). Our results do not provide any evidence for periodicity or quasi-periodicity. Overall, the variability patterns in all optical bands are very well correlated with no discernable time lag between bands (see §4).
In the context of our WEBT campaign, 3C 66A was also observed at near-infrared wavelengths in the J, H, and K bands with the AZT-24 1.1-m telescope at Campo Imperatore, Italy. The primary data were analyzed using the same standard technique as the optical data (see above), including flat-field subtraction, extraction of instrumental magnitudes, calibration against comparison stars to obtain standard magnitudes, and de-reddening. The sampling was not dense enough to allow an improvement of the data quality by re-binning. Also, the IR observations covered only a period of month so that we can not draw any conclusions concerning correlated variability with optical or radio fluxes.
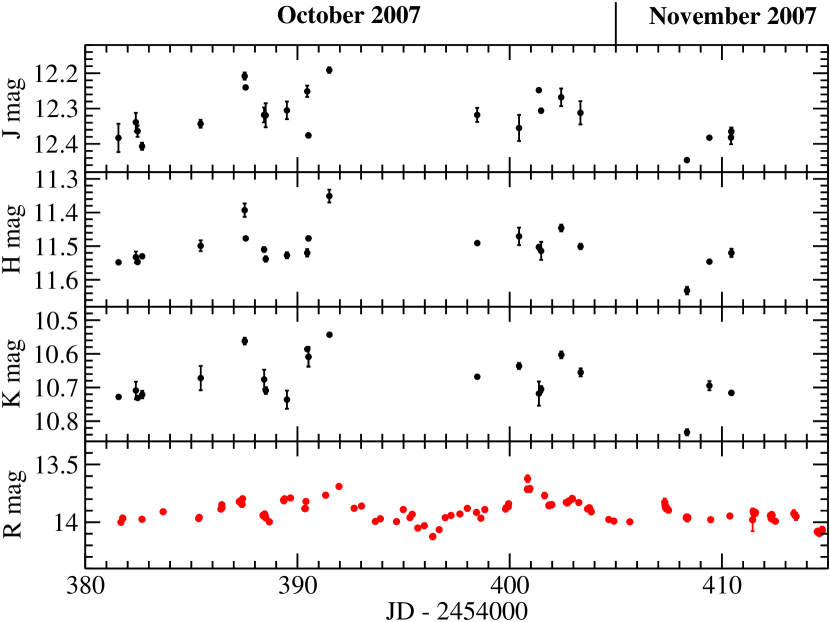
The resulting K-band light curve is included in Fig. 1, and a comparison of all three IR band light curves (J, H, K) is shown in Fig. 5. Within the limited time resolution and coverage, the JHK variability tracks the variability in the optical bands. For example, small BVRI flares on JD 2454387 and JD 2454391 – 2454392 are closely matched by the JHK light curves. The JHK light curves exhibit variability on similar time scales as the optical bands, but with somewhat smaller amplitudes of mag. Rapid variability with rise and decay rates of mag/day can be seen, in particular around JD 2454387 – 2454392.
2.2 Radio observations
At radio frequencies, the object was monitored using the Noto radio telescope at 43 GHz, the 22 m radio telescope (RT 22) of the Crimean Radio Observatory at 36 GHz, the University of Michigan Radio Astronomy Observatory (UMRAO) 26 m telescope, at 4.8, 8, and 14.5 GHz, the 14 m Metsähovi Radio Telescope of the Helsinki University of Technology, at 37 GHz, and the Medicina radio telescope at 5, 8, and 22 GHz.
The observations at 43 GHz have been performed using the 32-m radio telescope in Noto (Italy). The observations reported in this paper were carried out using the 43 GHz supereterodyne cooled receiver with a 400 MHz instantaneous band. For details of the data analysis and flux calibration, see Ott et al. (1994).
The observations at 36 GHz were carried out at the 22 m Crimean Astrophysical Observatory radio telescope (RT 22), using two similar Dicke switched radiometers. For details of the analysis and calibration of data from the RT 22, see Volvach (2006). At the UMRAO, the source was monitored in the course of the on-going long-term blazar monitoring program. The data were analyzed following the standard procedure described in Aller et al. (1985). As mentioned above, the sampling was rather poor, and some individual errors were rather large due to source confusion problems with 3C 66B.
The 37 GHz observations were made with the 13.7 m diameter Metsähovi radio telescope, which is a radome enclosed paraboloid antenna situated in Finland (24o 23’ 38”E, +60o 13’ 05”). The measurements were made with a 1 GHz-band dual beam receiver centered at 36.8 GHz. A detailed description on the data reduction and analysis is given in Teräsranta et al. (1998).
The radio data at 5, 8, and 22 GHz from the Medicina antenna were taken within a long-term monitoring program of gamma-ray bright blazars. For details on the analysis of data from the Medicina antenna see Bach et al. (2007).
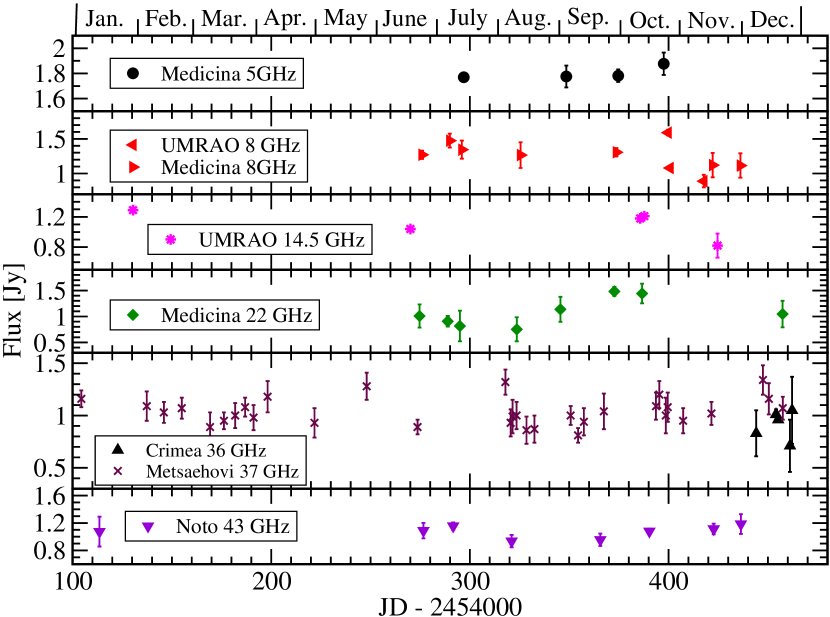
The 36 and 37 GHz light curves from the Crimean Astrophysical Observatory and Metsähovi, respectively, are included in Fig. 1 and in the compilation of all radio light curves throughout 2007 in Fig. 6. They reveal small-amplitude ( %) variability on time scales of – 20 days. The sampling is insufficient to allow any conclusions about possible correlations of the radio variability with optical or infrared variability.
The most dramatic radio variability appears to occur at the highest observed radio frequency of 43 GHz at the Noto radio observatory (see Fig. 6), possibly indicating erratic variability on a one-day time scale. However, we point out that the observed erratic variability at higher radio frequencies ( GHz) may, at least in part, be a consequence of interstellar scintillation (for a more detailed discussion of this aspect, see Böttcher et al., 2005).
3 Optical spectral variability
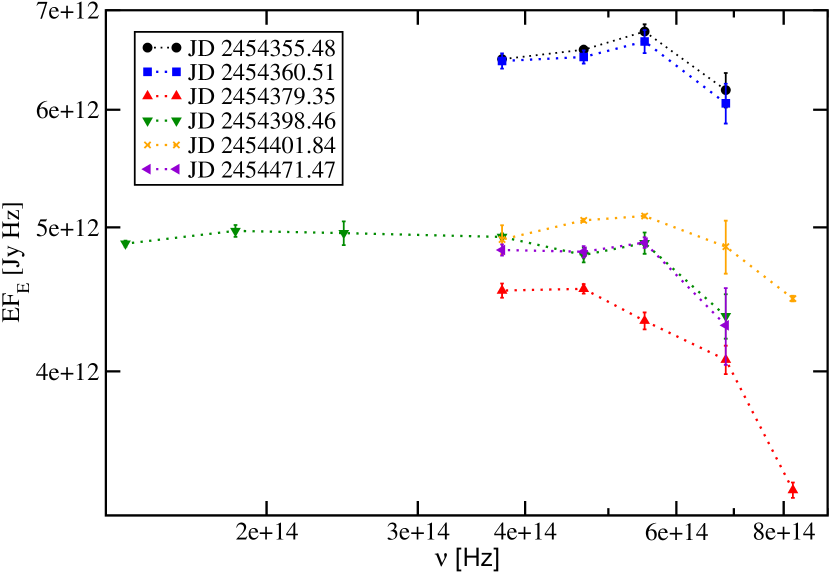
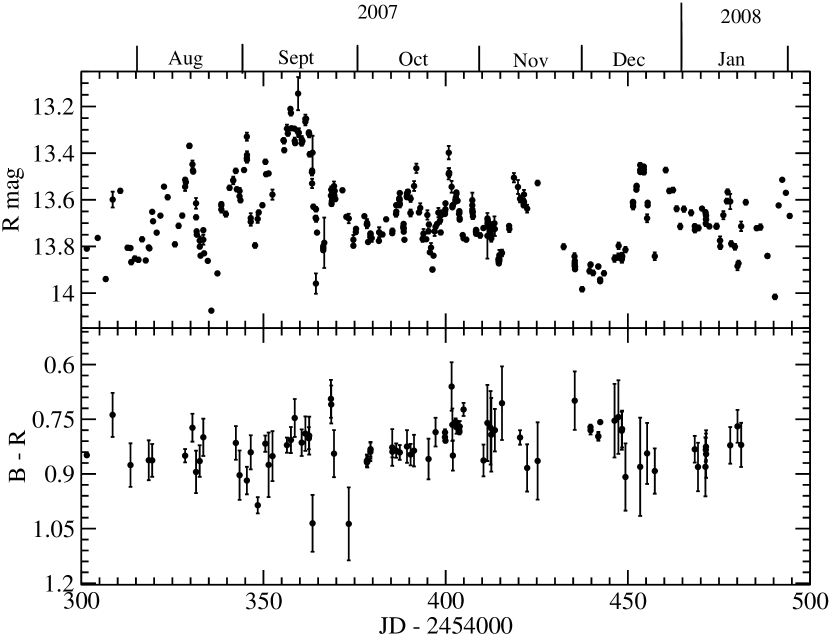
To investigate optical spectral variability observed during our campaign, we first computed snap-shot optical continuum spectra for several points in time throughout the campaign. A compilation of several such optical / near-IR sections of the SEDs are plotted in Fig. 7. As in our earlier campaign on 3C 66A (Böttcher et al., 2005), we find the (presumably) synchrotron peak of the SED in the optical regime, around (4 – 6) Hz. In order to investigate whether there is a systematic shift of the synchrotron peak with varying optical flux level, we calculated B - R color indices for any pair of B and R magnitude measurements taken within 20 minutes of each other. Fig. 8 shows the resulting plot of the B - R color index vs. time, together with the R band light curve. This figure does not confirm the hint in our compilation of snap-shot optical/IR SEDs of a correlation between the brightness and the hardness of the source during our campaign.
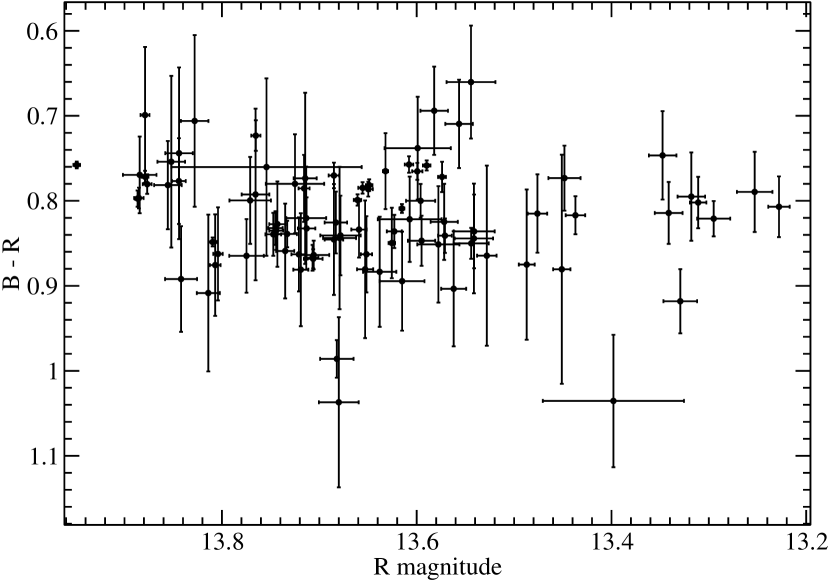
This is further illustrated in Fig. 9, showing the hardness-intensity diagram of B - R color index vs. R-band magnitude. No trend of B - R index with brightness can be found. In our previous campaign (Böttcher et al., 2005), we had found a weak positive correlation of hardness with flux for low flux states, (in agreement with the positive correlation identified by Vagnetti et al., 2003), but no correlation at brighter flux states. Similar results were also found for the low-frequency peaked BL Lac object BL Lacertae (Papadakis et al., 2007). Since during the entire 2007-2008 campaign the source remained in a bright state with , our results are in perfect agreement with our previous findings.
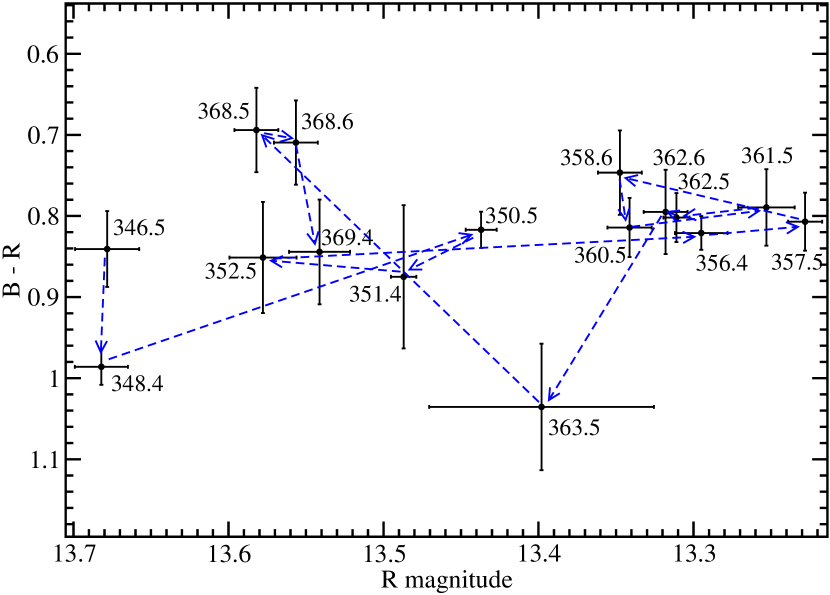
In Böttcher et al. (2005), we had also found hints of systematic spectral evolution during optical flares, with peaks of the B - R hardness occurring consistently a few days before peaks in the R-band light curve. Hardness – intensity diagrams of an individual flare showed a tentative hint of spectral hysteresis. During our 2007-2008 campaign, we did not find such indications. Fig. 10 shows the time-resolved hardness-intensity diagram and spectral evolution during the exceptionally bright outburst around Sept. 15, 2007 ( JD 2454348 – 2454370). The points are labeled by their respective JD, and the arrows indicate the time sequence. Our results do not confirm the existence of spectral hysteresis in 3C 66A.
4 Inter-band cross-correlations and time lags
Our spectral variability analysis in the previous section already indicated the lack of systematic spectral variability. This would be consistent with a tight correlation at zero time lag between different optical bands. We tested this hypothesis using the discrete correlation function (DCF, Edelson & Krolik, 1988).
| Band (vs. R) | B | V | I |
|---|---|---|---|
| 0.703 | 1.168 | 0.776 | |
| [d] | |||
| [d] | |||
| [d] |
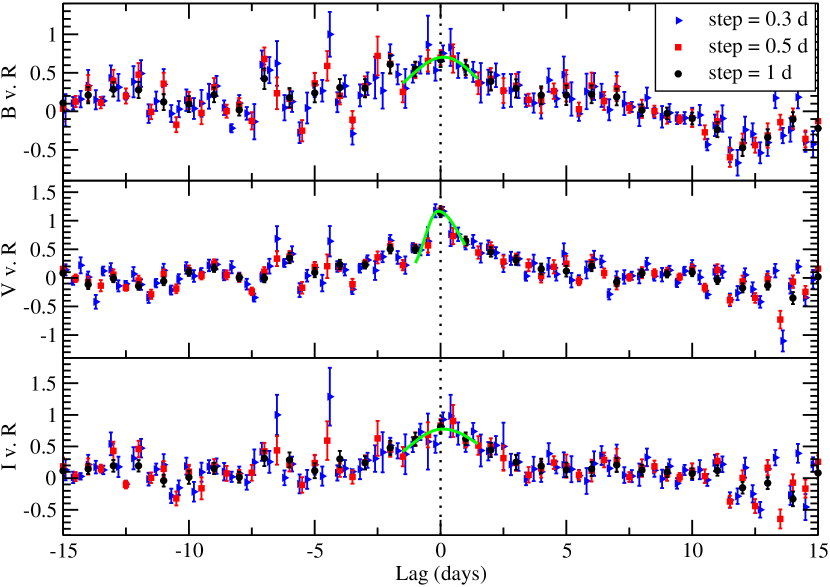
Fig. 11 shows a compilation of the DCFs of the B, V, and I bands with respect to R as a reference band. We calculated DCFs with various time lag bins and obtained consistent results, independent of our choice of the bin size. In order to test for possible time lags between the various light curves, we fitted the DCFs with an asymmetric Gaussian of the form
| (1) |
where is the peak value of the DCF, is the delay time scale at which the DCF peaks, and parametrize the Gaussian width of the DCF. The best-fit functions are plotted in Fig. 11, and the best-fit parameters are quoted in Tab. 3. These results confirm that there is no evidence for time lags among the optical bands in our campaign data. The rather low normalization of the resulting DCF fits of and in the B vs. R and I vs. R correlations might be a consequence of uneven sampling with several substantial data gaps in the B and I light curves (see Fig. 1).
5 Discussion
The location of the synchrotron peak in the optical regime allows an estimate of a combination of the magnetic field G and the Doppler factor . We follow the approach of Eq. (8) in Böttcher et al. (2003). Here, the magnetic field energy density is parametrized as a fraction of the energy density in relativistic leptons. Furthermore, constraining the size of the emission region by the observed variability time scale, hr, through , we find
| (2) |
where is the luminosity distance in units of cm, is the peak flux in units of ergs cm-2 s-1, and the dimensionless photon energy, , at the peak of the synchrotron component at Hz. is the spectral index of the nonthermal electron population radiating above the synchrotron peak. With these values, Eq. (2) yields
| (3) |
The lack of spectral variability may be interpreted as evidence that the synchrotron cooling time of electrons radiating in the optical regime is shorter than the light crossing time, which (including a factor ) then determines the shortest observed variability time scale. If this were not the case, frequency-dependent radiative cooling effects would be expected to lead to observable time lags and systematic spectral variability. Hence, the condition may be translated into a Doppler-factor dependent lower limit on the magnetic field. Regarding electrons emitting in the R band, we find
| (4) |
which yields the magnetic-field limit
| (5) |
Combining this limit with the magnetic-field estimate of Eq. (3), we infer an upper limit on the Doppler factor:
| (6) |
This restricts the Doppler factor to values typically found in the modeling of blazar-type quasars and low-frequency peaked BL Lac objects and excludes extreme values of , found in one-zone, leptonic synchrotron-self-Compton models for several high-frequency peaked BL Lac objects detected at TeV (e.g., Begelman et al., 2008; Ghisellini & Tavecchio, 2008; Finke et al., 2008b). This aspect is particularly exciting now, after the recent detection of 3C 66A at GeV energies by VERITAS (Swordy et al., 2008). The very high Doppler factors mentioned above are primarily required to accomodate the very rapid variability, on time scales down to just a few minutes, at GeV – TeV energies seen in a few HBLs. Should future VHE -ray observations of 3C 66A indicate such rapid variability for this object as well, this would pose serious problems for conventional blazar emission models.
6 Summary
We reported on an extensive optical, near-IR (JHK), and radio monitoring campaign by the WEBT throughout the fall and winter of 2007 – 2008, prompted by a high optical state in September 2007 with . Twenty-eight observatories in 12 countries in North America, Europe, and Asia contributed to this campaign.
The source remained in a high optical state throughout the observing period and exhibited several bright flares on time scales of days, including an exceptional outburst around September 15 – 20, 2007, reaching a peak brightness at . Our campaign revealed microvariability with flux changes up to mag/hr with occasional indications of a slower rise than decay of individual flares.
Our observations do not reveal evidence for systematic spectral variability in the overall high state () covered by our campaign, in agreement with previous results for the same overall brightness state. Note, however, that a positive correlation between optical spectral hardness (B - R color index) and optical flux at dereddened R-band magnitudes of has been found before. In particular, we do not find evidence for spectral hysteresis in 3C 66A for which hints were found in an earlier campaign in a somewhat lower flux state. On the same note, we did not find evidence for time lags between optical bands.
During our campaign, as in earlier campaigns, the peak of the low-frequency (presumably synchrotron) component of the SED of 3C 66A was located in the optical regime. From the observed synchrotron peak flux, we infer a value of the magnetic field of the emission region of G. From the lack of systematic spectral variability, a Doppler-factor dependent lower limit on the magnetic field can be derived, which implies an upper limit on the Doppler factor, . This excludes extreme values of the Doppler factor of , inferred for some high-frequency-peaked BL Lac objects detected at TeV energies.
References
- Acciari et al. (2008) Acciari, V. A., et al. (The VERITAS Collaboration), 2008, ApJL, in press (arXiv:0808.0889)
- Aharonian et al. (2007) Aharonian, F., et al., 2007, ApJ, 664, L71
- Albert et al. (2007a) Albert, J., et al., 2007a, ApJ, 666, L17
- Albert et al. (2007b) Albert, J., et al., 2007b, ApJ, 669, 862
- Albert et al. (2008) Albert, J., et al., 2008, Science, vol. 320, no. 5884, p. 1752
- Aller, Aller, & Hughes (1994) Aller, M. F., Aller, D. H., & Hughes, P. A., 1994, in “Workshop on Intensive Monitoring of OJ 287”, eds. Kidger, M. R., & Takalo, L. O., Tuorla Observatory Reports, 174, 60
- Aller et al. (1985) Aller, H. D., Aller, M. F., Latimer, G. E., & Hodge, P. E., 1985, ApJS, 59, 513
- Bach et al. (2007) Bach, U., et al., 2007, A&A, 464, 175
- Begelman et al. (2008) Begelman, M. C., Fabian, A. C., & Rees, M. J., 2008, MNRAS, 384, L19
- Böttcher et al. (2003) Böttcher, M., et al., 2003, ApJ, 596, 847
- Böttcher et al. (2005) Böttcher, M., et al., 2005, ApJ, 968, 977
- Böttcher (2007) Böttcher, M., 2007, ApSS, 309, 95
- Bramel et al. (2005) Bramel, D. A., et al., 2005, ApJ, 629, 108
- Cardelli et al. (1989) Cardelli, J. A., Clayton, C., & Mathis, J. S., 1989, ApJ, 345, 245
- Costamante & Ghisellini (2002) Costamante, L., & Ghisellini, G., 2002, A&A, 384, 384, 56
- Edelson & Krolik (1988) Edelson, R. A., & Krolik, J. H., 1988, ApJ, 333, 646
- Fan & Lin (1999) Fan, J. H., & Lin, R. G., 1999, ApJS, 121, 131
- Fan & Lin (2000) Fan, J. H., & Lin, R. G., 2000, ApJ, 537, 101
- Finke et al. (2008a) Finke, J. D., Shields, J. C., Böttcher, M., & Basu, S., 2008a, A&A, 477, 513
- Finke et al. (2008b) Finke, J. D., Dermer, C. D., & Böttcher, M., 2008b, ApJ, in press (arXiv:0802.1529)
- Ghisellini & Tavecchio (2008) Ghisellino, G., & Tavecchio, F., 2008, MNRAS, 386, L28
- González-Pérez et al. (2001) González-Pérez, J. N., Kidger, M. R., & Martín-Luis, F., 2001, AJ, 122, 2055
- Jorstad et al. (2001) Jorstad, S. G., Marscher, A. P., Mattox, J. R., Wehrle, A. E., Bloom, S. D., & Yurchenko, A. V., 2001, ApJS, 134, 181
- Joshi & Böttcher (2007) Joshi, M., & Böttcher, M., 2007, ApJ, 662, 884
- Lanzetta, Turnshek, & Sandoval (1993) Lanzetta, K. M., Turnshek, D. A., & Sandoval, J., 1993, ApJS, 84, 109
- Lainela et al. (1999) Lainela, M., et al., 1999, ApJ, 521, 561
- Miller, French, & Hawley (1978) Miller, J. S., French, H. B., & Hawley, S. A., 1978, in Pittsburgh Conference on BL Lac Objects, ed. A. M. Wolfe (Pittsburgh: Univ. Pittsburgh), p. 176
- Mücke & Protheroe (2001) Mücke, A., & Protheroe, R. J., 2001, Astropart. Phys., 15, 121
- Mücke et al. (2003) Mücke, A., Protheroe, R. J., Engel, R., Rachen, J. P., & Stanev, T., 2003, Astropart. Phys., 18, 593
- Ott et al. (1994) Ott, M., Witzel, A., Quirrenbach, A., Krichbaum, T. P., Standke, K. H., Schalinski, C. J., & Hummel, C. A., 1994, A&A, 284, 331
- Papadakis et al. (2007) Papadakis, I., et al., 2007, A&A, 470, 857
- Swordy et al. (2008) Swordy, S., et al., 2008, ATel # 1753
- Takalo et al. (1996) Takalo, L. O., et al., 1996, A&AS, 120, 313
- Teräsranta et al. (1998) Teräsranta, H., et al., 1998, A&AS, 132, 305
- Vagnetti et al. (2003) Vagnetti, F., Trevese, D., & Nesci, R., 2003, ApJ, 590, 123
- Villata et al. (2008) Villata, M., et al., 2008, A&A, 481, L79
- Volvach (2006) Volvach, A., E., ASP Conf. Ser., 360, 133
- Wills & Wills (1974) Wills, B. J., & Wills, D., 1974, ApJ, 190, L97
- Wurtz, Stocke, & Yee (1996) Wurtz, R., Stocke, J. T., & Yee, H. K. C., 1996, ApJS, 103, 109