Star Formation in the Ophiuchi Molecular Cloud
Abstract
A review of star formation in the Rho Ophiuchi molecular complex is presented, with particular emphasis on studies of the main cloud, L1688, since 1991. Recent photometric and parallax measurements of stars in the Upper Scorpius subgroup of the Sco-Cen OB association suggest a distance for the cloud between 120 and 140 parsecs. Star formation is ongoing in the dense cores of L1688 with a median age for young stellar objects of 0.3 Myr. The surface population appears to have a median age of 2-5 Myr and merges with low mass stars in the Upper Scorpius subgroup. Making use of the most recent X-ray and infrared photometric surveys and spectroscopic surveys of L1688, we compile a list of over 300 association members with counterparts in the 2MASS catalog. Membership criteria, such as lithium absorption, X-ray emission, and infrared excess, cover the full range of evolutionary states for young stellar objects. Spectral energy distributions are classified for many association members using infrared photometry obtained from the Spitzer Space Telescope.
Department of Physics and Astronomy, University of Missouri-St. Louis, 1 University Boulevard, St. Louis, MO 63121, USA
Department of Geology and Astronomy, West Chester University, West Chester, PA 19383, USA
Harvard-Smithsonian Center for Astrophysics, 60 Garden Street, MS42, Cambridge, MA 02138, USA
1. Introduction
The Ophiuchi cloud complex has been a target of intense studies in the past decade due to some unique features. First, it is one of the closest star-forming regions with a distance estimated to be about 130 pc (see Section 2) and it is available to observers in both the northern and southern hemispheres. This proximity makes even the low luminosity substellar objects in the region accessible to spectroscopy as well as imaging. Its large centrally condensed core, with gas column densities corresponding to Av = 50-100 mag, provides an effective screen against background stars and is an intermediate example of star-formation relative to the low mass stars and isolated dense cores in Taurus-Auriga clouds and rich stellar clusters and massive cores in the Orion Molecular Cloud.
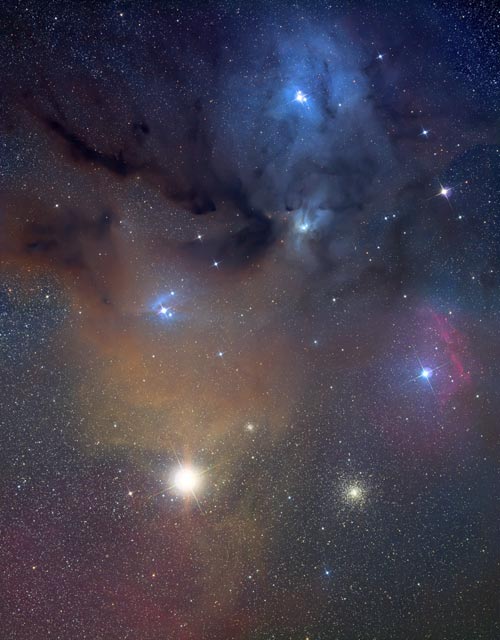
The basic structure of the cloud complex and its surroundings can be seen in the color image shown in Fig. 1. B stars in the Sco-Cen association, as well as the M supergiant Sco, illuminate the dust bordering the dark dust clouds. The B2V star HD 147889 lies on the western edge of the centrally condensed core and the main cloud L1688. Dark streamers trail to the northeast (L1709) and the southeast (L1689). The detailed extinction due to dust derived from star counts has been presented by Cambrésy (1999) and Lombardi, Lada, & Alves (2008) and the corresponding column density of molecular gas can be seen in the 13CO integrated intensity maps obtained for the COMPLETE Survey of Star-Forming Regions (see Fig. 2).

Since the last review of this cloud prepared in 1991 (Wilking 1991), there has been a wealth of new instruments and data available on the Ophiuchus region. At high energies, the ROSAT, Chandra, and XMM-Newton X-ray telescopes have surveyed this region, displaying a high sensitivity to young stellar objects (YSOs). Large aperture ground-based telescopes have opened the possibility for spectroscopic studies of very low mass and substellar objects. Ground-based near-infrared camera surveys by various groups and 2MASS have given us for the first time a complete sample of sources over a large area. With the repair of the NICMOS camera on the Hubble Space Telescope, deep near-infrared imaging from space has been possible. The space-based infrared telescopes, the Infrared Space Observatory and the Spitzer Space Telescope, have surveyed the cloud, sensitive to warm dust surrounding YSOs. And finally array receivers on millimeter-wave telescopes have made large scale surveys of dense gas and dust possible.
In this chapter the main focus is a review of these new data sets and the basic results that have advanced our knowledge of this star-forming region since 1991 through 2007. The review concentrates on the main cloud, L1688. In Section 2, we review the relationship of L1688 to the Sco-Cen OB association and distance estimates to the Oph cloud. Recent molecular-line and millimeter continuum observations that have revealed the clumpy structure of the cloud are discussed in Section 3. In Section 4, we review observations covering the entire electromagnetic spectrum that have enabled the identification of many new YSOs in the cloud. We present a table of over 300 YSOs associated with the cloud, along with their positions and infrared magnitudes from the 2MASS survey. In addition, we present a table of the most heavily obscured YSOs, some too faint to be detected at near-infrared wavelengths, and a table of candidate young brown dwarfs. In Section 5, we briefly discuss outflow activity in the cloud. Finally, we review star formation in the lower density streamers of the Oph cloud complex in Section 6.
2. Relationship with Sco-Cen and Distance to L1688
The idea that star formation in the L1688 cloud was triggered by compression from the Sco-Cen OB association has a long history (Vrba 1977; Loren & Wootten 1986). Both cloud morphology and cloud chemistry has been cited as evidence. de Geus (1992) has identified HI loops surrounding the Sco-Cen subgroups. He proposes that a slow shock has been produced by an interaction between the expanding shell from the Upper Scorpius subgroup and ambient gas from the L1688 cloud. The formation of this shell requires a supernova event 1 to 1.5 Myr ago; the runaway star Oph is proposed to be the binary companion to the supernova (Blaauw 1961). This scenario is consistent with the compression of the L1688 core and median age of 0.3 Myr for YSOs in the core (Greene & Meyer 1995; Luhman & Rieke 1999). Further evidence for the triggering by Upper Scorpius comes from the alignment of Class I protostars perpendicular to the proposed direction of shock propagation (Motte, André, & Neri 1998).
However, spectroscopic studies of YSOs from a broader region (1 deg2) surrounding the L1688 cloud suggests a population of YSOs that predates the arrival of this slow shock. Spectroscopic studies by Bouvier & Appenzeller (1992), Martín et al. (1998), and Wilking et al. (2005) have characterized a population of 100 YSOs that lie at the periphery of the L1688 cloud with a median age of 2 Myr. Wilking et al. point out that an H-R diagram of these objects is indistinguishable from that of low mass stars in the Upper Scorpius subgroup presented by Preibisch et al. (2002 and references therein). Therefore, it is proposed that the formation of this surface population of stars surrounding the L1688 core was contemporaneous with low mass stars in the Upper Scorpius subgroup in a once larger L1688 cloud. The age for this earlier episode of star formation ranges from 2-5 Myr ago, depending on the correction for unresolved binaries. The trigger for this event, and the formation of the Upper Scorpius subgroup, was presumably the passage of an expanding shell from the Upper Centaurus-Lupus OB subgroup. This sequence of events is consistent with the similar velocities derived for young stars associated with Oph and Upper Sco (Mamajek 2008).
The distance to the Ophiuchi molecular complex has undergone some revision in the past decade from the canonical value of 160 pc (Bertiau 1958; Whittet 1974). The change has been due in large part to the Hipparcos Space Astrometry Mission and accurate parallax values for stars in the Upper Scorpius subgroup. Yet due to the high visual extinction from the cloud, there are few bright stars known to be associated with the cloud with well-determined parallaxes. Based on ground-based photometry, de Geus, de Zeeuw, & Lub (1989) derived extinctions and absolute magnitudes for stars in the Upper Scorpius subgroup. From a plot of the extinction vs. distance modulus, they defined the front edge of the cloud at 80 pc and the far edge at 170 pc. This yielded an estimate of 125 25 pc for the cloud center. de Zeeuw et al. (1999) used Hipparcos proper motions and parallaxes to define a group of 120 association members in the Upper Scorpius subgroup over an area of 20∘x 20∘. The mean distance derived for this group was 145 2 pc.
de Geus (1992) has noted that there are gaps in the HI emission that forms an expanding shell originating from the Upper Scorpius subgroup and that these gaps correspond to CO emission from the Oph cloud. He proposed that the molecular cloud sits in front of the HI shell. This would imply a distance to the cloud closer than the mean distance to Upper Scorpius. Using the Hipparcos catalog trigonometric parallaxes, Knude & Høg (1998) compiled color excesses and distances derived from the parallaxes for O-M stars within 6 degrees of the cloud. They found an extinction jump at 120 pc and suggested an upper limit of 150 pc to the cloud. Mamajek (2008) has estimated a distance of 1313 pc from a sample of seven association members within 5∘ of L1688. Makarov (2007) used astrometric proper motions for 58 probable association members over the same region to derive a distance of 145 pc using the convergent point method. Guided by an extinction map derived from 2MASS, Lombardi, Lada, & Alves (2008) used Hipparcos and Tycho parallaxes combined with a maximum likelihood analysis to obtain a distance of 119 6 pc. These estimates include the star HD 147889 (13626 pc) which appears to sit just behind the western edge of the molecular cloud (Liseau et al. 1999). Most recently, Loinard et al. (2008) have used VLBI astrometry of two association members with strong radio emission to derive a distance of 120.0 pc (+4.5 pc, 4.2 pc) for the northern L1688 core, however, the same technique yields greater distances for sources in the eastern core. Clearly, the L1688 cloud exists over a range of distances, most likely between 120 pc and 145 pc. For this review, we adopt a distance of 130 pc to L1688.
3. Molecular Gas and Dust and Cloud Energetics
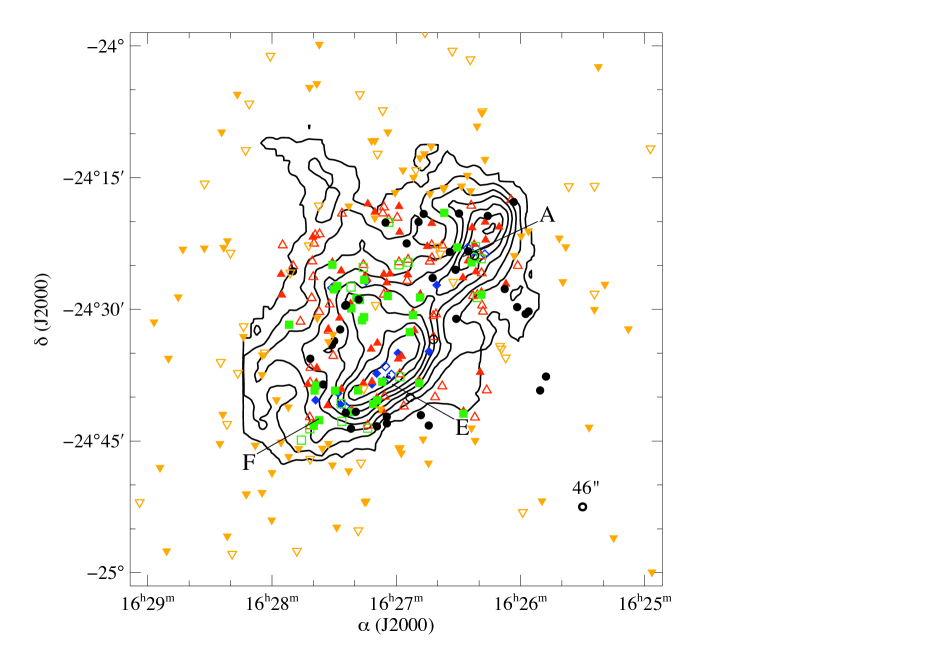
The large scale structure of the Oph molecular complex had been established pre-1990 by extensive molecular line maps in 13CO with spatial resolutions of 2.4′ (Loren 1989a, b) or 2.7′ (Mizuno et al. 1989, as quoted in Nozawa et al. 1991). More recently, high resolution (18′′) observations of C18O in the L1688 core have been presented by Umemoto et al. (2002). A map of the C18O column density obtained at FCRAO with 46′′ resolution is shown in Fig. 3 (Li 2005, priv. communication). These collective data show a filamentary structure with gas column densities in the core trending along a northwest-southeast axis and in the streamers along a perpendicular direction.
The large scale energetics of the cloud have been studied in greater detail at far-infrared and submillimeter wavelengths with the Infrared Space Observatory (ISO) and ground-based telescopes. Far-infrared images by ISO confirm that the heating of dust is dominated by B stars in the cloud (SR 3 and Oph Source 1) and by the B2V star HD 147889 which lies at the western edge of the cloud (Abergel et al. 1996). Extended emission in the band centered on 6.7 m appears to be dominated by small grains and polycyclic aromatic hydrocarbons. A bright filament of far-infrared emission corresponds to the western edge of the dense molecular core and spectrophotometry with ISO of [CII] and [OI] lines show that this delineates an “edge-on” photodissociation region (PDR) associated with HD 147889 (Liseau et al. 1999; Kulesa et al. 2005). Mapping of the [CI] and [CII] lines show that they primarily trace emission from the lower density envelopes of molecular cores which are illuminated from the far side of the cloud (Kamegai et al. 2003; Kulesa et al. 2005). This emission mimics the column density distribution of the molecular gas and is modeled with temperatures of 50-200 K surrounding gas with temperatures of 20K (Kulesa et al. 2005).
In the past decade, observations have focused more on the clumpy structure of the densest gas and dust in the L1688 cloud using millimeter and submillimeter continuum, and molecular-line observations. Continuum mapping at = 3 mm, 1 mm, 850 m, 800 m, 450 m, and 350 m have revealed the clumpy structure in Oph core A whose location is shown in Fig. 3 (Ward-Thompson et al. 1989; André, Ward-Thompson, & Barsony 1993; Wilson et al. 1999; Di Francesco, André, & Myers 2004). This structure includes three cold cores, dubbed SM 1, SM 1N, and SM 2, which appear to be prestellar cores each containing 0.5 M as well as filaments and arcs which are likely related to outflows or PDRs. Higher resolution interferometric mm continuum observations show that these features contain sub-structures (see Kamazaki et al. 2001). More recently, wide field surveys have revealed the clumpy structure in L1688 at angular resolutions of 11′′, 14′′, 24′′, and 31′′, respectively (Motte, André, & Neri 1998; Johnstone et al. 2000; Smith et al. 2005; Young et al. 2006). These studies have identified about 55 starless cores in the range of 0.02-6.3 M which comprise only a few percent of the total cloud mass. The clump mass spectrum, dN/dM M-α, displays a slope of 1.5 for clumps with M0.5 M and a shallower slope of =0.5 for lower mass clumps. This mass spectrum resembles the stellar initial mass function and it is suggested that if each of the cores collapsed into individual stars, they could produce an initial mass function. The observed mass spectrum implies that turbulent fragmentation at the prestellar stage plays a dominant role in its production (see Padoan & Nordlund 2002). This has been confirmed through N2H+ observations which show that most of the clumps are gravitationally bound and that the small velocity dispersion of the clumps implies insufficient time for clump interactions prior to star formation (André et al. 2007).
4. Young Stellar and Substellar Objects
A list of association members in the L1688 cloud known up to January 2008
is presented in Table 1
which is available in Excel or IDL format.111Table 1 is available at either ftp://astro.wcupa.edu/pub/mgagne/roph or
http://www.umsl.edu/wilkingb/handbook/handbook.html
or by request to the authors.
The area considered is a 0.94∘ 1.2∘ box centered at
RA(2000) = 16h 27m 385, DEC(2000) = 24∘29′34′′.
All of the objects listed in Table 1 appear in the 2MASS catalog with,
at minimum, detections in the Ks band. In addition to their positions and
J, H, and Ks magnitudes from the 2MASS catalog (col. 1-13), we list
source names from selected surveys (see Appendix A).
Association membership was based on various criteria which are listed in the second to last
column; the more criteria that a source satisfies, the more secure its
identification as a member. X-ray emission (indicated by “x” in Table 1)
is observed from young stellar objects in all evolutionary states (see Section 4.1).
While it is known to be observed from some main-sequence objects such
as dMe stars, the density of such objects over this region is
estimated to be low (Gagné et al. 2004).
YSOs observed spectroscopically (Section 4.3) could be identified by the presence of
strong H emission, EW 10 Å (“ha”), lithium absorption (“li”),
or location above the main sequence in the Hertzsprung-Russell diagram
(“ext”; see Wilking et al. 2005). Excess infrared emission is indicative
of a circumstellar disk and association membership (see Section 4.2). Infrared excesses have
been established by combining near-infrared photometry with mid-infrared
photometry from ISO (“IRX”, Bontemps et al. 2001; Comerón et al. 1998)
or Spitzer (B2ex, B4ex, or Mex). Objects displaying an infrared excess in an (HKs) vs
(Ks4.5 m) diagram by being displaced by at least 2 from
the reddening line of an M9 V star are indicated by “B2ex”
(IRAC Band 2 excess). Objects whose IRAC colors (3.64.5 m vs.
5.88.0 m) fall in the regime of Class I or Class II sources
(Allen et al. 2004) are indicated by “B4ex” (IRAC Band 4 excess). Sources with
spectral indices from 3.6 m to 24 m greater than 1.6 are noted by
“Mex” (MIPS excess). Near-infrared variability is not listed as one of the criteria for association
but a recent study suggests additional association members may be identified through this
technique (Alves de Oliveira & Casali 2008). Also noted in Table 1 is the classification of the spectral energy
distribution (SED) from either the placement in the
IRAC color-color diagram (1, F, 2) or the
3.6 m to 24 m spectral index (I, F, II).
The remaining objects have mainly Class III SEDs.
The distribution of association members listed in Table 1 is shown in Fig. 3 relative to contours of C18O column density (Li 2005, priv. communication).
4.1. X-ray Surveys
The L1688 cloud was among the first regions imaged in X-rays by the Einstein X-ray Observatory. Montmerle et al. (1983) discovered 70 highly variable X-ray sources in a field centered on Oph core A. In the X-ray surveys since with the ROSAT, ASCA, XMM and Chandra satellites, hundreds of X-ray sources have been associated with Class I-III YSOs. Although YSOs emit less than 1% of their bolometric luminosity in the 0.1-10 keV soft X-ray band, X-ray surveys are a good way to identify cloud members because the X-ray to bolometric luminosity ratio of YSOs is much higher than most foreground and background field stars. The absorption cross sections of H I, He I and He II decrease rapidly with increasing energy so that X-rays in the 2-10 keV band can often be detected through mag of extinction.
Montmerle et al. (1983) found that the YSOs in Oph were continously flaring, producing an X-ray “Christmas Tree”. The X-ray spectra of YSOs show optically-thin thermal emission (a bremsstrahlung continuum with bright emission of highly ionized metals). Most YSOs in L1688 have very hard, time variable X-ray spectra ( keV) which suggest magnetic heating of magnetically confined plasma. The extent and geometry of these magnetic structures and the mechanisms that trigger flares and magnetic heating are still under discussion. Modeling of X-ray flares on Class I-III YSOs in Oph (Imanishi et al. 2003) suggest large magnetic loops () and moderate magnetic field strengths of 200-500 G. Variability in fluorescent Fe 6.4 keV emission from the Class I YSO Elias 29 has been interpreted as a magnetically confined accretion loop extending from the star to the circumstellar disk (Favata et al. 2005; Giardino et al. 2007). The presence of large magnetic structures have also been suggested from VLBI observations of Oph Source 1, DoAr 21 (GSS 23), and several lower mass Class III YSOs (André et al. 1991; Phillips, Lonsdale, & Feigelson 1991; André et al. 1992).
In this chapter we consider cloud members in a one square degree region including the dense cores of L1688. We note that many of the cloud members in this region have been detected with Einstein, ROSAT (see Casanova et al. 1995; Martín et al. 1998; Grosso et al. 2000) and ASCA (see Kamata et al. 1997). However, we focus on the more sensitive, higher spatial resolution Chandra and XMM surveys of cores A, E, and F by Imanishi et al. (2001), Gagné et al. (2004), and Ozawa, Grosso, & Montmerle (2005). We also examine surveys of the outer regions for sources detected with Chandra (N. Grosso 2005, private communication) or in the XMM DROXO survey (Sciortino et al. 2006).
Of the 316 candidate YSOs listed in Table 1, 201 have been detected in X-rays. In cores A, E and F, where deep Chandra observations have detected 90% of candidate YSOs, the limiting X-ray luminosity is . The resulting X-ray luminosity function (XLF) for Class II and Class III sources using the corrected distance of 130 pc is very similar to the XLF in the Orion Nebula Cluster (Feigelson et al. 2005). Assuming the Orion sample is complete and that the XLF is universal (Feigelson et al. 2005), this result suggests that our census of Class II and Class III objects in L1688 cores A, E, and F is essentially complete. In the outer regions of the cloud, the X-ray detection fraction is lower, though the XLF accounts for non-detections by using the Kaplan-Meier estimator. The XLF in these outer regions is statistically similar to the XLF in cores A, E and F, suggesting that the candidate list (including X-ray non-detections) is relatively complete.
4.2. Near-Infrared Surveys and Multiplicity
Prior to 1992, most near-infrared surveys were conducted by scanning a single detector across the dark cloud and were limited in sensitivity and spatial resolution. Nevertheless, pioneering surveys by Grasdalen, Strom, & Strom (1973); Vrba et al. (1975); Elias (1978) and Wilking & Lada (1983) revealed large numbers bright infrared sources in L1688 and multi-wavelength infrared studies established infrared excesses for many of these sources (Elias 1978; Lada & Wilking 1984; Wilking, Lada, & Young 1989). Infrared arrays have revolutionized our view of star formation in nearby clouds and L1688 is no exception. In 1992, wide-field imaging surveys at J, H, and K began to be published and gave us our first clear picture of the distribution of YSOs across the cloud. Some of the larger surveys are summarized below. All of these were precursors to the all-sky 2MASS survey which had a sensitivity at K of 14 mag (Cutri et al. 2003).
| JHK Survey | Instrument | Sensitivity | Coverage |
|---|---|---|---|
| Greene & Young (1992) | UA NICMOS2 | K13 mag | 650 arcmin2 |
| Comerón et al. (1993) | UA NICMOS2 | K15.5 mag | 200 arcmin2 |
| Strom, Kepner, & Strom (1995) | SQIID | K mag | 1225 arcmin2 |
| Barsony et al. (1997) | SQIID | K14 mag | 3660 arcmin2 |
| Allen et al. (2002) | HST NICMOS3 | H21.5 mag | 72 arcmin2 |
One task of the wide-field surveys was to distinguish between association members and background stars from JHK photometry alone. Contamination of background stars could be minimized if the surveys focused on the regions with the highest gas column densities (see Comerón et al. 1993; Allen et al. 2002). Using a color-color diagram, the near-infrared photometry could be plotted to look for infrared excesses at K due to warm dust from the inner regions of a circumstellar disk and hence not only identify a YSO but infer its evolutionary state. A drawback of this technique is that it only detects YSOs with inner disks and selects against weak-emission T Tauri stars (WTTS) and very low mass objects. High resolution images have identifed YSOs by resolving dust structures around objects (Allen et al. 2002). The more extensive photometric studies have been used to derive a luminosity function and infer a mass function for L1688 under the assumption of a common age and using a set of evolutionary models (Comerón et al. 1993; Strom, Kepner, & Strom 1995). They have found that the mass function is relatively flat below 1 M, a result confirmed through spectroscopic studies.
In addition to wide-field surveys, infrared and Gunn z surveys of individual sources have been performed to evaluate the binary frequency in L1688. Techniques used include direct imaging (Reipurth & Zinnecker 1993; Simon et al. 1995; Brandner et al. 1996; Ressler & Barsony 2001; Haisch et al. 2002; Duchêne et al. 2004; Haisch et al. 2004), speckle imaging (Ghez, Neugebauer, & Matthews 1993; Barsony, Koresko, & Matthews 2003; Ratzka, Köhler, & Leinert 2005), lunar occultations (Simon et al. 1987; Richichi et al. 1994; Simon et al. 1995), and adaptive optics (Ratzka, Köhler, & Leinert 2005; Duchêne et al. 2007). YSOs which have companions within 10′′ are noted in the last column of Table 1 provided the companions do not appear as separate entries. The first studies focused on samples of WTTSs and classical T Tauri stars (CTTSs) and suggested an overabundance of multiple systems in the Ophiuchus complex compared to the main-sequence. More recent studies with larger samples find the degree of multiplicity only marginally higher than that of main-sequence stars (Ratzka et al. 2005, see also Simon et al. 1995 and Haisch et al. 2002). There are suggestions that the degree of multiplicity drops with age when comparing Class I protostars and flat-spectrum sources to main sequence stars (Duchêne et al. 2004) and CTTSs to WTTSs (Ratzka, Köhler, & Leinert 2005).
4.3. Spectroscopic Studies of YSOs and Brown Dwarfs
In the previous review (Wilking 1991), H objective prism surveys were the main source of spectroscopic information used to identify YSOs in the Ophiuchus region (e.g., Dolidze & Arakelyan 1959; Wilking, Schwartz, & Blackwell 1987). Optical spectroscopy was available for a handful of CTTSs, mainly the brightest sources with spectral types of K through early M (Struve & Rudkjøbing 1949; Cohen & Kuhi 1979; Rydgren 1980). Comparisons of L1688 with other star-forming regions showed a relative deficiency of mid-to-late M CTTSs in L1688 (see Fig. 24 in Hillenbrand 1997); this was clearly a selection effect due to the high visual extinction in the cloud. In the past decade, it has become possible to investigate large numbers of young stars in the Ophiuchus region with high resolution and/or multi-object spectroscopy at both visible and near-infrared wavelengths. These studies can identify young stars through the presence of hydrogen emission lines or CO rovibrational lines, or absorption by lithium. Moreover, absorption lines from species such as CaH, Na I, and Ca II can serve as surface gravity indicators. Spectral classifications allow one to estimate effective temperatures and, when compared with estimates of source luminosities and theoretical tracks and isochrones, the masses and ages of YSOs. Surface gravities derived from the spectra are also useful in determining stellar ages.
Optical Spectroscopy
Currently, over 120 association members have been assigned spectral types using optical spectroscopy (see Table 1). However while optical spectra provide the most reliable indicators of spectral type, they can only be obtained for low mass objects with little or no visual extinction. Bouvier & Appenzeller (1992) obtained spectral types for 30 X-ray sources in and around the L1688 cloud and found most were weak-emission T Tauri stars with ages ranging from 1 to 10 Myr. Martín et al. (1998) acquired optical spectral types for 59 X-ray sources observed over the entire Ophiuchus complex. They found the majority of objects classified were pre-main sequence (PMS) M stars, with evidence for older PMS stars outside of the L1688 cloud. Most recently, Wilking et al. (2005) used a multi-object spectrograph to obtain spectra for 139 objects within a 1.3 deg2 area surrounding L1688. A total of 88 association members were identified with a large percentage possessing M spectral types. The median age for this sample is identical to that of low mass stars in the Upper Scorpius subgroup and significantly older than those in the L1688 core.
Near-Infrared Spectroscopy
Because of the high visual extinction of objects in the L1688 core, significant progress in the spectral classifications of association members has been made at infrared wavelengths. To date, over 90 association members have infrared spectral classifications with only 30 of these having optical spectral classifications (see Table 1). Casali & Matthews (1992) presented low resolution K band spectra for 10 low-luminosity YSOs and showed that those with Class II SEDs displayed 12CO absorption bands. Greene & Lada (1996) presented moderate resolution 1.1-2.4 m spectra for a flux-limited sample (K10.5 mag) of 53 YSOs in the L1688 cloud and showed there was a relationship between the infrared SED and the measured veiling in the K band. Greene & Meyer (1995) presented spectral types for 34 of these YSOs, mainly those with Class II SEDs. Luhman & Rieke (1999) conducted a deeper moderate-resolution spectroscopic survey (K12 mag) in the K band for 100 objects in L1688. Using the models of D’Antona & Mazzitelli (1997), a median age for YSOs in the L1688 core derived by these studies is 0.3 Myr. Luhman & Rieke used these data to construct an Initial Mass Function (IMF) for the L1688 core from 36 sources plus a completeness correction for the lowest mass objects. They found that for M 0.4 M, the IMF was consistent with that of Miller & Scalo (1979). The IMF appears flat between 0.02 and 0.4 M which agrees with previous IR photometric and spectroscopic modeling (Comerón et al. 1993; Strom, Kepner, & Strom 1995; Williams et al. 1995) and with other young clusters such as IC 348 and the Pleiades.
Using the SED class defined by ISO observations, Natta, Testi, & Randich (2006) obtained J and K band spectra for 104 Class II objects with the goal of using the hydrogen emission lines to estimate the accretion rate. They have detected emission in 50% of the sample and find that accretion rate is strongly correlated with the mass of the central object, although there is a large spread in accretion rates observed for a given mass. There is no significant difference in this relationship when objects in Ophiuchus are compared with those in Taurus for M 0.1 M.
Due to veiling, infrared echelle spectroscopy is required to resolve photospheric absorption lines, particularly in the most deeply embedded YSOs. In addition to enabling spectral classification, observations of flat-spectrum and Class I protostars have confirmed the higher degree of veiling (and presumably accretion rate) compared to CTTSs in L1688 (Greene & Lada 1997, 2000, 2002; Doppmann, Jaffe, & White 2003; Doppmann et al. 2005). Stellar properties have been determined for 16 highly veiled flat-spectrum or Class I protostars in the L1688 core (Doppmann et al. 2005). High resolution spectra have also shown that the more deeply embedded sources rotate faster (and have higher angular momenta) compared to CTTSs (Covey et al. 2005).
Spectroscopy of Brown Dwarf Candidates
The proximity of the Ophiuchus complex and the enhanced luminosities of pre-main sequence objects has made L1688 an ideal laboratory for the study of young brown dwarfs. Given the median age of YSOs in the L1688 core, models suggest that objects with spectral types of M6 or later are likely to be brown dwarfs. Candidates were initially identified through deep infrared imaging of the core (Rieke & Rieke 1990; Comerón et al. 1993). As shown in Table 3, confirmation of 20 objects as likely brown dwarfs has been made through low to moderate resolution spectroscopy. Three young brown dwarf candidates with spectral types of M8-M8.5 have been identified with optical spectroscopy (CRBR 46, GY 3, and GY 264; Luhman, Liebert, & Rieke 1997; Wilking et al. 2005) as well as three near the hydrogen-burning limit (GY 5, GY 37, and GY 204; Wilking, Greene, & Meyer 1999; Wilking et al. 2005). The remaining candidates have been observed using infrared spectroscopy (Williams et al. 1995; Wilking, Greene, & Meyer 1999; Cushing, Tokunaga, & Kobayashi 2000; Natta et al. 2002). Spectral classifications have been accomplished through comparisons of the depths of the water vapor and other absorption bands with those of dwarf standard stars and with low surface gravity synthetic spectra. A significant result of these studies is that many of the brown dwarf candidates in L1688 have near-to-mid infrared excesses indicative of circumstellar disks (Comerón et al. 1998; Testi et al. 2002; Natta et al. 2002). Analysis of hydrogen emission lines has shown that very low mass objects and brown dwarfs in L1688 have lower accretion rates than their more massive counterparts, but that brown dwarf candidates in L1688 exhibit accretion rates that are generally an order of magnitude higher than objects of comparable mass in other star-forming regions (Natta et al. 2004; Gatti et al. 2006).
| Name | Opt. Sp. Type | Ref. | IR Sp. Type | Ref.a |
|---|---|---|---|---|
| CRBR 14 | M7.5,M5.5,M7 | WGM99,LR99,N02 | ||
| CRBR 15 | M5 | WGM99,LR99 | ||
| GY 5 | M5.5 | W05 | M7,M6 | WGM99,N02 |
| GY 3 | M8 | W05 | M7.5 | N02 |
| GY 10 | M8.5,M6.5 | WGM99,LR99 | ||
| GY 11 | M6.5,M8.5 | WGM99,N02 | ||
| CRBR 23b | L1 | WMG07 | ||
| CRBR 31 | M6.7,M7 | CTK00,WMG07 | ||
| GY 31 | M5.5 | WGM99 | ||
| GY 37 | M5 | W05 | M6 | WGM99 |
| GY 59 | M3.75 | W05 | M6,M5 | WGM99,LR99 |
| GY 64 | M8 | WGM99 | ||
| GY 84 | M6,M1.5 | WGM99,LR99 | ||
| GY 141 | M8.5 | LLR97 | M8 | CTK00 |
| GY 201b | M9 | H00 | M5 | WMG07 |
| GY 202 | M7,M6.5 | WGM99,LR99 | ||
| GY 204 | M5.5 | W05 | M6 | N02 |
| GY 258 | M7 | WMG07 | ||
| oph-160 | M6 | N02 | ||
| GY 264 | M8 | W05 | ||
| GY 310 | M8.5,M7,M6 | WGM99,LR99,N02 | ||
| GY 325b | M9 | WMG07 | ||
| GY 350 | M6 | N02 | ||
| oph-193 | M6 | N02 | ||
| aReferences same as noted in Table 1, except Hillenbrand (2000, H00) | ||||
| bNeeds confirmation as an association member and does not appear in Table 1 | ||||
4.4. Mid-Infrared and Far-Infrared Observations
The presence or absence of thermal emission by circumstellar dust is essential in identifying YSOs and classifying their spectral energy distributions. While K band observations can often detect inner disk emission, wavelengths longer than 3.5 m are much more sensitive to circumstellar dust in a disk or envelope. While the Wilking (1991) review focused on results from IRAS (e.g., Young, Lada, & Wilking 1986; Wilking, Lada, & Young 1989), there are now mid-infrared cameras available on ground-based telescopes as well as data from the Infrared Space Observatory and the Spitzer Space Telescope.
In the post-IRAS period, photometry has been obtained primarily in the =3.4–24 m region for infrared sources in L1688 that were either too faint or confused in the IRAS database. By constructing their SEDs, or by calculating the spectral indices of their SEDs from near- to mid-infrared wavelengths, new YSOs can be identified and their luminosities estimated. In lieu of detailed knowledge of the disk mass and accretion rate, the SED class has also been used to infer the evolutionary state. However, the viewing angle or foreground extinction could cause YSOs in different evolutionary states to display the same spectral index (André & Montmerle 1994; Robitaille et al. 2006). With this caveat in mind, the relative numbers of sources in each SED class is a clue to the duration of each evolutionary stage. A survey by Greene et al. (1994), when combined with earlier studies, derived spectral indices from 2.2 to 10 m for 71 YSOs. In the sample with L 1 L, they found 11 Class I SEDs, 5 flat-spectrum (F) sources, and 22 Class II SEDs. This implied roughly equal evolutionary timescales for the embedded states (Class I and F) compared to the CTTS stage (Class II). The role of accretion in enhancing the luminosity of Class I “objects” relative to Class II “objects” was evident.
Ground-based mid-infrared studies have an advantage in spatial resolution over space-borne telescopes which is especially important given the higher incidence of multiplicity in YSOs compared to main sequence stars and the arcsecond scale of circumstellar disks. Mid-infrared imaging has been used to discover an infrared companion to the binary CTTS system WL 20 (Ressler & Barsony 2001). A comprehensive, high resolution (0.25-0.5′′) N-band survey of 172 YSOs in L1688 resolved 15 multiple systems (Barsony, Ressler, & Marsh 2005). The survey revealed that there is a wide range of veiling within a particular SED class suggesting that accretion is highly time-variable. A time scale of 4 105 years is derived for the clearing of the remnant infalling envelope. A wider survey of embedded sources in nearby clouds including L1688 has found that multiple systems with a Class I protostar are most often paired with a flat-spectrum source and that the envelopes surrounding these objects must be rapidly evolving (Haisch et al. 2006).
The Infrared Space Observatory
Launched in 1995, the Infrared Space Observatory (ISO) provided improvements in sensitivity and spatial resolution over IRAS. The entirety of L1688 (and parts of L1689) was surveyed with ISOCAM at wavelengths of 6.7 m and 14.3 m. Bontemps et al. (2001) presented photometry for 425 point sources with a sensitivity down to 10-15 mJy. Using a spectral index from 2.2 to 14.3 m, they found 16 Class I sources, 14 flat-spectrum sources, and 92 Class II sources with L 0.03 L. Thus, the ISO survey resulted in a more complete sampling of objects presumed to be in the CTTS phase and suggests the embedded state timescale is roughly one-third of the CTTS stage. A total of 119 association members in Table 1 have an infrared excess established from this survey and are denoted with “IRX” in the second to last column. Twenty-three of these YSOs have infrared excesses determined solely from the ISO survey, primarily due to its more extensive coverage. Using the sample of flat-spectrum and Class II objects, Bontemps et al. (2001) constructed the stellar luminosity function for L1688. They have modeled it with an underlying IMF with a two-component power law: a high mass index of 1.7, a break at about 0.5 M, and flat down to 0.06 M. Their result is consistent with the IMF derived from spectroscopic studies noted in Section 4.3.
ISOCAM was also used to examine individual objects in L1688. Using observations at wavelengths of 6.7 m and 11.5 m, Wilking et al. (2001) investigated SEDs for 35 radio-emitting young stars in L1688. About half of the sample are diskless YSOs in the high density core with ages comparable to sources with infrared excesses. It appears that these objects have shorter disk survival times compared to CTTSs in the cloud. The fact that diskless YSOs are about twice as numerous as CTTSs among radio-emitting objects emphasizes the essential role that radio (and X-ray) surveys play in obtaining a complete census of YSOs in a star-forming region (e.g., Gagné et al. 2004).
The Spitzer Space Telescope
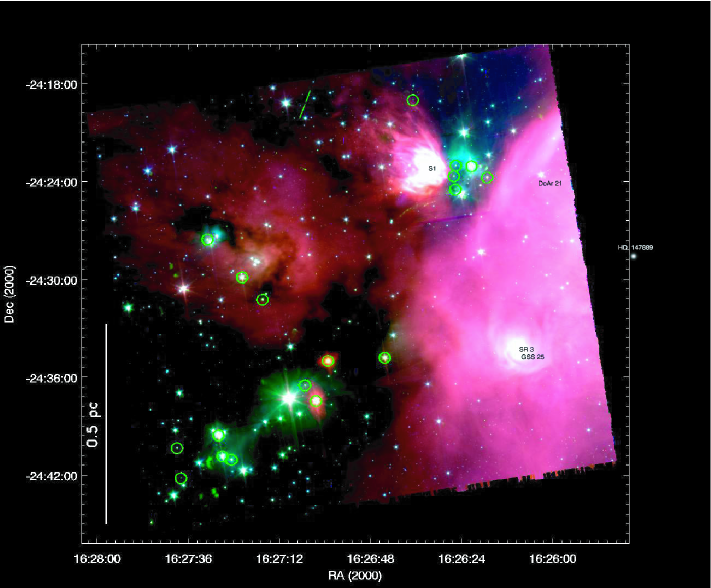
The Spitzer Space Telescope was launched in 2003 and presented a hundred-fold increase in sensitivity over ISO. L1688 has been surveyed by both IRAC and MIPS as part of the Cores to Disks (c2d) Legacy progam and Guaranteed Time Observations by the IRAC team. Fig. 4 shows a three-color IRAC image of a one square parsec area centered on L1688 obtained by mosaicking data sets from both programs. The resulting sensitivity is 0.015 mJy at 3.6 m. The red color represents emission in the 8 m band, green the 4.5 m band, and blue the 3.6 m band. Class I sources are enclosed by green circles and are clustered primarily in molecular cores A (northwest) and E/F (southeast). The early-type stars Oph Source 1, SR 3, and DoAr 21 are labeled and, along with the B2V star HD 147889 just off the western edge of the image, illuminate extensive nebulae of small dust grains. Fig. 5 is a three-color image of the same area but including MIPS data. The red color represents emission in the MIPS 24 m band, green the IRAC 8 m band, and blue the IRAC 4.5 m band. The Class I sources marked in Fig. 4 are all bright in the MIPS 24 m band.
A thorough analysis of the MIPS data covering 14.4 deg2 has been presented by Padgett et al. (2008). Their study covered not only L1688, but much of the dark cloud complex. A total of 323 candidate YSOs with infrared excesses were identified from color-magnitude diagrams using the 2MASS Ks band magnitude and the Ks - MIPS 24 m color, and comparisons with off-cloud fields dominated by extragalactic sources. One hundred sixty-one of the candidates reside in L1688, 27 in L1689, and 13 in L1709. The majority of candidates (84%) with Class I or flat-spectrum SEDs are associated with the known YSO aggregates. However, a significant fraction of the candidates in the Class II phase (37%) form a distributed population.

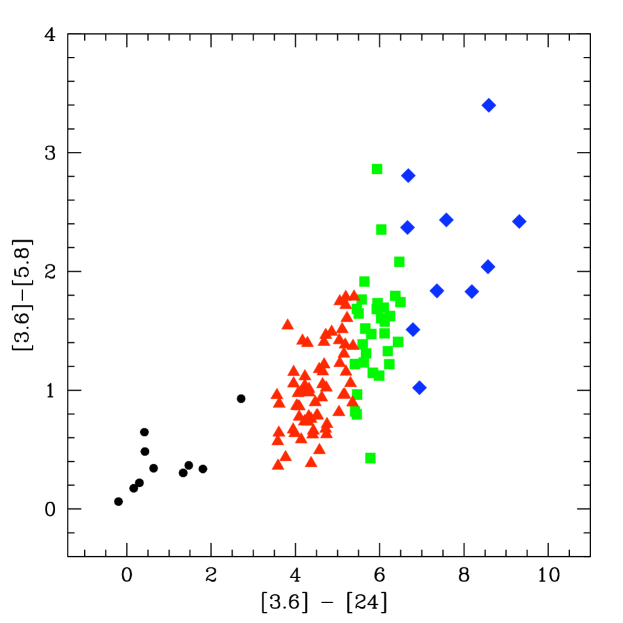
For this review, Spitzer data for the one square degree area centered on L1688 were combined in three ways to establish the presence of an infrared excess and association membership. First, there were 116 sources detected in all four IRAC bands and in the MIPS 24 m band. This permitted us to calculate the 3.6–24 m spectral index a and classify 10 objects with Class I SEDs (a0.3), 31 with flat-spectrum SEDs (0.3a0.3), 65 with Class II SEDs (1.6a0.3), and 10 with Class III SEDs (a1.6). A plot of these sources is shown in an IRAC-MIPS color-color diagram in Fig. 6. The sample is incomplete for Class II and Class III objects. While the spectral index declines continuously from Class I to Class II, there is a clear break between excess and non-excess sources in this diagram. Four of the 106 objects with infrared excesses were not detected by the 2MASS survey and hence they do not appear in Table 1.222The four excess sources not present in the 2MASS catalog and Table 1 include possible Class I sources IRAC 162625.61242429 (also the radio continuum source LFAM 4 = GDS J162625.7242429), and IRAC 162714.3243132 (also the K=15.26 source CRBR/Oph 2412.92447, Rieke & Rieke 1990). IRAC 162625.97242340 has a flat-spectrum SED and is associated with a K=17.5 NSFCAM source also observed with HST as AMD 162625242339 Allen et al. (2002); Wilking, Meyer, & Greene (2008). The possible Class II source IRAC 162656.42243301.5 has no known near-infrared or radio counterpart. The 102 objects which displayed an infrared excess based on the 3.6–24 m spectral index and which are in the 2MASS catalog do appear in Table 1 along with their SED Class (I, F, II). The “Mex” in the second to last column denotes their identification as association members based upon the MIPS 24 m excess. Eighteen of these YSOs have infrared excesses which were not detected by ISO.
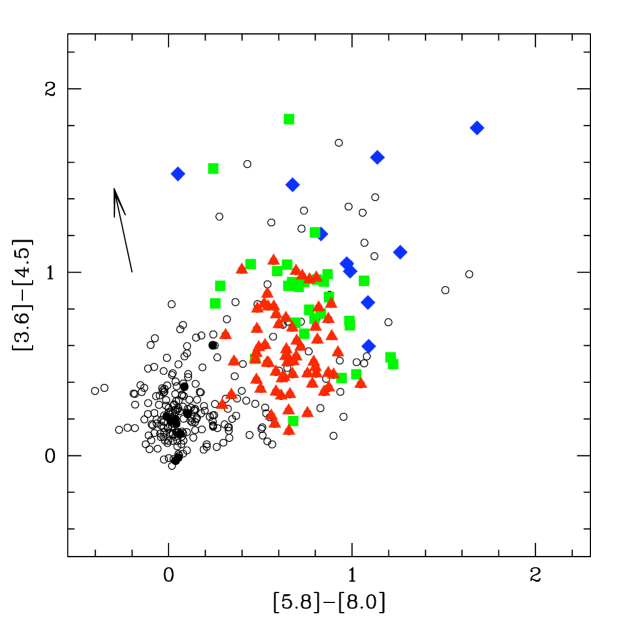
A second means to determine an infrared excess from the Spitzer data was to use the more sensitive IRAC data. Following Allen et al. (2004), a IRAC color-color diagram was constructed for 342 sources with detections in all 4 bands and errors less than 0.1 mag. In this diagram, shown in Fig. 7, Class II objects fall into the region where the ([3.6][4.5]) color 0.8 mag and the ([5.8][8.0]) color 0.2. Class I objects have ([3.6][4.5]) colors 1 mag while objects with 0.8 ([3.6][4.5]) 1 colors are associated with flat-spectrum sources. Consequently, 144 objects fall into the regime of YSOs with infrared excesses: 23 Class I, 28 flat-spectrum, and 93 Class II sources. A total of 30 new excess sources were identified in this manner. Clearly, the higher sensitivity of the IRAC bands give a much more complete sample of excess sources in all evolutionary states. These sources appear in Table 1 along with their IRAC classification 1, F, or 2 and a “B4ex” in the second to last column. There are also 38 sources classified as Class III objects in Fig. 7 that are known association members based on other criteria. Sources already classified using the 3.6–24 m spectral index are shown in Fig. 7 using the same symbols as Fig. 6. In general, the two methods of classification agree, although it is clear that reddening can affect the placement of a source in this diagram.
A third method used in an attempt to find infrared excesses for fainter objects employed a 2MASS-IRAC color-color diagram. While not shown here, a (HKs) vs. (Ks4.5) diagram was constructed to search for an infrared excess in IRAC band 2. Assuming a slope for the reddening line of 1.0 (Indebetouw et al. 2005), only seven new excess sources were found whose photometric errors placed them at least 2 standard deviations to the red of the reddening line of an M9 V star. These objects are noted by “B2ex” in the second to last column of Table 1.
Mid-Infrared Spectroscopy of Circumstellar Material
Both absorption and emission from circumstellar gas and dust have been observed toward YSOs in L1688 and L1689 in an effort to understand more clearly the composition and strucure of circumstellar disks and the chemical processes in disks. Using Spitzer’s Infrared Spectrograph (IRS), surveys of T Tauri stars, including objects in L1688 and L1689, have been conducted to search for silicate emission, PAH (polycyclic aromatic hydrocarbon) emission, as well as gas phase lines (Kessler-Silacci et al. 2006; Geers et al. 2006; Lahuis et al. 2007). Emission from both amorphous and crystalline silicates are observed for CTTSs in L1688 and, with the larger sample, follow a trend of larger silicate grain sizes for cooler YSOs. PAH emission is relatively rare in CTTSs, but has been spatially resolved with ground-based imaging for WLY 2-48 and WL 16 (a Herbig Ae star), and detected but unresolved in SR 21 (Ressler & Barsony 2003; Geers et al. 2006, 2007a, 2007b). The inferred disk diameters are 100 AU with the inner disk of WLY 2-48 in a transitional state where it is dominated by small grains. WLY 2-46 is the first solar mass YSO with strong absorption bands from hot organic molecules, most likely originating from the inner region of the disk (Lahuis et al. 2006) and GSS 30-IRS1 displays rare CO rovibrational emission lines (Dartois et al. 2003). Using both IRS and MIPS, the spectral energy distributions of SR 21 (VSSG 23) and 2MASS J162813702431391 (the “Flying Saucer”) have been modeled. SR 21 has a “cold disk” with an inner disk depleted of dust (Brown et al. 2007; Adams, Lada, & Shu 1987) suggestive of a planet formation phase. 2MASS J162813702431391 is modeled as an edge-on disk system with the surprising result that large grains (10 m) appear not to have settled in the outer disk (Grosso et al. 2003; Pontoppidan et al. 2007).
Alexander et al. (2003) used the ISOCAM-CVF from 5 to 16.5 m to study ices in several regions of low mass star formation including L1688. Spectra of ten YSOs in cores A and E of the cloud suggest that L1688 has an underabundance of ice relative to silicates compared to the R CrA and Serpens clouds. A larger scatter in the CO2:H2O ratio was also observed in L1688 compared to other clouds implying a larger variation in the local conditions sampled. Indeed, by focusing on five sources in core F, Pontoppidan (2006) used ground-based data coupled with data from ISOCAM and Spitzer’s IRS to reveal factor of three variations in this ratio and the enhanced freeze-out of CO and CO2 toward the center of core F. Detailed modeling of one source, CRBR 2422.83423, suggests that most of the CO ices originate in core material while up to 50% of the CO2, H2O, and minor ice species reside in the disk (Pontoppidan et al. 2005).
4.5. Millimeter and Submillimeter Surveys
Cold dust structures surround YSOs in the earlier phases of evolution. Compact dust emission (1′′ or 130 AU) is thought to arise from a circumstellar disk while larger structures with radii of 1000-5000 AU delineate an extended circumstellar envelope (e.g., Looney, Mundy, & Welch 2000). Single dish mm and submillimeter continuum surveys, sensitive mainly to the extended envelopes, have been effective in not only identifying YSOs but also their evolutionary states (André et al. 1990b; André, Ward-Thompson, & Barsony 1993; André & Montmerle 1994). For example, there is evidence that as a source evolves from a Class I protostar to a CTTS, a larger fraction of the cold dust emission resides in the unresolved disk component. Similarly, WTTSs (Class III energy distributions) have little or no cold circumstellar dust (e.g., André & Montmerle 1994). These mm continuum surveys have been important in establishing the Class 0 sources with more massive envelopes such as VLA 1623 and possibly LFAM 1 and MMS 126 in L1688 and IRAS 162932422 in L1689. In the L1688 core, mm continuum observations have been crucial to determining the evolutionary state of heavily reddened YSOs. For example, high extinction can shift the spectral energy distribution of the CTTSs to resemble that of less evolved Class I protostars. However, such objects will display weaker mm continuum than true Class I protostars.
| Name | ISO-Oph | IRAC SED | Sp. Index | MM Cont. | Ref.a |
| No. | Class | 3.6-24 m | Class | ||
| GSS 26 | 17 | 2 | II | I? | SST,SSGK06 |
| CRBR 12 | 21 | 1 | I | II? | SST,MAN98 |
| GSS30-IRS 1 | 29 | 1 | I | I | SST,WLY89,MAN98 |
| LFAM 1 | 31? | I | 0/I | GWAYL94,MAN98 | |
| CRBR 25 | 33 | 1 | F | SST | |
| GY 21 | 37 | F | F | I? | SST,SSGK06 |
| GY 30 | 1 | I | SST | ||
| VLA 1623 | 0 | MAN98 | |||
| GY 91 | 54 | 1 | I | I | SST,MAN98 |
| WL 12 | 65 | 1 | I | SST,WLY89,MAN98 | |
| GSS 39 | 67 | 2 | II | I? | SST,SSGK06 |
| CRBR 51 | 85 | F | II | I | SST,MAN98 |
| WL 22 | 90 | 1 | I | I | SST,MAN98 |
| WL 16 | 92 | 1 | I | II | SST,WLY89,MAN98 |
| GY 197 | 99 | 1 | I | I | SST,MAN98 |
| GY 201 | 1 | SST | |||
| EL 29 | 108 | 1 | I | I | SST,WLY89,MAN98 |
| WL 19 | 114 | 1 | II | II | SST,MAN98 |
| GY 236 | 118 | 1 | II | I? | SST,MAN98 |
| WL 20S | 121? | I | I-II | RB01,MAN98 | |
| IRAC 161 | 1 | F | SST | ||
| IRS 37 | 124 | 1 | F | II? | SST,MAN98 |
| WL 3 | 129 | 1 | F | II | SST,MAN98 |
| WL 6 | 134 | 1 | F | I | SST,MAN98 |
| CRBR 85 | 137 | 1 | I | SST,MAN98 | |
| IRS 43 | 141 | 1 | I | I | SST,WLY89,MAN98 |
| IRS 44 | 143 | 1 | I | I | SST,WLY89,MAN98 |
| IRS 46 | 145 | 1 | F | I | SST,MAN98 |
| VSSG 17 | 147 | F | II | I? | SST,SSGK06 |
| IRAC 130 | 150 | 1 | I | SST | |
| GY 284 | 151 | 2 | F | I | SST,MAN98 |
| IRS 48 | 159 | 2 | I | I | SST,WLY89,MAN98 |
| GY 312 | 165 | 1 | I | SST | |
| IRS 51 | 167 | 2 | F | I | SST,MAN98 |
| IRS 54 | 182 | F | F | I | SST,MAN98 |
| aReferences are the Spitzer Space Telescope (SST, this study), Stanke et al. (2006, SSGK06), Motte, André, & Neri (1998, MAN98), Wilking, Lada, & Young (1989, WLY89),Greene et al. (1994, GWAYL94), and Ressler & Barsony (2001, RB01) | |||||
Recent major mm continuum surveys of L1688 have used the IRAM 30-m and the MPIfR 19-channel bolometer array giving 11′′ resolution (Motte, André, & Neri 1998), the JCMT and the SCUBA bolometer array yielding 14′′ resolution (Wilson et al. 1999; Johnstone et al. 2000; Andrews & Williams 2007), and the SEST and the 37-channel SIMBA bolometer array with 24′′ resolution (Stanke et al. 2006). Andrews & Williams (2007) have used a sample of 147 YSOs in the Ophiuchus complex to derive the properties of their circumstellar disks. They find their basic properties are indistinguishable from those in the Taurus-Auriga cloud. For Class II objects, the combined sample yields characteristic values for the disk mass of 0.005 M and for the ratio of the disk to stellar mass of 1%. These surveys have also resulted in a complete census of Class 0 and Class I protostars in L1688. These results are summarized in Table 4 and their distribution shown in Fig. 3. Among these objects, VLA 1623 and MMS 126 have too much extinction to have detectable counterparts at =2 m in the 2MASS catalog. In addition, five sources were detected in the Spitzer IRAC survey of L1688 with no counterparts in the 2MASS catalog. However, their nature as Class I protostars has yet to be confirmed.
Interferometric mm continuum observations have targeted individual sources such as VLA 1623, GSS30/LFAM 1, and EL 29 in L1688 and IRAS 162932422 in L1689 (Pudritz et al. 1996; Looney, Mundy, & Welch 2000; Zhang, Wootten, & Ho 1997; Boogert et al. 2002; Mundy et al. 1992; Patience, Akeson, & Jensen 2008). These are especially critical in identifying Class I and Class 0 binary systems, such as as VLA 1623 and IRAS 162932422, and exploring the evolution of circumstellar disks.
5. Jets and Outflows
Mass loss activity has been observed by searching for high velocity CO gas, shock excited clumps of atomic or molecular gas, radio continuum emission from ionized gas, water masers, and extended, highly-polarized circumstellar dust. Since the previous review (Wilking 1991), the number of molecular outflows in L1688 has increased in number from 4 to 16. Most of these new outflows have been identified by observing the higher J transitions of CO (Bontemps et al. 1996; Sekimoto et al. 1997; Kamazaki et al. 2001; Ceccarelli et al. 2002; Kamazaki et al. 2003; Stanke et al. 2006; Bussmann et al. 2007). Near-infrared polarimetry has been used to model emission surrounding WLY 2-54 as an outflow cavity (Beckford et al. 2008). The most spectacular outflow remains that from the Class 0 source VLA 1623 (André et al. 1990a; Dent, Matthews, & Walther 1995) which is also associated with a Herbig-Haro object, numerous H2 emission knots, and water masers (see below).
In 1991, at the time of the previous review, only two Herbig-Haro (HH) objects in L1688 had been reported (HH 79 and HH 224). This was clearly a selection effect caused by the high visual extinction in the core. Although deep optical imaging surveys of L1688 in H and [S II] have now discovered about 33 HH objects (including components of HH objects), they lie preferentially toward the lower extinction cloud edges and it is often difficult to identify the exciting star (Wilking et al. 1997; Gómez, Whitney, and Wood 1998; Gómez et al. 2003; Phelps & Barsony 2004). Five of these HHs form a jet-like structure that appears to emanate from the CTTS SR 4. In addition, a survey of an 11 deg2 region of the Ophiuchus complex has revealed seven groups of HHs in areas outside of L1688 (Wu et al. 2002).
Because of the high extinction in the L1688 core, searches for shock-excited clumps using the 1-0 S(1) transition of H2 at 2.12 m have been very successful. Knots of emission have been observed in the VLA 1623 outflow (Dent, Matthews, & Walther 1995; Davis & Eislöffel 1995). Large scale surveys of L1688 have identified a total of 74 knots of H2 emission (Grosso et al. 2001; Gómez et al. 2003; Khanzadyan et al. 2004). Khanzadyan et al. (2004) find that 10 outflows can account for all of the H2 knots with a tendency for the outflow axes to be perpendicular to the elongation of the cloud filaments. They link together H2 emission along with known HH objects to trace major outflows from the Class I objects YLW 16 (WLY 2-44) and YLW 15 (WLY 2-43). Ybarra et al. (2006) have detected a series of H2 knots within 30′′ of EL 29 which trace a precessing jet that has excavated a wide-angle cavity observed in scattered light.
Radio continuum and water maser emission have been shown to be effective tracers of mass loss from YSOs independent of the high visual extinction in the core. Both tracers can be observed interferometrically and are either coincident, or within a hundred AUs, of the YSO making identification of the source of excitation relatively unambiguous. Radio continuum emission due to free-free emission from ionized gas has been observed in surveys of the dense cores in L1688 with extended structure associated with jets (Leous et al. 1991; Bontemps 1996; Bontemps & André 1997; Gagné et al. 2004). However, some fraction of the radio continuum sources are extragalactic. Since the first reports of highly variable maser emission from IRAS 162932422 in L1689 and YLW 16A (WLY 2-44) and YLW 16B (WLY 2-46) in L1688, water masers have also been detected toward GSS 30-IRS1 and VLA 1623 in L1688 (Claussen et al. 1996). Subsequently, multi-epoch VLBI observations have been reported for IRAS 162932442 (Wootten et al. 1999; Imai, Iwata, & Miyoshi 1999) and YLW16A (Simpson et al. 2004) The success of these observations have opened the possibility of using the VLBA observations to derive accurate parallaxes to the masers.
6. Star Formation in the Ophiuchus Streamers
As shown in Figs. 1 and 2, streamers of molecular gas extend northeast of L1688 (L1709, L1704) and eastward from the L1689 cloud (L1689, L1712, L1729, see also Cambrésy 1999 and Lombardi, Lada, & Alves 2008). These regions have been included in an H objective prism survey (Wilking, Schwartz, & Blackwell 1987), and the IRAS survey. All of L1689, L1712, L1729, and L1709 have been included in the 1.1 mm continuum survey by Young et al. (2006) and the MIPS survey reported by Padgett et al. (2008). All of L1689 has been observed at 450 and 850 m by Nutter, Ward-Thompson, & André (2006). Portions of L1689 were covered by Einstein X-ray observations (Montmerle et al. 1983), and ISO (Bontemps et al. 2001). But while comprehensive infrared studies of star formation in the streamers are just beginning, it is already apparent that there is less high density gas and less star formation compared to L1688 (Nutter, Ward-Thompson, & André 2006).
There have been detailed studies of individual dense cores or YSOs in these regions. Seven YSOs identified through the IRAS catalog were included in a mid-infrared study by Greene et al. (1994). Subsequently two of these YSOs, L1709B/GWAYL 4 and L1689S/GWAYL 6 were observed to have strong mm continuum emission (André & Montmerle 1994) and were observed spectroscopically (Doppmann et al. 2005). Molecular outflows that had been previously reported for these sources were mapped by Bontemps et al. (1996).
Most of the recent studies in the streamers center around the binary Class 0 source in L1689, IRAS 162932422, and its associated dense gas. VLBI measurements of the parallax of water masers associated with IRAS 162932422 yield a distance of 178 pc (+18 pc, 37 pc) (Imai et al. 2007). As shown in Fig. 8, the main components of IRAS 162932422 are separated by 5.2′′ (900 AU at 175 pc) and have distinctly different properties: the southern component, I16293A, is the strongest source of line emission with associated water masers and free-free emission while the northern component, I16293B, shows compact emission dominated by optically thick dust from 5-300 GHz (Mundy et al. 1992; Wootten 1993; Rodríguez et al. 2005; Chandler et al. 2005; Remijan & Hollis 2006; Loinard et al. 2007).
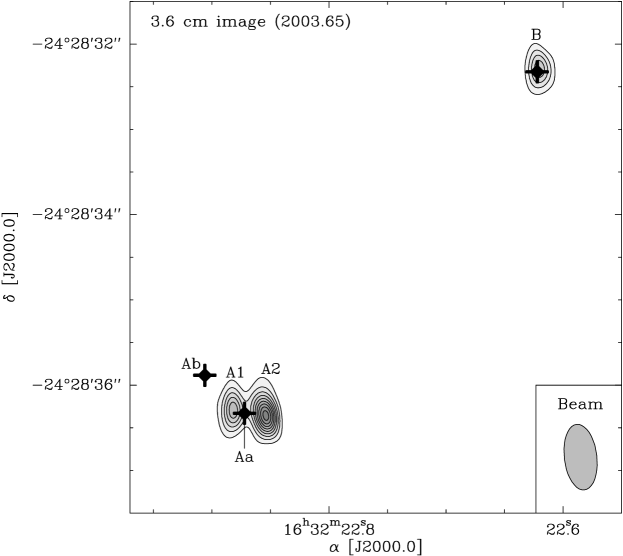
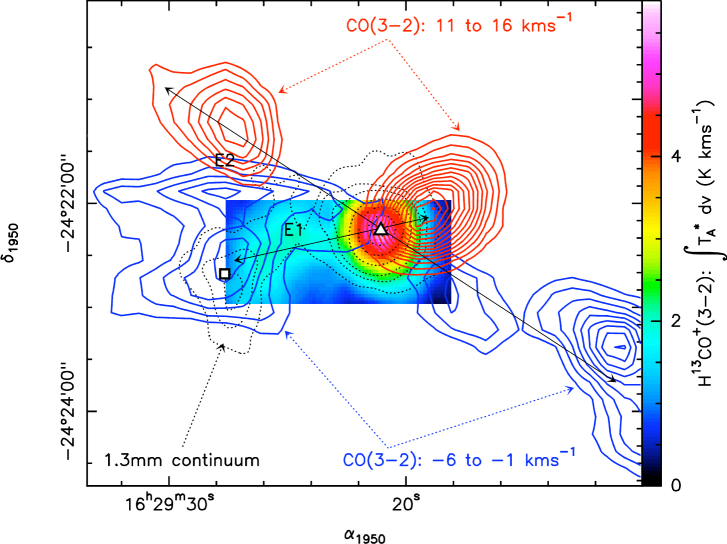
Recent studies of I16293A by Chandler et al. (2005) have resolved the southern source into two components separated by 0.64′′ (Aa and Ab) which are distinct from the centimeter sources A1 and A2. On the larger scale, IRAS 162932422 appears to drive two distinct bipolar CO outflows first mapped by Wootten & Loren (1987), Walker et al. (1988), and Mizuno et al. (1990). More recently, the outflows have been studied at higher resolution and in different molecules (Castets et al. 2001; Hirano et al. 2001; Garay et al. 2002; Lis et al. 2002; Stark et al. 2004; Yeh et al. 2008). Fig. 9 shows the molecular outflow in relation to the dense core.
It has been suggested that the northeast-southwest outflow is driven by source A2 in I16293A and the east-west outflow originates from I16293B (Chandler et al. 2005; Loinard et al. 2007). A rich spectrum of complex organic molecules is observed from compact (1.5′′) regions toward I16293A and I16293B (Cazaux et al. 2003; Bottinelli et al. 2004; Schöier et al. 2004; Kuan et al. 2004). Cazaux et al. (2003) have suggested that the distribution of molecular emission is consistent with grain evaporation in the near-circumstellar environment. This has been called into question by Jorgensen et al. (2005) who find evidence for an inner cavity in the protobinary system with a radius of 600 AU. Indeed, Chandler et al. (2005) show that the molecular emission toward I16293A coincides with centimeter source A1 and is likely to be shock-excited by the outflow from A2.
Acknowledgments.
We thank Robert Gendler for permission to use Figure 1.Naomi Ridge generously made the COMPLETE data of the Ophiuchus molecular complex in Fig. 2 available and Di Li allowed us to display his C18O map of L1688 in advance of publication. We also thank Robert Hurt for preparing the color image shown in Figure 5. This review has made extensive use of NASA’s Astrophysics Data System, and the SIMBAD database, operated at CDS, Strasbourg, France. This publication also makes use of data products from the Two Micron All Sky Survey, which is a joint project of the University of Massachusetts and the Infrared Processing and Analysis Center/California Institute of Technology, funded by the National Aeronautics and Space Administration and the National Science Foundation.
References
- Abergel et al. (1996) Abergel, A., Bernard, J. P., Boulanger, F., Cesarsky, C., Desert, F. X. et al. 1996, A&A, 315, L329
- Adams, Lada, & Shu (1987) Adams, F. C., Lada, C. J., & Shu, F. H. 1987, ApJ, 312, 788
- Ageorges et al. (1997) Ageorges, N., Eckart, A., Monin, J.-L., & Menard, F. 1997, A&A, 326, 632
- Alexander et al. (2003) Alexander, R. D., Casali, M. M., André, Ph., Persi, P., & Eiroa, C. 2003, A&A, 401, 613
- Allen et al. (2002) Allen, L. E., Myers, P. C., Di Francesco, J., Mathieu, R., Chen, H., & Young, E. 2002, ApJ, 56, 993
- Allen et al. (2004) Allen, L. E., Calvet, N., D’Alessio, P., Merin, B., Hartmann, L., et al. 2004, ApJS, 154, 363
- Allen et al. (2008) Allen, L. E., Megeath, T., Padgett, D., Wilking, B., Gagné, M., et al. 2008, in preparation
- Alves de Oliveira & Casali (2008) Alves de Oliveira, C. & Casali, M. 2008, A&A, 485, 155
- André et al. (1990a) André, Ph., Martín-Pintado, Depois, D., & Montmerle, T. 1990a, A&A, 236, 180
- André et al. (1990b) André, Ph., Montmerle, T., Feigelson, E. D., & Steppe, H. 1990b, A&A, 240, 321
- André et al. (1991) André, Ph., Phillips, R. B., Lestrade, J.-F., & Klein, K.-L. 1991, ApJ, 376, 630
- André et al. (1992) André, Ph., Deeney, B. D., Phillips, R. B., & Lestrade, J.-F. 1992, ApJ, 401, 667
- André, Ward-Thompson, & Barsony (1993) André, Ph. Ward-Thompson, D., & Barsony, M. 1993, ApJ, 406, 122
- André & Montmerle (1994) André, Ph. & Montmerle, T. 1994, ApJ, 420, 837
- André et al. (2007) André, Ph., Belloche, A., Motte, F., & Peretto, N. 2007, A&A, 472, 519
- Andrews & Williams (2007) Andrews, S. M. & Williams, J. P. 2007, ApJ, 671, 1800
- Barsony et al. (1989) Barsony, M., Burton, M. G., Russell, A. P. G., Carlstrom, J. E., & Garden, R. 1989, ApJ, 346, L93
- Barsony et al. (1997) Barsony, M., Kenyon, S., Lada, E., & Teuben, P. 1997, ApJS, 112, 109
- Barsony, Koresko, & Matthews (2003) Barsony, M., Koresko, C., & Matthews, K. 2003, 591, 1064
- Barsony, Ressler, & Marsh (2005) Barsony, M., Ressler, M., & Marsh, K. 2005, ApJ, 630, 381
- Beckford et al. (2008) Beckford, A. F., Lucas, P. W., Chrysostomou, & Gledhill, T. M. 2008, MNRAS, 384, 907
- Bertiau (1958) Bertiau, F. C. 1958, ApJ, 128, 533
- Blaauw (1961) Blaauw, A. 1961, Bull. Astron. Inst. Neth. 15, 265
- Bontemps (1996) Bontemps, S. 1996, Ph.D. thesis, Univ. Paris, XI
- Bontemps et al. (1996) Bontemps, S., André, Ph., Terebey, S., & Cabrit, S. 1996, A&A, 311, 858
- Bontemps & André (1997) Bontemps, S. & André, Ph. 1997, in Low Mass Star Formation - from Infall to Outflow, Poster proceedings of IAU Symposium No. 182, ed. F. Malbet and A. Castets, 63
- Bontemps et al. (2001) Bontemps, S., André, Ph., Kaas, A. A., Nordh, L., Olofsson, G., et al. 2001, A&A, 372, 173
- Boogert et al. (2002) Boogert, A. C. A., Hogerheijde, M. R., Ceccarelli, C., Tielens, A. G. G. M., van Dishoeck, E. F., Blake, G. A., Latter, W. B., & Motte, F. 2002, ApJ, 570, 708
- Bottinelli et al. (2004) Bottinelli, S., Ceccarelli, C., Neri, R., Williams, J. P., Caux, E., Cazaux, S., Lefloch, B., Maret, S., & Tielens, A. G. G. M. 2004, ApJ, 617, L69
- Bouvier & Appenzeller (1992) Bouvier, J. & Appenzeller, I. 1992, A&AS, 92, 481
- Bouy, H. (2004) Bouy, H. 2004, A&A, 424, 619
- Brandner et al. (1996) Brandner, W., Alcala, J. M., Kunkel, M., Moneti, A., & Zinnecker, H. 1996, A&A, 307, 121
- Brown et al. (2007) Brown, J. M., Blake, G. A., Dullemond, C. P., Merin, B., Augereau, J. C. et al. 2007, ApJ, 664, L107
- Bussmann et al. (2007) Bussman, R. S., Wong, T. W., Hedden, A. S., Kulesa, C. A., & Walker, C. K. 2007, ApJ, 657, L33
- Cambrésy (1999) Cambrésy, L., 1999, A&A, 345, 965
- Casali & Matthews (1992) Casali, M. M. & Matthews, H. E. 1992, MNRAS, 258, 399
- Casanova et al. (1995) Casanova, S., Montmerle, T., Feigelson, E. D., & André, Ph. 1995, ApJ, 439, 752
- Castets et al. (2001) Castets, A., Ceccarelli, C., Loinard, L., Caux, E., & Lefloch, B. 2001, A&A, 375, 40
- Cazaux et al. (2003) Cazaux, S., Tielens, A. G. G. M., Ceccarelli, C., Castets, A., Wakelam, V., Caux, E., Parise, B., & Teyssier, D. 2003, ApJ, 539, L51
- Ceccarelli et al. (2002) Ceccarelli, C., Boogert, A. C. A., Tielens, A. G. G. M., Caux, E., Hogerheijde, M. R., & Parise, B. 2002, A&A, 395, 863
- Chandler et al. (2005) Chandler, C.J., Brogan, C. L., Shirley, Y. L., & Loinard, L. 2005, ApJ, 632, 371
- Chelli et al. (1988) Chelli, A., Cruz-Gonzales, I., Zinnecker, H., Carrasco, L., & Perrier, C. 1988, A&A, 207, 46
- Chini (1981) Chini, R. 1981, A&A, 99, 346
- Claussen et al. (1996) Claussen, M. J., Wilking, B. A., Benson, P. J., Wootten, A., Myers, P. C., & Terebey, S. 1996, ApJS, 106, 111
- Cohen & Kuhi (1979) Cohen, M. & Kuhi, L. V. 1979, ApJS, 41, 743
- Comerón et al. (1993) Comerón, F., Rieke, G. H., Burrows, A., & Rieke, M. J. 1993, ApJ, 416, 185
- Comerón et al. (1998) Comerón, F., Rieke, G. H., Claes, P., Torra, J., & Laureijis, R. J. 1998, A&A, 335, 522
- Costa et al. (2000) Costa, A., Jessop, N. E., Yun, J. L., Santos, C., Ward-Thompson, D., & Casali, M. M. 2000, in Poster Proc. of IAU Symposium 200, Birth and Evolution of Binary Stars, ed. B. Reipurth & H. Zinnecker, 48
- Covey et al. (2005) Covey, K. R., Greene, T. P., Doppmann, G. W., & Lada, C. J. 2005, AJ, 129, 2765
- Cushing, Tokunaga, & Kobayashi (2000) Cushing, M. C., Tokunaga, A. T., & Kobayashi, N. 2000, AJ, 119, 3019
- Cutri et al. (2003) Cutri, R. M., Skrutskie, M. F., van Dyk, S., Beichman, C. A., Carpenter, J. M., et al. 2003, 2MASS All-Sky Catalog of Point Sources (Pasadena: IPAC)
- D’Antona & Mazzitelli (1997) D’Antona, F. & Mazzitelli, I. 1997, Mem. S. A. It., 68, 4
- Dartois et al. (2003) Dartois, E., d’Hendecourt, L., Thi, W.-F., Pontopiddan, K., Schiutte, W., & van Dishoeck, E. F. 2004, in Galactic Star Formation Across the Stellar Mass Spectrum, ASP Conference Series, Vol. 87, eds. J. M. De Buizer & N. S. van der Bliek, 187
- Davis & Eislöffel (1995) Davis, C. J. & Eislöffel, J. 1995, A&A, 300, 851
- de Geus (1992) de Geus, E. J. 1992, A&A, 262, 258
- de Geus, de Zeeuw, & Lub (1989) de Geus, E. J., de Zeeuw, P. T., & Lub, J. 1989, A&A, 216, 44
- Dent, Matthews, & Walther (1995) Dent, W. R. F., Matthews, H. E. & Walther, D. 1995, MNRAS, 277, 193
- de Zeeuw et al. (1999) de Zeeuw, P. T., Hoogerwerf, R., de Bruijne, J. H. J., Brown, A. G. A., & Blaauw, A. 1999, AJ, 117, 354
- Di Francesco, André, & Myers (2004) Di Francesco, J., André, Ph., & Myers, P. C. 2004, ApJ, 617, 425
- Dolidze & Arakelyan (1959) Dolidze, M. V. & Arakelyan, M. A. 1959, Soviet Astr., 3, 434
- Doppmann, Jaffe, & White (2003) Doppmann, G. W., Jaffe, D. T. & White, R. J. 2003, AJ, 126, 3043
- Doppmann et al. (2005) Doppmann, G. W., Greene, T. P., Covey, K. R., & Lada, C. J. 2005, AJ, 130, 1145
- Duchêne et al. (2004) Duchêne, G., Bouvier, J., Bontemps, S., André, Ph., & Motte, F. 2004, A&A, 427, 651
- Duchêne et al. (2007) Duchêne, G., Bontemps, S., Bouvier, J., André, Ph., Djupvik, A. A., & Ghez, A. M. 2007, A&A, 476, 229
- Elias (1978) Elias, J. H. 1978, ApJ, 224, 453
- Favata et al. (2005) Favata, F., Micela, G., Silva, B., Sciortino, S., & Tsujimoto, M. 2005, A&A, 433, 1047
- Feigelson et al. (2005) Feigelson, E. D., Getman, K., Townsley, L., Garmire, G., Preibisch, T., et al. 2005, ApJS, 160, 379
- Gagné et al. (2004) Gagné, M., Skinner, S. L., & Daniel, K. J. 2004, ApJ, 613, 393
- Garay et al. (2002) Garay, G., Mardones, D., Caselli, P., & Bourke, T. 2002, ApJ, 567, 980
- Gatti et al. (2006) Gatti, T., Testi, L., Natta, A., Randich, S., & Muzerolle, J. 2006, A&A, 460, 547
- Geers et al. (2006) Geers, V. C., Augereau, J.-C., Pontoppidan, K. M., Dullemond, C. P., Visser, R. et al. 2006, A&A, 459, 545
- Geers et al. (2007a) Geers, V. C., Pontoppidan, K. M., van Dishoeck, E. F., Dullemond, C. F., Augereau, J.-C., Merin, B., Oliveira, I., & Pel, J. W. 2007a, A&A, 469, L35
- Geers et al. (2007b) Geers, V. C., van Dishoeck, E. F., Visser, R., Pontoppidan, K. M., Augereau, J.-C., Habart, E., Lagrange, A. M. 2007b, A&A, 476, 279
- Ghez, Neugebauer, & Matthews (1993) Ghez, A. M., Neugebauer, G., & Matthews, K. 1993, AJ, 106, 2005
- Giardino et al. (2007) Giardino, G., Favata, F., Pillitteri, I., Flaccomio, E., Micela, M., & Sciortino, S. 2007, A&A, 475, 891
- Gómez, Whitney, and Wood (1998) Gómez, M., Whitney, B. A., & Wood, K. 1998, AJ, 115, 2018
- Gómez et al. (2003) Gómez, M., Stark, D, P., Whitney, B. A., & Churchwell, E. 2003, AJ, 126, 863
- Grasdalen, Strom, & Strom (1973) Grasdalen, G. L. Strom, K. M., & Strom, S. E. 1973, ApJ, 184, L53
- Greene & Lada (1996) Greene, T. P. & Lada, C. J. 1996, AJ, 112, 2184
- Greene & Lada (1997) Greene, T. P. & Lada, C. J. 1997, AJ, 114, 2157
- Greene & Lada (2000) Greene, T. P. & Lada, C. J. 2000, AJ, 120, 430
- Greene & Lada (2002) Greene, T. P. & Lada, C. J. 2002, AJ, 124, 2185
- Greene & Meyer (1995) Greene, T. P. & Meyer, M. R. 1995, ApJ, 450, 233
- Greene et al. (1994) Greene, T. P., Wilking, B. A., André, Ph., Young, E., & Lada, C. J. 1994, ApJ, 434, 614
- Greene & Young (1992) Greene, T. P. & Young, E. T. 1992, ApJ, 395, 516
- Grosso et al. (2000) Grosso, N., Montmerle, T., Bontemps, S., André, Ph., & Feigelson, E. D. 2000, A&A, 359, 113
- Grosso et al. (2001) Grosso, N., Alves, J., Neuhäuser, R. & Montmerle, T. 2001, A&A, 380, L1
- Grosso et al. (2003) Grosso, N., Alves, J., Wood, K., Neuhäuser, R., Montmerle, T., & Bjorkman, J. E. 2003, ApJ, 586, 296
- Haisch et al. (2002) Haisch, K., Barsony, M., Greene, T. P., & Ressler, M. E. 2002, AJ, 124, 2841
- Haisch et al. (2004) Haisch, K., Greene, T. P., Barsony, M., & Stahler, S. W. 2004, AJ, 127, 1747
- Haisch et al. (2006) Haisch, K., Barsony, M., Ressler, M., & Greene, T. 2006, AJ, 132, 2675
- Haffner & Meyer (1995) Haffner, L. M. & Meyer, D. M. 1995, ApJ, 453, 450
- Hillenbrand (1997) Hillenbrand, L. A. 1997, AJ, 113, 1733
- Hillenbrand (2000) Hillenbrand, L. A. 2000, unpublished data
- Hirano et al. (2001) Hirano, N., Mikami, H., Umemoto, T., Yamamoto, S., & Taniguchi, Y. 2001, ApJ, 547, 899
- Imai, Iwata, & Miyoshi (1999) Imai, H., Iwata, T. & Miyoshi 1999, PASJ, 51, 473
- Imai et al. (2007) Imai, H., Nakashima, K., Bushimata, T., Choi, Y. K., Hirota, T. et al. 2007, PASJ, 59, 1107
- Imanishi et al. (2001) Imanishi, K., Koyama, K., & Tsuboi, Y. 2001, ApJ, 557, 747
- Imanishi et al. (2002) Imanishi, K., Tsujimoto, M., & Koyama, K. 2002, ApJ, 572, 300
- Imanishi et al. (2003) Imanishi, K., Nakajima, H., Tsujimoto, M., Koyama, K., & Tsuboi, Y. 2003, PASJ, 55, 653
- Indebetouw et al. (2005) Indebetouw, R., Mathis, J. S., Babler, B. L., Meade, M. R., Watson, C., et al. 2005, ApJ, 619, 931
- Johnstone et al. (2000) Johnstone, D., Wilson, C. D., Moriarty-Schieven, G., Joncas, G., Smith, G., Gregersen, E., & Fich, M. 2000, ApJ, 545, 327
- Jorgensen et al. (2005) Jorgensen, J. K., Lahuis, F., Schoeier, F. L., van Dishoeck, E. F., Blake, G. A., et al. 2005, ApJ, 631, l77
- Kamata et al. (1997) Kamata, Y., Koyama, K., Tsuboi, Y., & Yamauchi, S. 1997, PASJ, 49, 461
- Kamazaki et al. (2001) Kamazaki, T., Saito, M., Hirano, N., & Kawabe, R. 2001, ApJ, 548, 278
- Kamazaki et al. (2003) Kamazaki, T., Saito, M., Hirano, N., Umemoto, T., & Kawabe, R. 2003, ApJ, 584, 357
- Kamegai et al. (2003) Kamegai, K., Ikeda, M., Maezawa, H., Ito, T., Iwata, M., et al. 2003, ApJ, 589, 378
- Kessler-Silacci et al. (2006) Kessler-Silacci, J. E. et al. 2006, ApJ, 639, 275
- Khanzadyan et al. (2004) Khanzadyan, T., Gredel, R., Smith, M. D., & Stanke, T. 2004, A&A, 426, 171
- Knude & Høg (1998) Knude, J. & Høg, E. 1998, A&A, 338, 897
- Kuan et al. (2004) Kuan, Y.-J., Huang, H.-C., Charnley, S. B., Hirano, N., Takakuwa, S., et al. 2004, ApJ, 616, L27
- Kulesa et al. (2005) Kulesa, C. A., Hungerford, A. L., Walker, C. K., Zhang, X., & Lane, A. P. 2005, AJ, 625, 194
- Lada & Wilking (1984) Lada, C. J. & Wilking, B. A. 1984, ApJ, 287, 610
- Lahuis et al. (2006) Lahuis, F., van Dishoeck, E. F., Boogert, A. C. A., Pontoppidan, K. M., Blake, G. A. et al. 2006, ApJ, 636, L145
- Lahuis et al. (2007) Lahuis, F., van Dishoeck, E. F., Blake, G. A., Evans, N. J., Kessler-Silacci, J. E., & Pontoppidan, K. M. 2007, ApJ, 665, 492
- Leous et al. (1991) Leous, J. A., Feigelson, E. D., André, Ph., & Montmerle, T. 1991, ApJ, 379, 683
- Lis et al. (2002) Lis, D. C., Gerin, M., Phillips, T. G., & Motte, F. 2002, ApJ, 569, 322
- Liseau et al. (1999) Liseau, R., White, G. J., Larsson, B., Sidher, S., Olofsson, G., Kaas, A., Nordh, L., Caux, E., Lorenzetti, D., Molinari, S., Nisini, B., & Sibille, F. 1999, A&A, 344, 342
- Loinard et al. (2007) Loinard, L., Chandler, C., Rodríguez, L., D’Alessio, P., Brogan, C., Wilner, D., & Ho, P. 2007, ApJ, 670, 1353
- Loinard et al. (2008) Loinard, L., Torres, R. M., Mioduszewski, A. J., & Rodríguez, L. F. 2008, ApJ, 675, L29
- Lombardi, Lada, & Alves (2008) Lombardi, M., Lada, C. J., & Alves, J. 2008, A&A, 480, 785
- Looney, Mundy, & Welch (2000) Looney, L. W., Mundy, L. G., & Welch, W. J. 2000, ApJ, 529, 477
- Loren (1989a) Loren, R. B. 1989a, ApJ, 338, 902
- Loren (1989b) Loren, R. B. 1989b, ApJ, 338, 925
- Loren & Wootten (1986) Loren, R. B. & Wootten, H. A. 1986, ApJ, 306, 142
- Loren, Wootten, & Wilking (1990) Loren, R. B., Wootten, H. A., & Wilking, B. A. 1990, ApJ, 365, 269
- Luhman, Liebert, & Rieke (1997) Luhman, K. L., Liebert, J., & Rieke, G. H. 1997, ApJ, 489, L165
- Luhman & Rieke (1999) Luhman, K. L. & Rieke, G. H. 1999, ApJ, 525, 440
- Makarov (2007) Makarov, V. V. 2007, ApJ, 670, 1225
- Mamajek (2008) Mamajek, E. E. 2008, Astron. Nachr., 329, 10
- Martín et al. (1998) Martín, E. L., Montmerle, T., Gregorio-Hetem, J., & Casanova, S. 1998, MNRAS, 300, 733
- Miller & Scalo (1979) Miller, G. E. & Scalo, J. M. 1979, ApJS, 41, 513
- Mizuno et al. (1989) Mizuno, A., Nozawa, S., & Fukui, Y. 1989, unpublished data
- Mizuno et al. (1990) Mizuno, A., Fukui, Y., Nozawa, S., & Takano, T. 1990, ApJ, 356, 184
- Montmerle et al. (1983) Montmerle, T., Koch-Miramond, L., Falgarone, E., & Grindlay, J. E. 1983, ApJ, 269, 182
- Motte, André, & Neri (1998) Motte, F., André, Ph., & Neri, R. 1998, A&A, 336, 150
- Mundy et al. (1992) Mundy, L. G., Wootten, A., Wilking, B. A., Blake, G. A., & Sargent, A. I. 1992, ApJ, 385, 306
- Natta et al. (2002) Natta, A., Testi, L., Comerón, F., Oliva, E., D’Antona, F., Baffa, C., Comoretto, G., & Gennari, S. 2002, A&A, 393, 597
- Natta et al. (2004) Natta, A., Testi, L., Muzerolle, J., Randich, S., Comerón, F., & Persi, P. 2004, A&A, 424, 603
- Natta, Testi, & Randich (2006) Natta, A. Testi, L., & Randich, S. 2006, A&A, 452, 245
- Nozawa et al. (1991) Nozawa, S., Mizuno, A., Teshima, Y., Ogawa, H., & Fukui, Y. 1991, ApJS, 77, 647
- Nutter, Ward-Thompson, & André (2006) Nutter, D., Ward-Thompson, D., & André, Ph. 2006, MNRAS, 386, 1833
- Ozawa, Grosso, & Montmerle (2005) Ozawa, H., Grosso, N., & Montmerle, T. 2005, A&A, 429, 963
- Padoan & Nordlund (2002) Padoan, P. & Nordlund, A. 2002, ApJ, 576, 870
- Padgett et al. (2008) Padgett, D., Rebull, L. M., Stapelfeldt, K. R., Chapman, N. L., Lai, S.-P. et al. 2008, ApJ, 672, 1013
- Patience, Akeson, & Jensen (2008) Patience, J., Akeson, R. L., & Jensen, E. L. N. 2008, ApJ, 677, 616
- Phelps & Barsony (2004) Phelps, R. & Barsony, M. 2004, AJ, 127, 420
- Phillips, Lonsdale, & Feigelson (1991) Phillips, R. B., Lonsdale, C. J., & Feigelson, E. D. 1991, ApJ, 382, 261
- Pontoppidan (2006) Pontoppidan, K. M. 2006, A&A, 453, L47
- Pontoppidan et al. (2005) Pontoppidan, K. M., Dullemond, C. P., van Dishoeck, E. F., Blake, G. A., Boogert, A. C. A. et al. 2005, ApJ, 622, 463
- Pontoppidan et al. (2007) Pontoppidan, K. M., Stapelfeldt, K. R., Blake, G. A., van Dishoeck, E. F., & Dullemond, C. P. 2007, ApJ, 658, L111
- Preibisch et al. (2002) Preibisch, T., Brown, A. G. A., Bridges, T., Guenther, E., & Zinnecker, H. 2002, AJ, 124, 404
- Pudritz et al. (1996) Pudritz, R. E., Wilson, C. E., Carlstrom, J. E., Lay, O. P., Hills, R. E., & Ward-Thompson, D. 1996, ApJ, 470, L123
- Ratzka, Köhler, & Leinert (2005) Ratzka, T., Köhler, R., & Leinert, Ch. 2005, A&A, 437, 611
- Reipurth & Zinnecker (1993) Reipurth, B. & Zinnecker, H. 1993, A&A, 278, 81
- Remijan & Hollis (2006) Remijan, A. J. & Hollis, J. M. 2006, ApJ, 640, 842
- Ressler & Barsony (2001) Ressler, M. E. & Barsony, M. 2001, AJ, 121, 1098
- Ressler & Barsony (2003) Ressler, M. E. & Barsony, M. 2003, ApJ, 584, 832
- Richichi et al. (1994) Richichi, A., Leinert, Ch., Jameson, R., & Zinnecker, H. 1994, A&A, 287, 145
- Ridge et al. (2006) Ridge, N. A., Di Francesco, J., Kirk, H., Li, D., Goodman, A. A. et al. 2006, AJ, 131, 2921
- Rieke & Rieke (1990) Rieke, G. H. & Rieke, M. J. 1990, ApJ, 362, L21
- Robitaille et al. (2006) Robitaille, T. P., Whitney, B. A., Indebetouw, R., Wood, K., & Denzmore, P. 2006, ApJS, 167, 256
- Rodríguez et al. (2005) Rodríguez, L. F., Loinard, L., D’Alessio, P., Wilner, D. J., & Ho, P. T. P. 2005, ApJ, 621, L133
- Rydgren (1980) Rydgren, A. E. 1980, AJ, 85, 438
- Schöier et al. (2004) Schöier, F. L., Jorgensen, J. K., van Dishoeck, E. F., & Blake, G. A. 2004, A&A, 418, 185
- Sciortino et al. (2006) Sciortino, S., Pillitteri, I., Damiani, F., Flaccomio, E., Micela, G., et al. 2006, in Proceedings of The X-ray Universe 2005, ed. A. Wilson, ESA SP-604, Volume 1, 111
- Sekimoto et al. (1997) Sekimoto, Y., Tatematsu, K., Umemoto, T., Koyama, K., Tsuboi, Y., Hirano, N., & Yamamoto, S. 1997, ApJ, 489, L63
- Simon et al. (1987) Simon, M., Howell, R. R., Longmore, A. J., Wilking, B. A., Peterson, D. M., & Chen, W.-P. 1987, ApJ, 320, 344
- Simon et al. (1995) Simon, M., Ghez, A. M., Leinert, Ch., Cassar, L., Chen, W. P., Howell, R. R., Jameson, R. F., Matthews, K., Neugebauer, G., & Richichi, A. 1995, ApJ, 443, 625
- Simpson et al. (2004) Simpson, C. M., Claussen, M. J., Wilking, B. A., Wootten, H. A., & Marvel, K. B. 2004, BAAS, 36, 1567
- Slesnick et al. (2006) Slesnick, C. L., Carpenter, J. M., & Hillenbrand, L. A. 2006, AJ, 131, 3016
- Smith et al. (2005) Smith, M. D., Gredel, R., Khanzadyan, T., & Stanke, T. 2005, Mem. S. A. It., 76, 247
- Stanke et al. (2006) Stanke, T., Smith, M. D., Gredel, R., & Khanzadyan, T. 2006, A&A, 447, 609
- Stark et al. (2004) Stark, R., Sandell, G., Beck, S., Hogerheijde, M., van Dishoeck, E., van der Wal, P., van der Tak, F., Schäfer, F., Melnick, G., Ashby, M. & de Lange, G. 2004, ApJ, 608, 341
- Strom, Kepner, & Strom (1995) Strom, K. M., Kepner, J., & Strom, S. E. 1995, ApJ, 438, 813
- Struve & Rudkjøbing (1949) Struve, O. & Rudkjøbing, M. 1949, ApJ, 109, 92
- Terebey et al. (2001) Terebey, S., Van Buren, D., Hancock, T., Padgett, D., & Brundage, M. 2001, in ASP Conf. Ser. 243, From Darkness to Light: Origin and Evolution of Young Stellar Clusters, ed. T. Montmerle & Ph. André, 243
- Testi et al. (2002) Testi, L., Natta, A., Oliva, E., D’Antona, F., Comerón, F., & Baffa, C. 2002, ApJ, 571, L155
- Umemoto et al. (2002) Umemoto, T., Kamazaki, T., Sunada, K., Kitamura, Y., & Hasegawa, T. 2002, in The Proceedings of the IAU 8th Asian-Pacific Regional Meeting, Volume II, ed. S. Ikeuchi, J. Hearnshaw, and T. Hanawa, 229
- Vrba et al. (1975) Vrba, F. J., Strom, S. E., Strom, K. M., & Grasdalen, G. L. 1975, ApJ, 197, 77
- Vrba, Strom, & Strom (1976) Vrba, F. J., Strom, S. E., & Strom, K. M. 1976, AJ, 81, 958
- Vrba (1977) Vrba, F. J. 1977, AJ, 82, 198
- Walker et al. (1988) Walker, C. K., Lada, C. J., Young, E. T., & Margulis, M. 1988, ApJ, 332, 335
- Walter et al. (1994) Walter, F. M., Vrba, F. J., Mathieu, R. D., Brown, A., & Myers, P. C. 1994, AJ, 107, 692
- Ward-Thompson et al. (1989) Ward-Thompson, D., Robson, E. I., Whittet, D. C. B., Gordon, M. A., Walther, D. M., & Duncan, W. D. 1989, MNRAS, 241, 119
- Whittet (1974) Whittet, D. C. B. 1974, MNRAS, 168, 361
- Wilking (1991) Wilking, B. A. 1991, in Star Formation in Southern Molecular Clouds, ed. B. Reipurth, ESO Scientific Report No. 11, 159
- Wilking et al. (2001) Wilking, B. A., Bontemps, S., Schuler, R. E., Greene, T. P., & André, Ph. 2001, ApJ, 551, 357
- Wilking, Greene, & Meyer (1999) Wilking, B. A., Greene, T. P., & Meyer, M. R. 1999, AJ, 117, 469
- Wilking & Lada (1983) Wilking, B. A. & Lada, C. J. 1983, ApJ, 274, 698
- Wilking, Lada, & Young (1989) Wilking, B. A., Lada, C. J., & Young, E. T. 1989, ApJ, 340, 823
- Wilking, Meyer, & Greene (2008) Wilking, B. A., Meyer, M. R., & Greene, T. P. 2008, in preparation
- Wilking et al. (2005) Wilking, B. A., Meyer, M. R., Robinson, J. G., & Greene, T. P. 2005, AJ, 130, 1733
- Wilking, Schwartz, & Blackwell (1987) Wilking, B. A., Schwartz, R. D., & Blackwell, J. H. 1987, AJ, 94, 106
- Wilking et al. (1997) Wilking, B. A., Schwartz, R. D., Fanetti, T. M., & Friel, E. D. 1997, PASP, 109, 549
- Williams et al. (1995) Williams, D. M., Comerón, F., Rieke, G. H., & Rieke, M. J. 1995, ApJ, 454, 144
- Wilson et al. (1999) Wilson, C. D., Avery, L. W., Fich, M., Johnstone, D., Joncas, G., Knee, L. B. G., Matthews, H. E., Mitchell, G. F., Moriarty-Schieven, G. H., & Pudritz, R. E. 1999, ApJ, 513, 139
- Wootten & Loren (1987) Wootten, H. A. & Loren, R. B. 1987, ApJ, 317, 220
- Wootten (1993) Wootten, A. 1993, in Astrophysical Masers, ed. A. W. Clegg & G. E. Nedoluha, (Berlin/Heidelberg: Springer), 315
- Wootten et al. (1999) Wootten, A., Claussen, M., Marvel, K., & Wilking, B. 1999, in The Physics and Chemistry of the Interstellar Medium, Proceedings of the 3rd Cologne-Zermatt Symposium, eds. V. Ossenkopf, J. Stutzki, and G. Winnewisser, 295
- Wu et al. (2002) Wu, J., Wang, M., Yang, J., Deng, L., & Chen, J. 2002, AJ, 123, 1986
- Ybarra et al. (2006) Ybarra, J. E., Barsony, M., Haisch, K. E., Jarrett, T. H., Sahai, R., & Weinberger, A. J. 2006, ApJ, 647, L159
- Yeh et al. (2008) Yeh, S., Hirano, N., Bourke, T., Ho, P., Lee, C.-F., Ohashi, N., & Takakuwa, S. 2008, ApJ, 675, 454
- Young, Lada, & Wilking (1986) Young, E. T., Lada, C. J., & Wilking, B. A., ApJ, 304, L45
- Young et al. (2006) Young, K. E., Enoch, M. L., Evans, N. J., II, Glenn, J., Sargent, A., et al. 2006, ApJ, 644, 326
- Zhang, Wootten, & Ho (1997) Zhang, Q., Wootten, A., & Ho, P. T. P. 1997, ApJ, 475, 713
Appendix A: Description of Table 1
A list of association members in the L1688 cloud is presented in Table 1 (see footnote in Section 4 for electronic access to Table 1). Selection of objects for Table 1 is described in Section 4. All of the objects listed in Table 1 appear in the 2MASS catalog with, at minimum, a detection in the Ks band. In addition to their positions and J, H, and Ks magnitudes from the 2MASS catalog (col. 1-13), we list source names from selected surveys including H surveys of Struve & Rudkjøbing (1949, SR) and Wilking, Schwartz, & Blackwell (1987, WSB); near-infrared surveys of Vrba et al. (1975, VSSG) and Greene & Young (1992, GY); and far-infrared surveys of Bontemps et al. (2001, ISO-Oph) and Allen et al. (2008, IRAC). Names listed under “Other” (column 21) include selected identifications used in the literature from the H survey of Dolidze & Arakelyan (1959, DoAr); the optical surveys of Chini (1981, C), Bouvier & Appenzeller (1992, ROX) Martín et al. (1998, MMGC); the infrared surveys of Grasdalen, Strom, & Strom (1973, GSS or Source), Vrba, Strom, & Strom (1976, VSS II), Elias (1978, EL), Wilking & Lada (1983, WL), Wilking, Lada, & Young (1989, WLY), Comerón et al. (1993, CRBR), Strom, Kepner, & Strom (1995, SKS), or Allen et al. (2002, AMD); or the radio continuum survey of Leous et al. (1991, LFAM); “FS” refers to the YSO with an edge-on circumstellar disk discovered by Grosso et al. (2003) dubbed the “Flying Saucer”. Columns 22 and 23 list the X-ray identifications from the Einstein survey by Montmerle et al. (1983, ROX); the ROSAT survey by Casanova et al. (1995, ROXR1), Grosso et al. (2000, ROXRA or ROXRF), Martín et al. (1998, RXJ); the ASCA survey by Kamata et al. (1997, ROXA); the Chandra survey by Imanishi et al. (2001, IKT2001), Gagné et al. (2004, GDS), or N. Grosso (2005, ROXC, private communication); or observations with XMM-Newton by Bouy, H. (2004, XMM) or Ozawa, Grosso, & Montmerle (2005, ROXN). Preference was given to sources observed by the higher resolution ROSAT or CHANDRA telescopes. SED classifications are given in columns 24 and 25 for IRAC and IRAC/MIPS data from the Spitzer Space Telescope. For the latter, Class I sources (I) have a spectral index from 3.6 to 24 m of a0.3, flat-spectrum sources (F) have -0.3a0.3, and Class II sources (II) have -1.6a-0.3. Spectral types are given in columns 26 and 27 for optical spectra from the studies of Cohen & Kuhi (1979, CK79), Bouvier & Appenzeller (1992, BA92), Walter et al. (1994, W94), Luhman, Liebert, & Rieke (1997, LLR97), Martín et al. (1998, MMGC), Wilking et al. (2005, W05), Slesnick et al. (2006, S06), or Geers et al. (2007a, G07), and for infrared spectra from the studies of Greene & Meyer (1995, GM95), Greene & Lada (1997, GL97), Wilking, Greene, & Meyer (1999, WGM99), Luhman & Rieke (1999, LR99), Cushing, Tokunaga, & Kobayashi (2000, CTK00), Natta et al. (2002, N02), or Wilking, Meyer, & Greene (2008, WMG07). Criteria met for association membership are listed in column 29 (see text for explanation of symbols). The last column notes whether the source has companions within 10′′ (1300 AU) with “B” indicating a binary, “T” a triple, and “SB” a spectroscopic binary, followed by the reference. When both members of a wide binary appear as separate entries in the table, no note appears in column 29 (e.g., SR 24N and SR 24S). References for multiplicity include Ghez, Neugebauer, & Matthews (1993, G93), Haffner & Meyer (1995, HM95), Barsony, Koresko, & Matthews (2003, B03), Ageorges et al. (1997, A97), Reipurth & Zinnecker (1993, RZ93), Allen et al. (2002, A02), Chelli et al. (1988, C88), Duchêne et al. (2004, D04), Richichi et al. (1994, R94), Barsony et al. (1989, B89), Costa et al. (2000, C00), Simon et al. (1995, S95), Simon et al. (1987, S87), Haisch et al. (2002, H02), and Terebey et al. (2001, T01).