The Optical Variability of the Quasar 3C 279: The Signature of a Decelerating Jet?
Abstract
A recent optical monitoring campaign on the prominent quasar 3C 279 revealed at least one period of a remarkably clean exponential decay of monochromatic (BVRI) fluxes with time, with a time constant of d, over about 14 days. This is clearly too long to be associated with radiative cooling. Here we propose that this may be the signature of deceleration of the synchrotron emitting jet component. We develop a model analogous to the relativistic blast wave model for gamma-ray bursts, including radiative energy losses and radiation drag, to simulate the deceleration of a relativistically moving plasmoid in the moderately dense AGN environment. Synchrotron, SSC and external Compton emission are evaluated self-consistently. We show that the observed optical light curve decay can be successfully reproduced with this model.
The decelerating plasmoid model predicts a delayed X-ray flare, about 2 – 3 weeks after the onset of the quasi-exponential light curve decay in the optical. A robust prediction of this model, which can be tested with Fermi and simultaneous optical monitoring, is that the peak in the -ray light curve at MeV is expected to be delayed by a few days with respect to the onset of the optical decay, while the VHE -rays are expected to track the optical light curve closely with a delay of at most a few hours.
1 Introduction
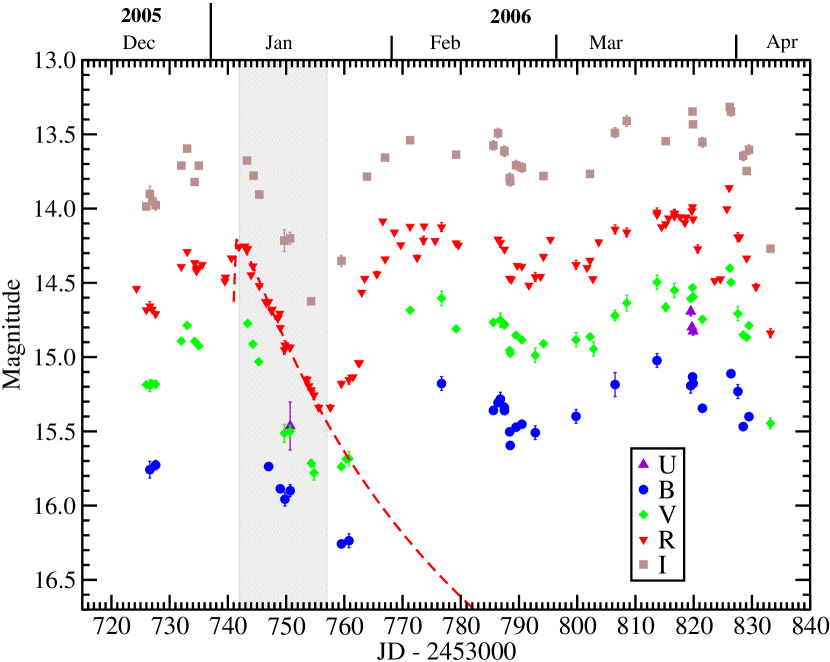
The quasar 3C 279 () is one of the best-observed flat spectrum radio quasars, in part because of its prominent -ray flare shortly after the launch of the Compton Gamma-Ray Observatory (CGRO) in 1991. It has been persistently detected by the Energetic Gamma-ray Experiment Telescope (EGRET) on board CGRO each time it was observed, even in its very low quiescent states, e.g., in the winter of 1992 – 1993, and is known to vary in -ray flux by roughly two orders of magnitude (Maraschi et al., 1994; Wehrle et al., 1998). It has been monitored intensively at radio, optical, and more recently also X-ray frequencies, and has been the subject of intensive multiwavelength campaigns (e.g., Maraschi et al., 1994; Hartman et al., 1996; Wehrle et al., 1998). The most recent multiwavelength campaign on 3C 279 included a Whole Earth Blazar Telescope (WEBT) campaign in the spring of 2006 (Böttcher et al., 2007b). During this campaign, the source was overall in a high optical state, with – . However, the light curves showed an extraordinary feature: An unusually clean, quasi-exponential decay of the BVRI fluxes with a time scale of d, extended over about 2 weeks. This paper aims at a theoretical interpretation of this extraordinary light curve feature.
Flat-spectrum radio quasars (FSRQs) and BL Lac objects are active galactic nuclei (AGNs) commonly unified in the class of blazars. They exhibit some of the most violent high-energy phenomena observed in AGNs to date. Their spectral energy distributions (SEDs) are characterized by non-thermal continuum spectra with a broad low-frequency component in the radio – UV or X-ray frequency range and a high-frequency component from X-rays to -rays. In the framework of relativistic jet models, the low-frequency (radio – optical/UV) emission from blazars is interpreted as synchrotron emission from nonthermal electrons in a relativistic jet. The high-frequency (X-ray – -ray) emission could either be produced via Compton upscattering of low frequency radiation by the same electrons responsible for the synchrotron emission (leptonic jet models; for a recent review see, e.g., Böttcher, 2007a), or due to hadronic processes initiated by relativistic protons co-accelerated with the electrons (hadronic models, for a recent discussion see, e.g., Mücke & Protheroe, 2001; Mücke et al., 2003). Several authors have modeled broadband SEDs of 3C 279 in various states (e.g., Bednarek, 1998; Sikora et al., 2001; Hartman et al., 2001; Moderski et al., 2003). A consistent picture emerges that the X-ray – soft -ray portion of the SED might be dominated by synchrotron self-Compton (SSC) emission, while the EGRET emission might require an additional component, most likely external Compton emission.
Standard leptonic models of blazar emission generally assume that a relativistic plasmoid containing ultrarelativistic nonthermal electrons moves with constant bulk Lorentz factor along a jet, directed at a small angle with respect to our line of sight. However, for several blazars, in particular high-frequency peaked BL Lac objects detected at GeV -rays, such models sometimes require unexpectedly large bulk Lorentz factors () and accordingly small viewing angles in order to explain their SEDs and variability (Begelman et al., 2008; Ghisellini & Tavecchio, 2008; Finke et al., 2008). Such large Lorentz factors and small viewing angles pose serious problems for AGN unification schemes, according to which FR I radio galaxies are believed to be the unbeamed equivalents of BL Lac objects. A possible solution to this dilemma might lie in the deceleration of the emission region (Georganopoulos & Kazanas, 2003a, b) from sub-pc scales, at which the optical – X-ray – -ray emission is produced, towards pc and kpc scales, which can be resolved with VLBA / VLBI techniques. At those scales, superluminal speeds of individual jet components of are characteristically observed in most cases, providing an estimate of the Lorentz factor of jet components at those scales of . In fact, extreme deceleration of a radio-emitting plasmoid (component C3) in the jet of 3C 279 may already habe been directly observed in space VLBI monitoring observations (Piner et al., 2000), although the identification of this component over multiple observing epochs with different instruments/arrays is highly uncertain.
In this paper, we propose a model analogous to the relativistic blast wave model which has successfully predicted and explained the smooth, self-similar light curves of X-ray and optical afterglows of -ray bursts (Paczyński & Roads, 1993; Mészáros & Rees, 1997; Chiang & Dermer, 1999). We adapt this model for the specific situation in blazars. In particular, we include self-consistently radiative losses and radiation drag from Comptonization of external radiation fields. A similar study, with emphasis on the details of the isotropization of particle distributions in the plasmoid and on spectral features from various leptonic and hadronic processes, has been performed by Pohl & Schlickeiser (2000), who find good agreement of their results with characteristic SEDs of blazars. Here, we adopt a simplified description of the particle dynamics and radiation processes, and focus on the expected monochromatic light curves dominated by the plasmoid deceleration. We review the observational motivation from 3C 279 in §2, describe the model for the plasmoid dynamics in §3, and outline our treatment of radiation processes in §4. As a test of our numerical simulations, we develop an analytical solution to the plasmoid dynamics and light curves in the self-similar deceleration phase in §5. In §6 we present results of our simulations and fits to the observed exponential flux decay of 3C 279 in January 2006. We summarize in §7.
Throughout this paper, we refer to as the energy spectral index, [Jy] . A cosmology with , , and km s-1 Mpc-1 is used. In this cosmology, and using the redshift of , the luminosity distance of 3C 279 is Gpc.
2 Observational Motivation
3C 279 was observed in a WEBT campaign at radio, near-IR, and optical frequencies, throughout the spring of 2006. Details of the observations, data analysis, and implications of the optical variability patterns observed during that campaign have been published in Böttcher et al. (2007b). Fig. 1 shows the optical light curves of 3C 279 during spring 2006. The light curves exhibit an extraordinarily clean quasi-exponential decay with a characteristic time scale of days around JD 2453743 – JD 2453760. This light curve feature can not be interpreted as the signature of radiative cooling since the synchrotron cooling time scale for electrons emitting synchrotron radiation in the optical R band is
| (1) |
where is the magnetic field in Gauss and is the Doppler factor in units of 10. This is of the order of at most a few hours for typical values of the magnetic field strength expected in quasars ( G). Setting the synchrotron cooling time scale equal to the observed exponential decay time scale, would require a magnetic field of G, which is about three orders of magnitude lower than usually inferred for quasar jets. We therefore favor a model in which the light curve decay is associated with the dynamics of the emission region rather than microscopic processes. We note that similar quasi-exponential decays have also been observed in 3C 279 repeatedly in the 2007 observing season (Larionov et al., 2008).
3 Model of a decelerating jet
Our treatment of a decelerating jet is borrowed from the blast wave model of gamma-ray bursts. For details see, e.g., Chiang & Dermer (1999). We assume a plasmoid moving ballistically with initial mass and bulk Lorentz factor along the jet. Let be the relativistic mass of the the plasmoid in the rest-frame of the plasmoid, then the momentum of the plasmoid in the stationary AGN frame is , where is the normalized velocity corresponding to the bulk Lorentz factor . If the plasmoid radiates isotropically in its rest frame, the equation of motion of the plasmoid can be derived from momentum conservation, . However, in the case of a quasar, a substantial contribution to the (bolometrically dominant) -ray emission results from Compton upscattering of external radiation fields (EC = External Compton), and a significant transfer of plasmoid momentum to Compton-scattered external radiation (“Compton drag”) has to be taken into account. We can therefore write
| (2) |
For large enough , most of the EC radiation will be beamed into a narrow cone of solid angle , and we can write the momentum transfer to EC radiation as
| (3) |
where is the internal energy loss due to EC radiation in the co-moving frame. For the purpose of an approximate, quantitative analysis to extract the salient spectral and light curve features of this model, we assume that all Compton scattering occurs in the Thomson regime so that
| (4) |
The factor in Eq. (4) stems from the fact that constitutes a derivative with respect to time in the stationary AGN frame, and . We can also use Eq. (3) for a rough estimate of the magnitude of the radiation drag force, assuming that the observed -ray emission results from Compton scattering of an isotropic radiation field. Then,
| (5) |
where Jy Hz) and . This may be compared to an estimate for the Compton rocket effect due to radiation from the accretion disk. If we approximate the accretion disk radiation as a point source (the most optimistic estimate) with luminosity erg s-1, impinging from behind on an emission region of radius cm, located at a distance pc from the accretion disk, the force on the plasmoid due to the Compton rocket effect can be estimated as
| (6) |
Thus, for standard parameters with pc and erg s-1, the Compton rocket effect may safely be neglected in our calculations.
The accumulation and radiative loss of relativistic mass can be calculated as
| (7) |
where , is the cross section of the jet, is the density of external material being swept up by the plasmoid, and
| (8) |
Here, is the sum of the energy densities, , and, again, we have assumed Compton scattering to be dominated in the Thomson regime.
Derivatives with respect to time can be converted to derivatives with respect to distance from the central engine, yielding
| (9) |
and
| (10) |
We assume that a fraction of the swept-up electrons will be instantaneously accelerated into a power-law, which can be described by an injection function of the form
| (11) |
where for and 0 otherwise. The low- and high-energy cutoffs of the electron injection function are given by
| (12) |
where is the fraction of swept-up power that is transferred to relativistic electrons, is the fraction of swept-up electrons which is accelerated to ultrarelativistic energies. The maximum Lorentz factor can be estimated by balancing the fastest conceivable acceleration time scale (the Larmor time scale) with the synchrotron loss time scale:
| (13) |
where is the magnetic field in Gauss. The magnetic field may be parameterized in terms of a fraction of the swept-up energy transferred to magnetic-field energy density:
| (14) |
where an additional factor of 4 has been introduced to account for the compression of the pre-shock material by the strong shock. We can find the normalization of the electron injection function through
| (15) |
Eq. (1) indicates that the characteristic radiative cooling time scales of particles emitting synchrotron radiation at optical or higher frequencies are likely to be much shorter than the dynamical time scale of the system. Therefore, the balance of relativistic particle acceleration, cooling, and escape on a time scale
| (16) |
yields a critical electron energy beyond which particles effectively radiate their energy away on a time scale shorter than the escape time scale:
| (17) |
The resulting quasi-equilibrium electron energy distribution will be a broken powerlaw with parameters depending on whether (slow-cooling regime) or (fast-cooling regime). Re-writing the radiative cooling rate as with we find for the slow-cooling regime
| (18) |
In the fast-cooling regime, we have
| (19) |
The apparent large break in the spectral index around the synchrotron peak in the SED of 3C 279 indicates that this peak can not be attributed to a cooling break, but rather to a large value of , and the system is in the fast-cooling regime (Böttcher, Reimer, & Marscher, 2008). Eqs. (12) and (17) naturally yield values that support the assumption of the fast-cooling regime for plausible parameter values:
| (20) |
where , while
| (21) |
where we have only taken into account Compton cooling on the external radiation field for a characteristic value of as given in Eq. (42). Consequently, as long as (formally) , which will be the case for all plausible parameter values, even when the plasmoid becomes non-relativistic.
4 Radiation
The relativistic electrons described by the distribution functions (18) and (19), will emit synchrotron, synchrotron-self-Compton (SSC) and EC radiation. For simplicity, we express the synchrotron emissivity using a function approximation:
| (22) |
where with G, and . The corresponding photon number density is
| (24) |
with and for the slow-cooling regime and and for the fast-cooling regime, we can express the photon energy density as
| (25) |
| (26) |
with
| (27) |
and
| (28) |
where
| (29) |
We evaluate the external-Compton photon spectrum with a function approximation for the external radiation field,
| (30) |
where refers to the angle of incidence of the external photons with respect to the jet axis, and . The Compton cross section is also approximated by a function,
| (31) |
With these simplifications, the EC flux can be calculated as
| (32) |
5 Asymptotic Behaviour in the Deceleration Phase
As in the well-known case of expanding blast waves in Gamma-Ray Bursts (GRBs), the plasmoid in a decelerating jet (with constant cross section ) is starting out in a coasting phase, in which the initial mass greatly exceeds the swept-up relativistic mass in the co-moving frame. During this phase, the effect of the inertia of the swept-up mass is negligible, and the Lorentz factor remains roughly constant. This phase is followed by the deceleration phase. In the asymptotic limit of that phase, the initial mass of the plasmoid becomes negligible.
Although we have properly included the effect of radiative cooling and radiation drag, in most cases the fraction of swept-up energy which is transferred to ultrarelativistic electrons and can therefore be radiated away efficiently, will be small. Therefore, we can approximate the equation of motion of the plasmoid by an adiabatic solution, as
| (33) |
and
| (34) |
where we have, for simplicity, assumed a constant external density const. This system has a self-similar solution of the form
| (35) |
Assuming for the purpose of an analytic estimate that we are looking right down the jet (), the observer’s time as a function of Lorentz factor can be expressed as
| (36) |
This yields a solution for the Lorentz factor as a function of observer’s time:
| (37) |
The observed steep spectral index of the optical synchrotron emission from 3C 279 (), indicates . This, in turn, signifies that the system is in the fast cooling regime since otherwise a cooling break would not produce a peak at the synchrotron frequency corresponding to . Furthermore, electrons synchrotron radiating at optical frequencies are most likely beyond the break energy, i.e., . For the prediction of synchrotron light curves we may therefore use Eq. 22 together with the lower branch of Eq. 19. For , the coefficient in Eq. 19 may be approximated as
| (38) |
The cooling coefficient is expected to be dominated by synchrotron and/or external Compton cooling. With the magnetic-field scaling from Eq. 14, both and carry a dependence . Thus, we find for the normalization of the ultrarelativistic particle population:
| (39) |
In order to use Eq. 22 for a light curve estimate, we assume, again, for simplicity, and therefore . Consequently, the characteristic electron energy . This yields an expected light curve decay in the fast-cooling synchrotron regime of
| (40) |
In particular, for an injection index of , as inferred from the optical spectral index, a light curve of is expected. However, it should be pointed out that this can only be considered an upper limit to the steepness of the decay. Any non-zero observing angle will flatten the decay of the light curve as it introduces a shallower decay of the Doppler factor with decreasing and therefore with time. In any case, by the time the plasmoid is in the self-similar deceleration phase, the monochromatic flux has already decreased by about an order of magnitude from its initial peak value, and is likely to be overwhelmed by other emission components in the jet. We do therefore not expect to observe the limiting deceleration case directly. We only developed this analytical case to demonstrate the agreement of our numerical simulations with the analytical expectation in the following section.
6 Numerical Results
In order to highlight the salient features of our model, we assume a simple cylindrical jet geometry with a constant cross section of the jet, , as well as a homogeneous external medium with density . We achieved good fits to the observed optical light curves and overall SED shape of 3C 279 with the parameters listed in Table 1. Our choice of the external density corresponds to a number density of cm-3. This is at least about an order of magnitude lower than typical particle densities in the broad line regions of quasars. This is quite reasonable since we expect that the jet trajectory is already partially evacuated from previous ejection events.
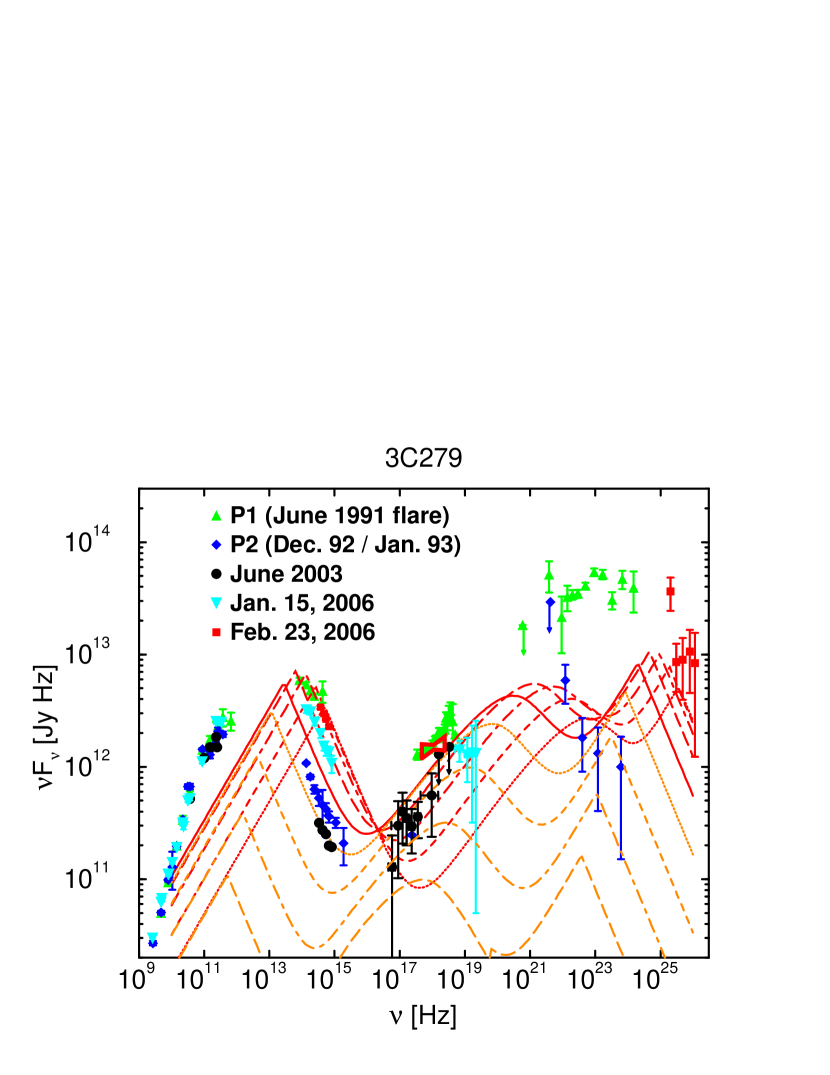
Fig. 2 compares snap-shot SEDs of our simulation to various observed broadband SEDs of 3C 279. It can be seen that the optical continuum spectra in various intensity states are well represented by the model, the X-ray spectral slope corresponds to the characteristically observed shape, and for much of the plasmoid evolution, the simulated X-ray flux is in the range of observed values. The -ray flux represented by our simulation corresponds to a medium to low state of 3C 279. Note that this work is not intended to attempt a model interpretation of the very-high-energy -ray flux detected by MAGIC on Feb. 23, 2006 (Albert et al., 2008), in particular since we did not take into account any effects of intrinsic or intergalactic absorption. For model implications of this high-energy detection see Böttcher, Reimer, & Marscher (2008).
The upper panel in figure 3 illustrates the evolution of the plasmoid bulk Lorentz factor as a function of distance from the central engine, obtained by numerically solving the coupled system of Eqs. (9) and (10).
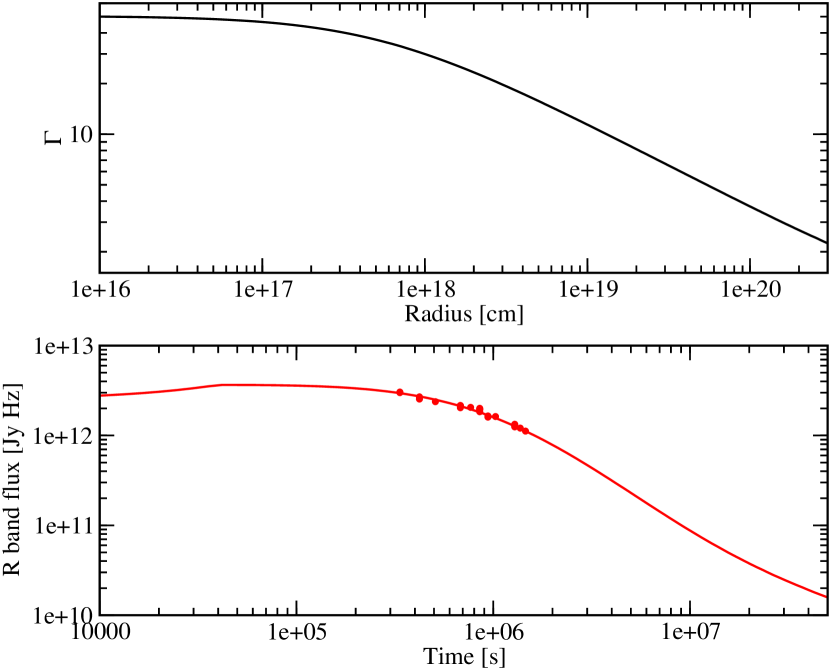
As in the well-known case of the blast-wave model for gamma-ray bursts, the plasmoid evolves through a coasting phase with approximately constant Lorentz factor . Around the characteristic deceleration radius , at with the swept-up relativistic mass equals the mass of the initial ejecta , the evolution makes a gradual transition into the asymptotic self-similar deceleration phase with , treated analytically in §5. For the input parameters listed in Table 1, this occurs at
| (41) |
Note, however, that substantial deceleration happens long before is reached. The lower panel of Fig. 3 shows the resulting R-band light curve over the entire evolution of the plasmoid, down to a mildly relativistic speed. Again, we see the gradual turnover to the self-similar deceleration phase with the expected light curve decay as (see §5). During the transition from the coasting to the self-similar deceleration phase, the light curve is reasonably well represented by an exponential decay.
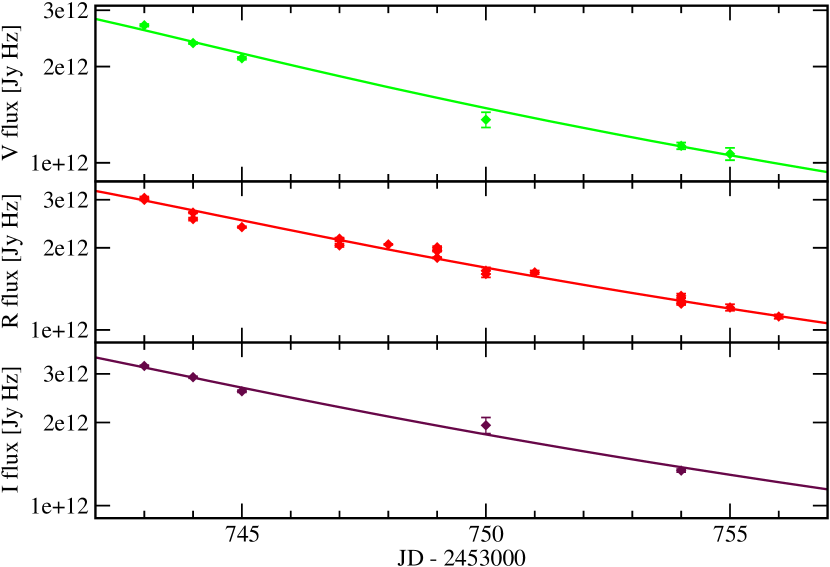
The detailed fits to the V, R, and I band light curves of 3C 279 during the quasi-exponential decay around January 15, 2006, are shown in Fig. 4. The B and U band light curves were rather poorly sampled during this time period so that the (equally good) fits to those light curves does not provide substantial additional information.
Using characteristic parameters for the accretion disk luminosity, ergs s-1 and the Thomson depth and radius pc of the BLR of 3C 279, we estimate an external radiation energy density of
| (42) |
and (see, e.g., Böttcher, Reimer, & Marscher, 2008), which we use for our calculation of the EC -ray emission component and the associated radiation drag term. The predicted light curves of the combined SSC + EC emissions at X-rays and -rays are compared to the R-band light curves in Fig. 5.
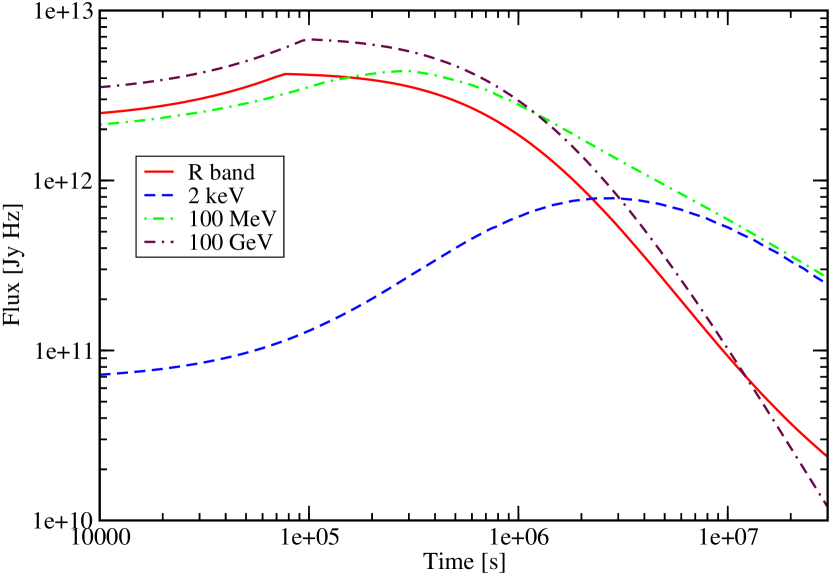
The most remarkable feature of the predicted light curves is a delayed X-ray outburst about 2 – 3 weeks after the onset of the optical decline. This is a consequence of the shift of the SSC peak towards lower frequencies as the blob decelerates, which follows from the dependence . This SSC peak frequency decrease is much more rapid than the decrease of the SSC peak flux. This spectral evolution of the SSC component is illustrated in Fig. 2. In fact, RXTE monitoring of the source (see Böttcher, Reimer, & Marscher, 2008) did detect a transition of 3C 279 from a quiescent state throughout the first half of January 2006, to a very active, high X ray flux state with a substantial X-ray outburst around Feb. 5, 2006. It is tempting to postulate that this may have been the X-ray signature of the plasmoid deceleration observed during the optical decay around January 15.
A prediction of this scenario is that the MeV -ray light curve peaks a few days after the optical before it begins its quasi-exponential decay. This is a consequence of the fact that this energy range consists of comparable contributions from the SSC and the EC radiation components. As the SSC component shifts towards lower energies during the early deceleration, the EC component just moves into the 100 MeV range, before it also decays away to lower peak energies and lower flux levels. The very-high-energy ( GeV) light curve is expected to follow closely the optical one, with only a small delay, which critically depends on the initial bulk Lorentz factor and the mean photon energy of the external photon field.
We caution that any predictions concerning absolute flux levels at X-rays and -rays are very model-parameter dependent and vary substantially for different choices of initial mass, initial bulk Lorentz factor, initial pladmoid radius, external matter density, external radiation field, etc. Furthermore, we have not included any effects of intrinsic (in particular, in the radiation field of the BLR, see, e.g., Donea & Protheroe, 2003; Reimer, 2007; Sitarek & Bednarek, 2008), nor intergalactic absorption. However, while this may significantly affect the overall -ray flux level, the light curve features discussed above are predominantly a consequence of the plasmoid dynamics, which are dictated by the observed optical light curves, and are therefore robust predictions of the decelerating-jet model.
7 Summary and Conclusions
Motivated by an extraordinarily clean quasi-exponential decay of the V, R, and I band light curves of 3C 279 over a period of about 2 weeks during a recent WEBT campaign, we proposed a model of a decelerating plasmoid in the jet of this quasar. We take into account self-consistently the inertia of swept-up mass as the plasmoid propagates through the gas of the AGN environment, as well as radiation drag and radiative cooling. We have demonstrated that, similar to the relativistic blast wave model for GRBs, the plasmoid makes a transition from a coasting phase with approximately constant Lorentz factor, to a self-similar phase. In the case of a homogeneous external medium and a cylindrical jet, the self-similar deceleration phase is described by . The resulting optical synchrotron light curves are well approximated by quasi-exponential decays during the transition from the coasting to the self-similar decay phase. In the asymptotic limit of the self-similar decay phase, the synchrotron light curves at frequencies corresponding to electron energies above the cooling break of the electron spectrum follow a behaviour of , where is the injection spectral index of ultrarelativistic electrons in the plasmoid.
We note that the choice of a conical jet instead of a cylindrical one would recover the isotropic blast wave model for gamma-ray bursts (e.g., Chiang & Dermer, 1999): It would lead to a scaling of the plasmoid surface as . In the self-similar deceleration phase, this recovers the well-known adiabatic blast wave solution with . This case describes a much faster deceleration of the plasmoid and therefore substantially steeper light curves than the cylindrical jet geometry assumed here.
We have demonstrated that this model can adequately reproduce the observed optical light curves of 3C 279 during the week long quasi-exponential decay phase in January 2006. This model predicts a delayed (SSC-dominated) X-ray outburst about 2 – 3 weeks after the onset of the optical decay. We speculate that the X-ray flare around Feb. 5, 2006, detected by RXTE monitoring, may have been the X-ray signature of the plasmoid deceleration seen earlier in the optical bands.
A robust prediction of the decelerating plasmoid model which can be tested with Fermi and simultaneous optical monitoring is that the peak in the -ray light curve at MeV is expected to be delayed by a few days with respect to the onset of a quasi-exponential light curve decay in the optical, while the VHE -rays are expected to track the optical light curve closely.
The quasar 3C 279 is one of the most active blazars known. The ejection of -ray emitting plasmoids from the nucleus of 3C 279 might be a frequent event. We do therefore expect to observe the quasi-exponential decay phase following such ejection events only in a temporary quiescent phase, in which it is not overwhelmed by subsequent ejection events. This might be the reason why these quasi-exponential decays in the light curves of this blazar are not more frequently observed. In addition to one or two occurrences during the 2006 WEBT campaign, several more quasi-exponentially decaying light curve segments can also be identified in the 2007 WEBT campaign data (Larionov et al., 2008), indicating that these are rare, but not unique events.
References
- Albert et al. (2008) Albert, J., et al., 2008, Science, vol. 320, no. 5884, p. 1752
- Bednarek (1998) Bednarek, W., 1998, A&A, 336, 123
- Begelman et al. (2008) Begelman, M. C., Fabian, A. C., & Rees, M. J., 2008, MNRAS, 384, L19
- Böttcher, Mause, & Schlickeiser (1997) Böttcher, M., Mause, H., & Schlickeiser, R., 1997, A&A, 324, 395
- Böttcher & Bloom (2000) Böttcher, M., & Bloom, S. D., 2000, AJ, 119, 469
- Böttcher (2007a) Böttcher, M., 2007a, in proc. “The Multimessenger Approach to Gamma-Ray Sources”, ApSS, 309, 95
- Böttcher et al. (2007b) Böttcher, M., et al., 2007, ApJ, 670, 970
- Böttcher, Reimer, & Marscher (2008) Böttcher, M., Reimer, A. F., & Marscher, A. P., 2008, ApJ, submitted
- Chiang & Dermer (1999) Chiang, J., & Dermer, C. D., 1999, ApJ, 512, 699
- Donea & Protheroe (2003) Donea, A.-C., & Protheroe, R. J., 2003, Astrop. Phys., vol. 18, Issue 4, p. 337
- Finke et al. (2008) Finke, J. D., Dermer, C. D., & Böttcher, M., 2008, ApJ, in press (arXiv:0802.1529)
- Georganopoulos & Kazanas (2003a) Georganopoulos, M., & Kazanas, D., 2003a, ApJ, 589, L5
- Georganopoulos & Kazanas (2003b) Georganopoulos, M., & Kazanas, D., 2003b, ApJ, 594, L27
- Ghisellini & Tavecchio (2008) Ghisellino, G., & Tavecchio, F., 2008, MNRAS, 386, L28
- Hartman et al. (1996) Hartman, R. C., et al., 1996, ApJ, 461, 698
- Hartman et al. (2001) Hartman, R. C., et al., 2001, ApJ, 553, 683
- Jones (1968) Jones, T. W., 1968, Phys. Rev., 167, 1159
- Larionov et al. (2008) Larionov, V. M., et al., 2008, A&A, submitted
- Maraschi et al. (1994) Maraschi, L., et al., 1994, ApJ, 435, L91
- Mészáros & Rees (1997) Mészáros, P., & Rees, M. J., 1997, ApJ, 476, 232
- Moderski et al. (2003) Moderski, R., Sikora, M., Blazejowski, M., 2003, A&A, 406, 855
- Mücke & Protheroe (2001) Mücke, A., & Protheroe, R. J., 2001, Astropart. Phys., 15, 121
- Mücke et al. (2003) Mücke, A., Protheroe, R. J., Engel, R., Rachen, J. P., & Stanev, T., 2003, Astropart. Phys., 18, 593
- Paczyński & Roads (1993) Paczyński, B., & Roads, J., 1993, ApJ, 418, L5
- Piner et al. (2000) Piner, B. G., Edwards, P. G., Wehrle, A. E., Hirabayashi, H., Lovell, J. E. J., & Unwin, S. C., 2000, ApJ, 537, 91
- Pohl & Schlickeiser (2000) Pohl, M., & Schlickeiser, R., 2000, A&A, 354, 395
- Reimer (2007) Reimer, A., 2007, ApJ, 665, 1023
- Sikora et al. (2001) Sikora, M., Blazejowski, M., Begelman, M. C., & Moderski, R., 2001, ApJ, 554, 1; Erratum: ApJ, 561, 1154 (2001)
- Sitarek & Bednarek (2008) Sitarek, J., & Bednarek, W., 2008, MNRAS, in press (arXiv:0807.4228)
- Wehrle et al. (1998) Wehrle, A. E., et al., 1998, ApJ, 497, 178
| Parameter | Symbol | Value |
|---|---|---|
| Initial Lorentz factor | ||
| External matter density | cm-3 | |
| Plasmoid radius | cm | |
| Initial mass | g | |
| Electron injection index | ||
| B-field equipartition parameter | ||
| Electron acceleration efficiency | ||
| Relativistic electron fraction | ||
| Electron escape time scale parameter | ||
| External radiation energy density | erg cm-3 | |
| Observing angle |