Erratum: “A Second Case of Variable Na I D Lines in a Highly-Reddened Type Ia Supernova” (2009, ApJ, 693, 207)
††slugcomment: Accepted for publication in ApJ1. No variable Na I D lines in SN 1999cl
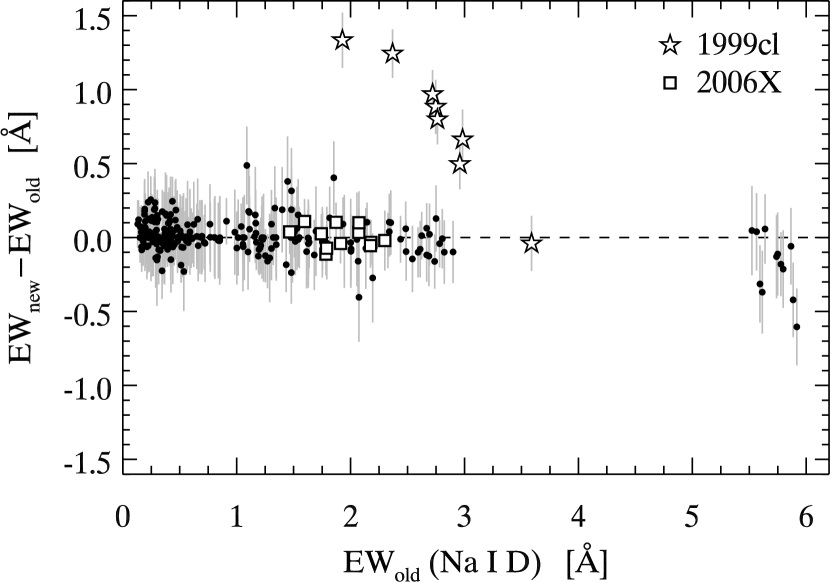
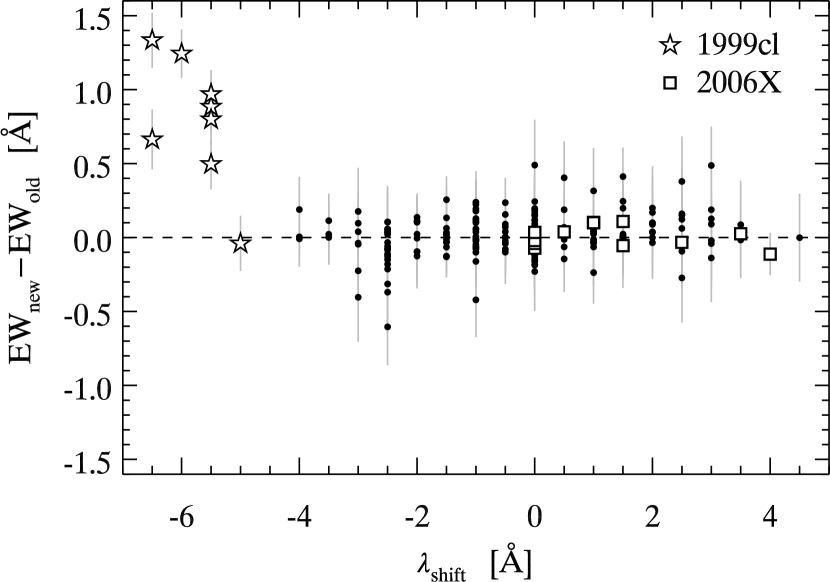
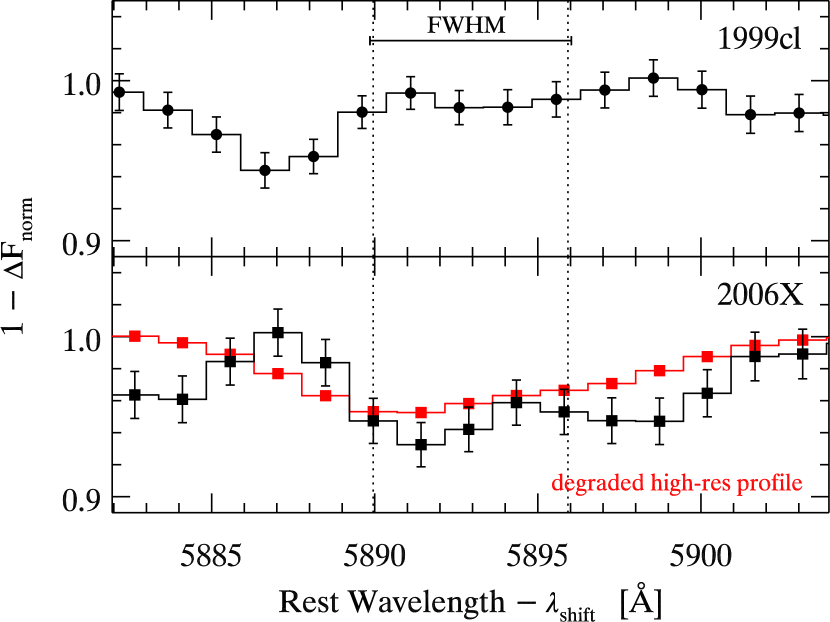
The large variation in the Na I D equivalent width (EW) observed in the Type Ia SN 1999cl (Blondin et al., 2009), Å, results in fact from a measurement error. The origin of this error was traced back to observed wavelength shifts of the Na I D profile with respect to its expected restframe location (5889.95 and 5895.92 Å for the D2 and D1 lines, respectively), which were not properly taken into account in a revised implementation of our EW computation (albeit correctly displayed on the graphical interface developed for these measurements; see Fig. 1). We revised all the measurements in the original paper, and can confirm that SN 1999cl is the only object of our sample affected by this error (see Fig. 2). In particular, measurements for SN 2006X are not affected when properly taking into account these wavelength shifts (see open squares in Fig. 2). Since our measurement routines were validated based on SN 2006X, for which high-resolution VLT+UVES data were available (Patat et al., 2007), and for which our own EW determinations on lower-resolution FLWO 1.5 m+FAST data yielded consistent results, this error went unnoticed.
SN 1999cl displays the largest wavelength shifts of the Na I D profile of all the SNe Ia in our sample, with typical shifts of approximately Å, corresponding to a km s-1 velocity blueshift with respect to its expected restframe location. This velocity shift corresponds to the difference between the recession velocity of the host-galaxy nucleus (2338 km s-1 for NGC 4501; Falco et al. 1999), which we used to de-redshift the SN 1999cl spectra, and that derived at the location of SN 1999cl from emission lines in the SN spectrum used for classification purposes by Garnavich et al. (1999), namely km s-1. It results from the location of SN 1999cl in a spiral arm with a blueshifted velocity along the line of sight, as derived from kinematic maps of NGC 4501 based on H I emission by Chemin et al. (2006). We note that Garnavich et al. (1999) had in fact correctly reported a Na I D EW of 0.33 nm for their first spectrum of SN 1999cl, consistent with our revised measurement on the same spectrum.
All the other objects in our sample display significantly lower wavelength shifts of the Na I D profile ( Å in absolute value; see Fig. 2). We have not investigated the exact nature of the observed wavelength shifts for all the objects in our sample, but simply note that absolute shifts at the Å level do not appear to affect our revised EW measurements, with an RMS difference compared to our original measurements of only Å.
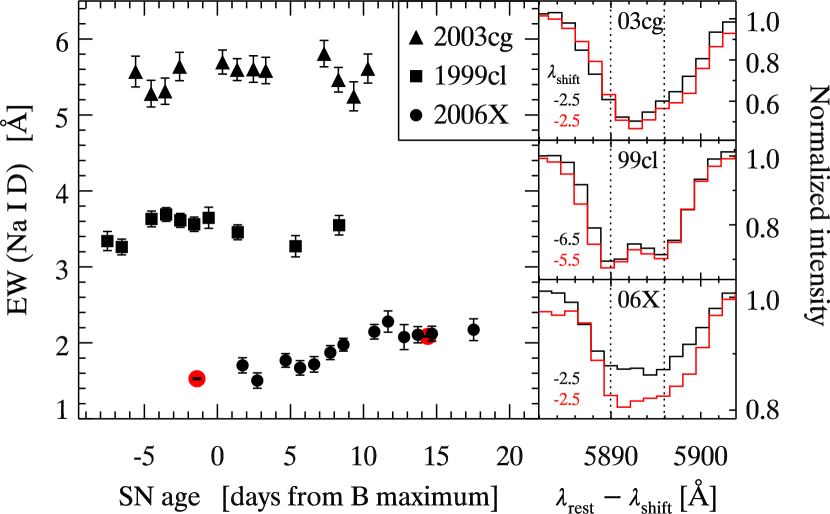
Our new measurements show that the EW variation for the Na I D profile in SN 1999cl is significantly lower than reported in our original paper ( Å cf. Å). While the EW variation remains statistically significant (3.1 different from zero), it is now below the detection threshold of 0.5 Å derived from the Monte Carlo simulations published in the original paper (these simulations are unaffected by the aforementioned measurement error). We also note that the S/N cut based on these same MC simulations ( per pixel) was erroneously applied based on the S/N per Å instead of per dispersion element (typically Å per pixel), resulting in the exclusion of spectra with . Our revised measurements thus typically include more spectra for a given SN than in the original paper (see Table 1).
As a result, SN 1999cl should no longer be considered as an object displaying variable Na I D lines in our study. The fraction of SNe Ia in our sample displaying Na I D lines thus goes from % (2/31) in the original study to % (1/31) in the revised analysis, SN 2006X being the only SN Ia in our sample with variable Na I D lines.
The main conclusion of our paper remains unchanged. Quoting from the conclusions section in the original paper: “We conclude that either variable Na I D features are not a common property of SNe Ia, or that the level of the variation is less on average than observed in SN 2006X.” However, the title of our paper highlighted the new detection of “variable Na I D lines in a highly-reddened Type Ia supernova” (i.e., SN 1999cl), which no longer holds.
Our revised measurements affect Figs. 3, 4, and 5 of the original paper, as well as Table 2. We present revised versions of these in what follows (Figs. 4, 5, 6, and Table 1). In addition, we noticed a small error in the legend labels of Fig. 2 in the original paper, which is corrected in the new Fig. 3 below.
We are indebted to Lingzhi Wang, currently a research scholar at the Chinese Academy of Sciences South America Center for Astronomy in Santiago, Chile, for having brought this measurement error to our attention during the conference “Supernovae through the ages” held on Easter Island, Chile, during August 2016.


| SN | EW | dof | ||||||
|---|---|---|---|---|---|---|---|---|
| (mag) | (Å) | (Å) | (const.) | (d) | (d) | |||
| (1) | (2) | (3) | (4) | (5) | (6) | (7) | (8) | (9) |
| 1994D | 0.04 (0.01) | 0.11 | 0.40 (0.24) | 1.6 | 2.10 | 13 | 9.5 | 59.6 |
| 1994ae | 0.02 (0.01) | 0.42 | 0.26 (0.18) | 1.4 | 0.68 | 10 | +1.4 | 38.6 |
| 1995al | 0.06 (0.02) | 1.12 | 0.21 (0.21) | 1.0 | 0.84 | 8 | +7.0 | 61.5 |
| 1997bp | 0.19 (0.03) | 1.80 | 0.54 (0.23) | 2.3 | 1.53 | 7 | 1.1 | 28.6 |
| 1997br | 0.27 (0.04) | 0.63 | 0.15 (0.24) | 0.6 | 0.25 | 4 | 7.4 | 28.7 |
| 1997do | 0.10 (0.03) | 0.28 | 0.37 (0.21) | 1.8 | 0.61 | 8 | 6.1 | 27.5 |
| 1997dt | 0.61 (0.07) | 1.06 | 0.37 (0.24) | 1.6 | 1.02 | 3 | 7.9 | 8.9 |
| 1998aq | 0.01 (0.01) | 0.23 | 0.28 (0.18) | 1.5 | 0.60 | 20 | 9.0 | 87.6 |
| 1998bu | 0.34 (0.04) | 0.37 | 0.28 (0.16) | 1.7 | 0.62 | 26 | 2.7 | 59.8 |
| 1998dh | 0.17 (0.02) | 0.36 | 0.28 (0.28) | 1.0 | 0.29 | 4 | 8.8 | 8.8 |
| 1998dm | 0.34 (0.05) | 0.60 | 0.23 (0.27) | 0.9 | 0.22 | 5 | +5.8 | 18.9 |
| 1998es | 0.07 (0.02) | 1.57 | 0.37 (0.24) | 1.6 | 0.36 | 15 | 6.0 | 36.4 |
| 1999cl | 1.20 (0.07) | 3.52 | 0.43 (0.14) | 3.1 | 2.07 | 9 | 7.5 | 15.8 |
| 1999dq | 0.12 (0.03) | 1.19 | 0.30 (0.22) | 1.4 | 0.45 | 15 | 9.6 | 39.3 |
| 2001V | 0.03 (0.02) | 1.44 | 0.54 (0.28) | 2.0 | 0.72 | 14 | 9.3 | 33.4 |
| 2001en | 0.07 (0.04) | 1.12 | 0.27 (0.31) | 0.9 | 0.35 | 4 | +2.7 | 8.7 |
| 2001ep | 0.14 (0.04) | 0.74 | 0.32 (0.27) | 1.2 | 0.36 | 10 | 2.7 | 10.8 |
| 2002bo | 0.47 (0.04) | 2.61 | 0.49 (0.20) | 2.4 | 1.09 | 21 | 7.0 | 36.7 |
| 2002cr | 0.09 (0.04) | 0.38 | 0.30 (0.22) | 1.4 | 0.48 | 4 | 7.4 | 12.8 |
| 2002fk | 0.03 (0.02) | 0.12 | 0.28 (0.23) | 1.2 | 0.87 | 7 | 0.6 | 31.6 |
| 2003cg | 1.06 (0.03) | 5.54 | 0.56 (0.26) | 2.2 | 0.97 | 11 | 5.6 | 15.9 |
| 2003du | 0.01 (0.01) | 0.10 | 0.39 (0.22) | 1.8 | 0.77 | 12 | 9.7 | 38.8 |
| 2003kf | 0.04 (0.03) | 0.52 | 0.41 (0.20) | 2.0 | 0.38 | 14 | 7.3 | 48.4 |
| 2005am | 0.03 (0.02) | 0.16 | 0.37 (0.21) | 1.7 | 0.60 | 7 | +0.4 | 8.9 |
| 2005cf | 0.10 (0.04) | 0.17 | 0.53 (0.28) | 1.9 | 1.03 | 23 | 11.8 | 41.7 |
| 2006N | 0.03 (0.02) | 0.68 | 0.65 (0.28) | 2.3 | 1.21 | 7 | 2.8 | 11.8 |
| 2006X | 1.47 (0.04) | 1.92 | 0.78 (0.17) | 4.5 | 3.68 | 18 | +1.7 | 58.5 |
| 2007S | 0.41 (0.03) | 1.92 | 0.59 (0.25) | 2.3 | 1.20 | 6 | 4.7 | 29.6 |
| 2007af | 0.14 (0.03) | 0.45 | 0.40 (0.20) | 1.9 | 0.86 | 24 | 4.7 | 97.2 |
| 2007bm | 0.52 (0.04) | 2.28 | 0.40 (0.16) | 2.5 | 1.34 | 6 | 9.3 | 29.8 |
| 2007ca | 0.30 (0.04) | 1.92 | 0.22 (0.31) | 0.7 | 0.16 | 3 | +3.4 | 9.9 |
Note. — Col. (1): SN name; col. (2): host-galaxy color excess determined from fits to multi-band optical light curves using the MLCS2k2 code of Jha et al. (2007); col. (3): weighted mean EW. The upper and lower limits correspond to the maximum deviations from the weighted mean; col. (4): maximum EW difference. The error appears in between parentheses; col. (5): divided by its error; col. (6): per degree of freedom for a constant EW fit; col. (7): number of degrees of freedom (simply the number of data points minus one); col. (8): age (in days from -band maximum light) of the earliest spectrum; col. (9): age range (in days) of the spectra used in the fit.
References
- Barbon et al. (1990) Barbon, R., Benetti, S., Rosino, L., Cappellaro, E., & Turatto, M. 1990, A&A, 237, 79
- Blondin et al. (2009) Blondin, S., Prieto, J. L., Patat, F., et al. 2009, ApJ, 693, 207
- Chemin et al. (2006) Chemin, L., Balkowski, C., Cayatte, V., et al. 2006, MNRAS, 366, 812
- Falco et al. (1999) Falco, E. E., Kurtz, M. J., Geller, M. J., et al. 1999, PASP, 111, 438
- Garnavich et al. (1999) Garnavich, P., Jha, S., Kirshner, R., Challis, P., & Szentgyorgyi, A. 1999, IAU Circ., 7198
- Jha et al. (2007) Jha, S., Riess, A. G., & Kirshner, R. P. 2007, ApJ, 659, 122
- Patat et al. (2007) Patat, F., Chandra, P., Chevalier, R., et al. 2007, Science, 317, 924
- Turatto et al. (2003) Turatto, M., Benetti, S., & Cappellaro, E. 2003, in From Twilight to Highlight: The Physics of Supernovae, ed. W. Hillebrandt & B. Leibundgut, 200–+