The origin of the infrared emission in radio galaxies II:
analysis of mid- to far-infrared Spitzer observations of the 2Jy sample
Abstract
We present an analysis of deep mid- to far-infrared (MFIR) Spitzer photometric observations of the southern 2Jy sample of powerful radio sources (0.05 z 0.7), conducting a statistical investigation of the links between radio jet, AGN, starburst activity and MFIR properties. This is part of an ongoing extensive study of powerful radio galaxies that benefits from both complete optical emission line information and a uniquely high detection rate in the far-infrared (far-IR). We find tight correlations between the MFIR and [OIII]5007 emission luminosities, which are significantly better than those between MFIR and extended radio luminosities, or between radio and [OIII] luminosities. Since [OIII] is a known indicator of intrinsic AGN power, these correlations confirm AGN illumination of the circum-nuclear dust as the primary heating mechanism for the dust producing thermal MFIR emission at both 24 and 70m. We demonstrate that AGN heating is energetically feasible, and identify the narrow line region clouds as the most likely location of the cool, far-IR emitting dust. Starbursts make a major contribution to the heating of the cool dust in only 15-28% of our targets.
We also investigate the orientation dependence of the continuum properties, finding that the broad- and narrow-line objects in our sample with strong emission lines have similar distributions of MFIR luminosities and colours. Therefore our results are entirely consistent with the orientation-based unified schemes for powerful radio galaxies. However, the weak line radio galaxies (WLRG) form a separate class of objects with intrinsically low luminosity AGN in which both the optical emission lines and the MFIR continuum are weak.
1 Introduction
In the last few decades space-based infrared observatories have provided new opportunities to understand the physics of AGN. In particular, mid- to far-infrared (MFIR) observations can address many outstanding issues relating to the origin of the prodigious emission, as well as bringing insight to questions relating to the unification of active galaxies, the triggering of the activity, and the evolution of AGN in general.
Several efforts have been made to model the MFIR spectral energy distributions (SEDs) of radio-loud AGN in order to understand the origin of the MFIR emission. The thermal emission from warm dust radiating in the mid-infrared (mid-IR) is readily explained in models by AGN heating of dust close to the active core (Pier & Krolik, 1992, Pier & Krolik, 1993, Granato & Danese, 1994), but the origin of the thermal far-infrared (far-IR) emission is less well understood. This is because the far-IR continuum is emitted by cooler dust (K), and models that attempt to explain the heating of the cool dust in terms of AGN illumination of a compact optically thick dust torus have struggled to explain how radiation from the AGN can heat dust at sufficiently large radii to produce emission in the far-IR. Alternative theoretical studies that focus on adjusting the geometry and size of the torus, or modelling it as a collection of discrete dust clouds surrounding the AGN (e.g. Nenkova et al., 2002, van Bemmel & Dullemond, 2003, Fritz et al., 2006), can account for the far-IR emission in terms of AGN illumination. However, the main problem with testing such models is our lack of direct knowledge of the spatial distribution of the emitting dust. Due to their large distances, the circum-nuclear dust structures remain unresolved for the vast majority of AGN. Without constraints on the radial distribution of the dust, there is a limit to how much the SED modelling approach can inform us about the origin of the MFIR emission.
Statistical studies that correlate MFIR, optical and radio properties provide a promising alternative to direct, spatially resolved, studies of the dust. This is due to the fact that the MFIR continuum is likely to be more isotropic than the shorter wavelength UV-optical-near infrared continuum, and also because the thermal emission from circum-nuclear dust acts as a bolometer for the AGN activity. MFIR observations of radio-loud AGN are particularly important because the extended radio lobe emission from such galaxies is generally considered to be emitted isotropically, providing an opportunity to select orientation-unbiased samples.
Many previous studies have acknowledged these benefits (Golombek et al., 1988, Impey & Gregorini, 1993, Heckman et al., 1992, 1994, Hes et al., 1995, Haas et al., 2004, Shi et al., 2005, Cleary et al., 2007). However, definitive results were hampered in the past by the relatively low sensitivity of the infrared observatories, as well as the lack of complete, homogeneous samples of powerful radio galaxies in the local Universe. It is notable that IRAS and ISO detected less than 30% and 50% respectively of powerful 3C radio galaxies at moderate redshifts (). IRAS-based studies such as those by Heckman et al. (1994) and Hes et al. (1995), established putative correlations between low frequency radio and MFIR emission for radio-loud AGN, indicating a link between the AGN power and the MFIR continuum emission. However, due to the limited detection rate in the MFIR, the heating mechanism for the dust producing the prodigious MFIR emission remained uncertain.
It is now widely accepted that the mid-IR (30m) continuum is heated by direct AGN illumination of dust structures close to the AGN (e.g. the circum-nuclear torus). However, in light of the large scatter of correlations between optical and far-IR () continuum properties, it has been suggested that illumination by a starburst component may provide the principal heating mechanism for the dust producing the far-IR emission (Rowan-Robinson, 1995). More direct observational evidence for starburst heating of the far-IR continuum in AGN is presented in Schweitzer et al. (2006) and Netzer et al. (2007), based on an analysis of starburst-sensitive polycyclic aromatic hydrocarbon (PAH) features. Finding a correlation between PAH 7.7m and 60m luminosity in a sample of nearby PG quasars, Schweitzer et al. (2006) and Netzer et al. (2007) attribute this to a link between far-IR luminosity and star formation. However, their sample is modest, and the PAH star formation signature remains undetected in 60% of the objects. Therefore the putative correlation between PAH and far-IR continuum properties lacks a solid statistical foundation. While there is no doubt that starburst heating of cool dust can account for a substantial fraction of the far-IR flux in some AGN, the starburst contribution to the far-IR continuum in the general population of AGN remains uncertain.
As well as their importance for understanding the main dust heating mechanism, MFIR observations can also be used to test the orientation-based unified schemes (Barthel, 1989), under the assumption that the MFIR emission is isotropic. To date, the results from such tests have been ambiguous. Early IRAS-based studies (Heckman et al., 1994, Hes et al., 1995) presented evidence for stronger MFIR emission in broad line radio galaxies and quasars (BLRG/Q) compared with narrow line radio galaxies (NLRG), suggesting that the MFIR is not, in fact, isotropic. On the other hand, additional studies using ISO data (Meisenheimer et al., 2001, Haas et al., 2004) found no evidence for differences between the MFIR luminosities of the two optical classes. Unfortunately, these studies were hampered by the relatively poor sensitivity of the IRAS and ISO observatories. Further studies using Spitzer found evidence for a difference between the MFIR emission of BLRG/Q and NLRG. Shi et al. (2005) attribute this difference to anisotropic emission at mid-IR wavelenghts, while Cleary et al. (2007) attribute it to a combination of non-thermal contamination of the MFIR emission as well as anisotropic emission at mid-IR wavelenghts. However, both these results were based on samples that were heterogeneous and/or incomplete in terms of far-IR detections.
Many of the past studies of MFIR emission from radio galaxies have selected samples based on the 3C radio catalogue. Exploitation of this catalogue is at present hampered by the lack of published high quality optical spectroscopic observations for many of the objects, with which one can confidently classify and identify possible links between MFIR emission, starburst and AGN activity. In contrast, the southern 2Jy sample (Tadhunter et al., 1993) is unique in the sense that deep spectra have been published for the whole sample (Tadhunter et al., 1993, 1998, 2002; Wills et al., 2004, Holt et al., 2007: See §2). The completeness and availability of deep spectroscopic and radio data make this sample well suited to investigating the nature of the MFIR emission and testing the unified schemes. Therefore we have undertaken a program of deep imaging with Spitzer/MIPS of the 2Jy sample, in order to address the sensitivity problems of previous MFIR observatories leading to incomplete sample statistics (see Dicken et al., 2008, hereafter D08).
A preliminary analysis of the Spitzer/MIPS 2Jy data set was presented in Tadhunter et al. (2007) and the measured Spitzer MFIR fluxes are presented in D08. In this paper we conduct an in-depth analysis of the results: sections 2 and 3 present the sample and the data; section 4 is concerned with the origin of the MFIR emission; section 5 analyses the far-IR emission and the contribution of starburst heating to the emission at these wavelengths; and section 6 discusses these results in the context of the heating mechanism, the covering factor of the MFIR-emitting dust, the slopes of the correlations and the unified schemes for powerful radio galaxies.
2 The sample
The sample selected for this study comprises a complete sample of all 46 powerful radio galaxies and steep-spectrum quasars ()111In addition to excluding quasars with , we also excluded the quasars PKS0159-11 and PKS0842-75 on the basis that they have relatively strong unresolved radio core emission that pushes them above the 2Jy flux limit for the sample as a whole. selected from the 2Jy sample of Wall & Peacock (1985) with redshifts 0.05 z 0.7, flux densities 2Jy and declinations . This sample is a complete, redshift limited, sub-set of that presented in Tadhunter et al. (1993), with the addition of PKS 034705 (catalog ), which has since proved to fulfil the same selection criteria (di Serego-Alighieri et al., 1994). Our selection criteria cut out all the 16 quasar-like objects in the full 2Jy sample that only meet the 2Jy flux criterion because of the strength of their beamed flat spectrum radio core/inner jet components222The only potentially ambiguous cases are PKS0521-36 and 3C273, which have flat spectra based on their integrated radio emission, but extended steep spectrum emission components with flux Jy. However, given that the extended steep spectrum emission in these objects is concentrated in one-sided jets that are likely to be strongly beamed and hence likely to be dominated by non-thermal emission, we have decided not to include them in the analysis presented in this paper. We find that the inclusion/exclusion of these objects in the statistical tests makes no difference to the main conclusions of the paper.; the remaining objects in the sample are all dominated by their extended steep spectrum lobe/hotspot emission. Therefore, given that there is no strong evidence for beaming and anisotropy in extended steep spectrum radio components, our sample is unlikely to be significantly biased towards a particular orientation of the jets to the line of sight. The lower redshift limit has been set to ensure that these galaxies are genuinely powerful sources. Further discussion of the sample selection can be found in D08.
In the detailed analysis of the spectral energy distributions presented in D08, we showed that a maximum of 30% of our complete sample have the possibility of contamination of their MFIR flux by non-thermal synchrotron emission. This is consistent with several previous studies of samples of radio sources (Polletta et al., 2000, Cleary et al., 2007), which have indicated that the number of objects with possible non-thermal contamination of the MFIR is small, and generally confined to quasars with flat spectrum radio cores.
| PKS | Other | Optical | Radio | z | (W/Hz) | (W/Hz) | (W) | (W/Hz) | Starburst |
|---|---|---|---|---|---|---|---|---|---|
| 002326 | NLRG | CSS | 0.322 | SB | |||||
| 003401 | 3C015 | WLRG | FRII | 0.073 | No | ||||
| 003502 | 3C17 | BLRG | (FRII) | 0.220 | No | ||||
| 003809 | 3C18 | BLRG | FRII | 0.188 | No | ||||
| 003944 | NLRG | FRII | 0.346 | No | |||||
| 004342 | WLRG | FRII | 0.116 | No | |||||
| 010516 | 3C32 | NLRG | FRII | 0.400 | No | ||||
| 011715 | 3C38 | NLRG | FRII | 0.565 | No | ||||
| 021313 | 3C62 | NLRG | FRII | 0.147 | No | ||||
| 023519 | OD-159 | BLRG | FRII | 0.620 | No | ||||
| 025271 | NLRG | CSS | 0.566 | No | |||||
| 034705 | BLRG | FRII | 0.339 | U | |||||
| 034927 | NLRG | FRII | 0.066 | U | |||||
| 040403 | 3C105 | NLRG | FRII | 0.089 | No | ||||
| 040975 | NLRG | FRII | 0.693 | SB | |||||
| 044228 | NLRG | FRII | 0.147 | No | |||||
| 062052 | WLRG | FRI | 0.051 | SB | |||||
| 062535 | OH-342 | WLRG | FRI | 0.055 | No | ||||
| 062553 | WLRG | FRII | 0.054 | No | |||||
| 080610 | 3C195 | NLRG | FRII | 0.110 | No | ||||
| 085925 | NLRG | FRII | 0.305 | No | |||||
| 091511 | Hydra A | WLRG | FRI | 0.054 | SB | ||||
| 094507 | 3C227 | BLRG | FRII | 0.086 | U | ||||
| 113613 | Q | FRII | 0.554 | U | |||||
| 115134 | Q | CSS | 0.258 | U | |||||
| 130609 | NLRG | CSS | 0.464 | U | |||||
| 135541 | Q | FRII | 0.313 | U | |||||
| 154779 | BLRG | FRII | 0.483 | U | |||||
| 155902 | 3C327 | NLRG | FRII | 0.104 | No | ||||
| 160201 | 3C327.1 | BLRG | FRII | 0.462 | No | ||||
| 164805 | Herc A | WLRG | FRI | 0.154 | No | ||||
| 173356 | BLRG | FRII | 0.098 | U | |||||
| 181463 | NLRG | CSS | 0.063 | U | |||||
| 183948 | WLRG | FRI | 0.112 | No | |||||
| 193246 | BLRG | FRII | 0.231 | SB | |||||
| 193463 | NLRG | CSS | 0.183 | No | |||||
| 193815 | BLRG | FRII | 0.452 | No | |||||
| 194902 | 3C403 | NLRG | FRII | 0.059 | No | ||||
| 195455 | WLRG | FRI | 0.060 | No | |||||
| 213514 | Q | FRII | 0.200 | U | |||||
| 213520 | OX-258 | BLRG | CSS | 0.635 | SB | ||||
| 221117 | 3C444 | WLRG | FRII | 0.153 | No | ||||
| 222102 | 3C445 | BLRG | FRII | 0.057 | No | ||||
| 225041 | NLRG | FRII | 0.310 | No | |||||
| 231403 | 3C459 | NLRG | FRII | 0.220 | SB | ||||
| 235661 | NLRG | FRII | 0.096 | No |
Note. — Table1: Column 3 definitions; Q - quasar, BLRG - broad line radio galaxy, NLRG - narrow line radio galaxy, WLRG - weak line radio galaxy. Column 4 definitions; FRI & FRII - Fanaroff-Riley class 1 and 2 respectively, CSS - compact steep spectrum, C/J - core/jet. Column 8 [OIII] luminosities calculated from flux presented in Tadhunter et al. (1993) and Wills et al. (2004). Column 10 gives the 15-17Ghz monochromatic core luminosities from the fluxes presented in D08. Column 11 gives information about whether a spectroscopic young stellar population (YSP) has been detected at optical wavelengths indicating the possibility of starburst activity. SB - YSP detected, No - No YSP, U - uncertain YSP component (references for YSP/starburst: Tadhunter et al., 2002;Wills et al., 2004, 2008; Holt et al., 2007). Positions for the objects can be found in D08.
3 The data
We have made deep Spitzer/MIPS observations (24, 70 and 160m) of our sample, as well as complementary high frequency radio observations (15 to 22 GHz) with the ATCA and the VLA. Full details of the observations and reduction can be found in D08, along with the MFIR, radio fluxes and spectral energy distributions for the entire sample. We detect 100% of our sample at 24m, 90% at 70m and 33% in the lower sensitivity 160m band. This is by far the best detection rate for MFIR observations of a sample of an intermediate-redshift AGN published to date. Additionally, the high frequency radio data, along with data from the literature, have enabled us to detect the radio cores in 70% of our complete sample. We utilize these data to calculate the orientation-sensitive R parameter (see D08 and §4.5).
In Table 1 we present the 24 and 70m monochromatic luminosities for the complete sample, along with 5 GHz radio and [OIII] emission line luminosities333In order to calculate luminosities we used and along with spectral indices derived from the F(70)/F(24) flux ratios. The analysis presented here differs from the preliminary results presented in Tadhunter et al. (2007) in that the emission line luminosities have now been corrected for Galactic extinction, using E(B-V) reddening values obtained from the NASA/IPAC Extragalactic Database (NED), along with the parameterised Galactic extinction law of Howarth (1983). In Table 1 we also present the most up-to-date optical classification for each of the sources, with objects classified as narrow-line radio galaxies (NLRG), broad-line radio galaxies or quasars (BLRG/Q), and weak-line radio galaxies (WLRG)444WLRGs are sometimes known as low-excitation galaxies but we prefer to label them as WLRG since the excitation (or, more accurately, ionization) of the emission line gas is not necessarily related to the AGN luminosity. Indeed, there exist examples of AGN with relatively high [OIII] luminosities, but emission line ratios reflecting a low ionization state. WLRG are defined as having EW([OIII])10Å (Tadhunter et al., 1998)..
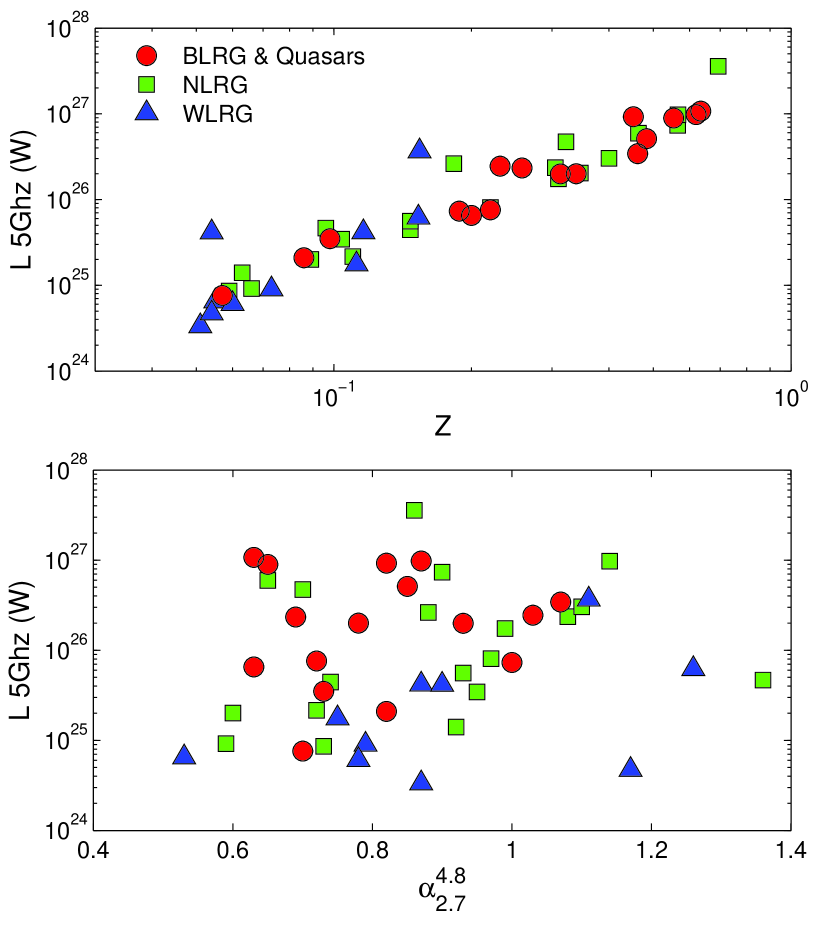
In Figure 1 we plot 5 GHz radio luminosity against both redshift (top) and radio spectral index (bottom) for the complete sample. The effect of the flux limit of the sample is clearly visible in the upper plot in the form of the tight correlation between monochromatic radio luminosity and redshift. It is noteworthy that our complete sample covers three orders of magnitude in radio luminosity. The plot of the high frequency radio spectral index against radio luminosity allows us to investigate any bias in our steep spectrum selection method. Based on the similar distributions of the different optical classes in over the full 3 orders of magnitude covered by our sample, we are confident that the steep spectrum selection has left us with no strong bias towards BLRG/Q or NLRG classification.
4 MFIR emission and the central engine
Many previous studies (e.g. Heckman et al., 1994, Hes et al., 1995, Cleary et al., 2007) have found evidence that MFIR emission power is correlated with measured total radio power, albeit based on highly incomplete samples. This result is in line with a model in which the MFIR emission and radio jet power are both strongly linked through the physics of the central engine. However, radio emission depends on factors in addition to the intrinsic power of the AGN. For example, the properties of the local ISM interacting with the radio plasma are expected to have a major impact on the conversion of jet mechanical power into radio luminosity (e.g. Barthel & Arnaud, 1996). In addition, the low frequency radio emission may be emitted by extended structures that are far from the regions emitting the MFIR continuum. Therefore, a change in the intrinsic power of the AGN may take a significant amount of time to be reflected in the emission of the extended radio lobes.
An alternative to comparisons based on low frequency radio emission is to use optical emission line luminosity. The AGN-photoionized narrow-line region (NLR) is emitted on a smaller scale (5kpc) than the extended radio lobe emission in most radio galaxies. Therefore the 5007 emission line is likely to provide a good indication of the intrinsic power of the illuminating AGN (e.g. Rawlings & Saunders, 1991, Tadhunter et al., 1998, Simpson, 1998).
4.1 Comparisons with MFIR luminosity
We now utilize our complete sample to address the question of how the MFIR continuum depends on the AGN power, with the benefits of not only completeness in the MFIR flux measurements, but also accurate [OIII]5007 emission line luminosities for the entire sample.
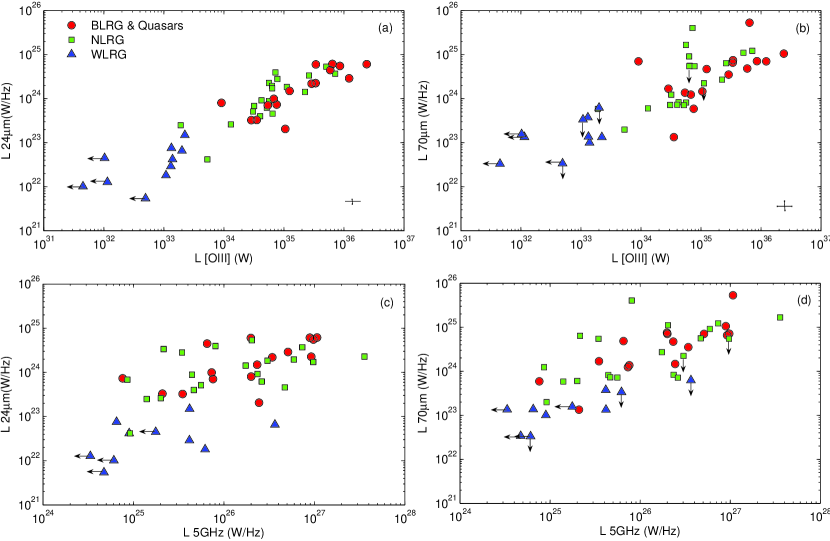
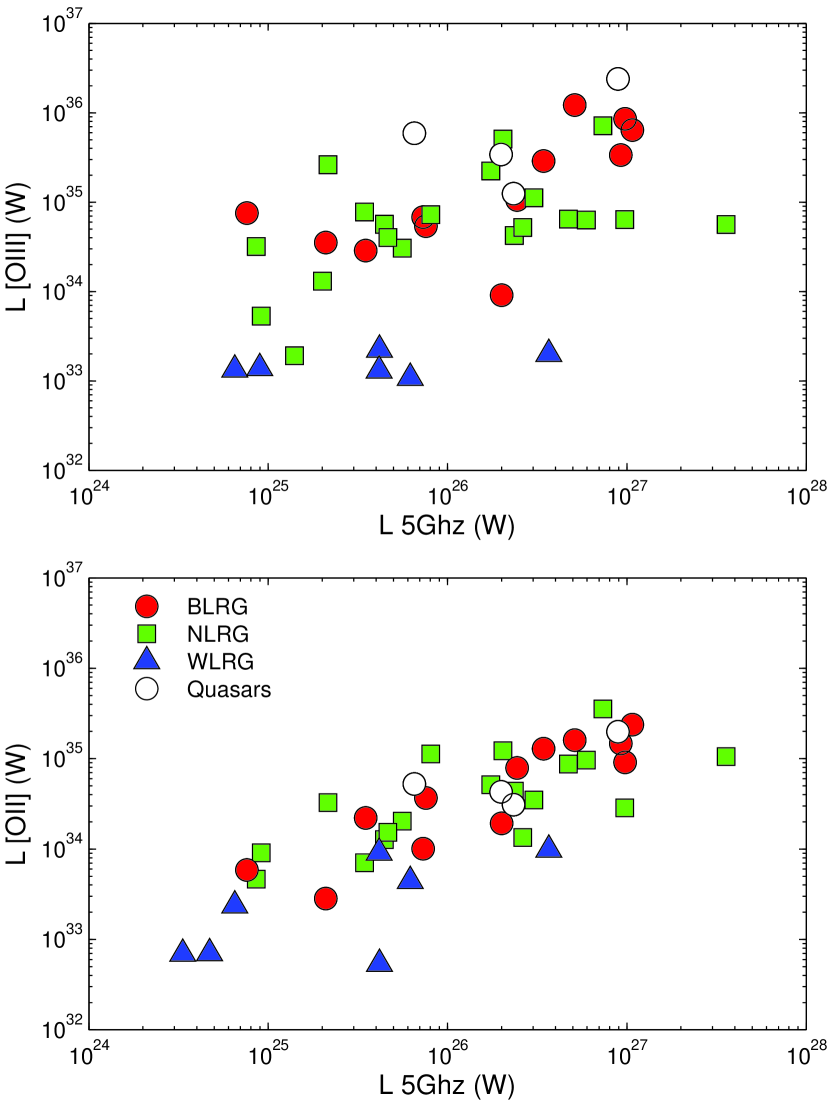
In Figures 2 (a) and (b) we plot 24m and 70m monochromatic luminosities (, ) against [OIII] luminosities (), while in Figures 2 (c) and (d) we plot the 24m and 70m luminosities against 5GHz monochromatic radio luminosities (). It is clear from Figures 2 (a) and 2(b) that the MFIR luminosities are strongly correlated with . As discussed in the preceding subsection, the [OIII] luminosity is expected to provide a good indication of intrinsic AGN power. Therefore, we propose that the 24m and 70m emission are also intrinsically linked to the power of the active core and, consequently, that the dust producing the MFIR emission is likely to be heated directly by the central AGN.
It is also notable from Figure 2(a) that shows a much tighter correlation with the than it does with the . This result is expected, because we believe that both the 24m luminosity and the [OIII] luminosity are strongly linked to the power of the active core via AGN illumination of the emission line clouds and dust structures close to the nucleus. The radio power, however, is dependent on additional factors such as the nature of the ISM in the halo of the host galaxy into which the jets and lobes expand.
Considering next the differences between the 24m and 70m correlations, it is apparent that there is more scatter in the vs correlation. also remains better correlated with than , but the difference is not as evident as at 24m. Our interpretation of the cause of this additional scatter at 70m lies in the origin of the far-IR emission, as we will discuss in detail in §5. However, it is noteworthy that this scatter cannot be due to the reduced sensitivity of Spitzer at longer far-IR wavelengths because our observational errors are small compared with the overall scatter in the distribution (see error bars in plots (a) and (b)). Therefore, there must be a physical cause for the increased scatter in this plot.
4.2 Rank correlation statistics
| Rank Correlation | |
|---|---|
| (1) vs | 0.88 |
| (2) vs | 0.76 |
| (3) vs | 0.54 |
| (4) vs | 0.63 |
| (5) vs z | 0.93 |
| (6) vs | 0.57 |
| Partial Rank Correlation with z | |
| (7) vs | 0.77 |
| (8) vs | 0.50 |
Note. — Table 2: Result of various Spearman rank correlation statistics. Values of are given for each test, where a value close to 1 is highly significant. This test was undertaken with a z limited sample z0.06, to remove most of the objects with upper limits in [OIII]. In addition the object PKS1839-48 which has upper limits in [OIII] was also removed, leaving 38 objects from our complete sample. See §4.2 for discussion of the 70m upper limits.
Prior to interpreting our results in full, it is important to investigate the significance of the correlations in Figure 2. We have therefore calculated the Spearman rank correlation coefficient for the four correlations. The test was undertaken using a redshift limited sub-sample with z0.06 in order to remove the majority of WLRGs with upper limits in [OIII]. In addition the remaining object with an upper limit in [OIII] (PKS1839-48) was also excluded555The exclusion or inclusion of the [OIII] upper limit value for this object has been investigated, and we find that it makes no significant difference to the statistical results presented in Table 2 . In order to quantify the effects that the four remaining upper limits in 70m have on this test, we chose to handle the correlations that included 70m data in the following way: we created replacements for each of the four 70m upper limits by randomly selecting a 70m/24m flux ratio value from the distribution of measured 70m/24m flux ratio values for the sample, and then multiplying this by the measured 24m flux to create a new 70m flux estimate. The 70m estimates were then converted to luminosities and included in the rank correlation test. This process was repeated 1000 times, and the median of the correlation coefficient for those cycles is presented in Table 2 for correlations involving 70m luminosities (i.e.rows 2, 4 and 8).
The results show a high level of significance for all the correlations using a two tailed test, in the sense that we can reject the null hypothesis that the variables are uncorrelated at a 99.9% level of significance. The rank correlation statistics, presented in Table 2, clearly show that the vs. and vs. correlations are more significant than those between the radio luminosity and MFIR and [OIII] luminosities.
For a flux-limited sample such as that considered here, it is natural to consider the possibility that the correlations between MFIR, radio and [OIII] luminosities might not be intrinsic, but rather arise through their mutual dependence on redshift. For example, given the strong correlation between radio power and redshift induced by the radio flux limit (see Figure 1), and also the correlation between emission line luminosity and radio power, it is possible that a correlation between the and the MFIR emission luminosity might arise because the MFIR luminosities are independently correlated with z (e.g. because of genuine redshift evolution rather than being intrinsically correlated with ). The second part of Table 2 (rows 7 and 8), shows the results of a partial rank correlation test carried out in order to investigate whether the correlations could be a result of a dependence on the third variable z. In both cases we still find that the null hypothesis that the variables are unrelated can be rejected at a 99.5% level of significance. This demonstrates that both and are intrinsically correlated with .
4.3 LIRG and ULIRG comparison
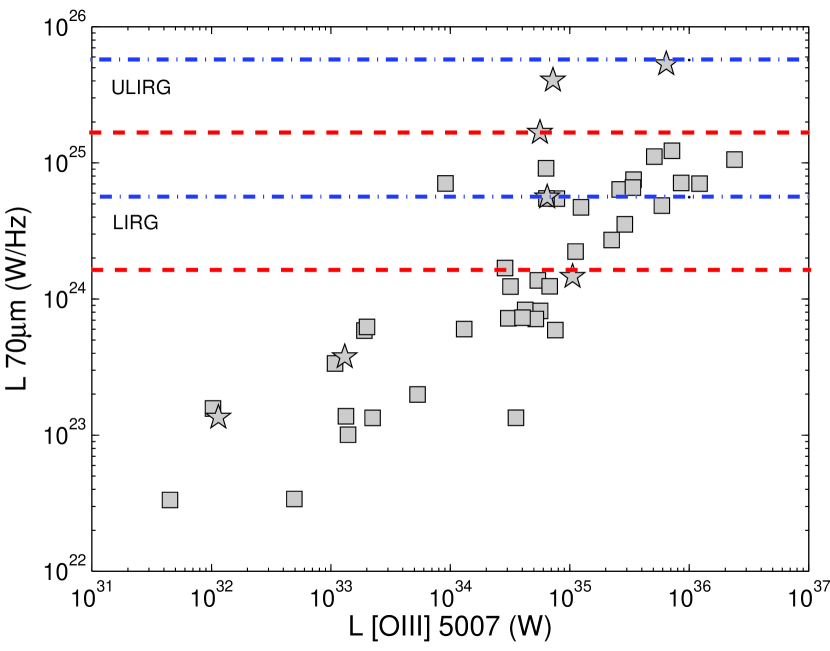
In order to place radio galaxies in the context of other sources of prodigious MFIR emission in the local universe, it is interesting to compare them with the luminous and ultra-luminous infrared galaxies (LIRGs and ULRIGs: Sanders & Mirabel, 1996). Figure 3 again shows the vs correlation for the entire sample, but in this case we also indicate the typical ranges that LIRGs and ULIRGs would occupy on the diagram. To calculate these ranges we follow the definitions of Sanders & Mirabel (1996): that LIRGs have integrated far-IR luminosities , while ULIRGs have . The ranges of 70m monochromatic luminosities corresponding to these integrated luminosities have been estimated based on two assumptions about the MFIR SEDs of the sources. In each case the lower line has been calculated by assuming the SED of the radio galaxy 3C327 — taken to be representative of a source with relatively warm MFIR colours, whereas the upper line has been calculated by assuming the SED of the ULIRG Arp220 — representative of a source with cool MFIR colours. Considering these limits we find that 28-48% of our sample would be classified as LIRGs, and 7% as ULIRGS.
4.4 Testing the unified schemes
The MFIR luminosities can also be used to test the orientation-based unified schemes for powerful radio galaxies (regardless of the emission mechanism). In particular, if the distributions of the observed MFIR luminosities are similar for different optical classes of objects (NLRG, BLRG/Q, WLRG) this is consistent with, but does not prove, that they are part of the same parent population.
Evidence from investigations using IRAS (e.g. Heckman et al., 1994, Hes et al., 1995) suggested that the MFIR luminosities of narrow line radio galaxies (NLRG) are lower by up to an order of magnitude in comparison to broad line radio galaxies and quasars (BLRG/Q)666In the following, unless otherwise specified, we consider BLRG and quasars as a single class. This is justified on the basis that, among objects with broad permitted emission lines, there is a continuous range in luminosities between objects classed as BLRG and quasars.. These results have been supported by some studies (van Bemmel et al. 2000) and rejected by others (Meisenheimer et al. 2001, Haas et al. 2004), but all the previous studies were based on incomplete samples. Therefore, it remains uncertain whether genuine differences exist between the MFIR properties of broad and narrow line radio-loud AGN.
Any difference between the two types of radio galaxies at shorter mid-IR wavelengths (30m), might be explained in terms of extinction by a dusty torus, provided that there is significant optical depth in the torus at such wavelengths. However, it would remain challenging to explain differences in longer wavelength emission in terms of such obscuration. Alternatively, a difference between the two classes of objects could be due to non-thermal beamed emission contaminating the thermal MFIR, which is expected to be stronger in the BLRG/Q.
Using our complete sample we can investigate whether there are significant differences between the MFIR properties of broad- and narrow-line objects in the 2Jy sample.
A visual inspection of Figures 2 (a) and (b) reveals no evidence that the BLRG/Q have higher luminosities than the NLRG at 24 or 70m, and we have shown that no more than 24% of the sample have a possibility of contamination from non-thermal beamed components (see Dicken et al. (2008)). Therefore we conclude that the MFIR emission in our sample is most likely to be emitted isotropically, at least down to an observed wavelength of 24m (rest wavelength 14-23m, depending on redshift).
4.5 The R parameter
We can further examine whether the MFIR continuum is isotropic by investigating any links between MFIR luminosities and the relative brightness of the radio core. If there is any anisotropy in the MFIR continuum, we would expect to see enhanced emission in those objects with strong cores, which have axes orientated closer to the line of sight. Using the new high frequency radio observations presented in D08, as well as data from the literature, we can investigate the dependence of MFIR properties on the orientation-sensitive, core dominance parameter R, defined as . Tables of R values estimated at 5GHz for the complete sample are presented in D08.
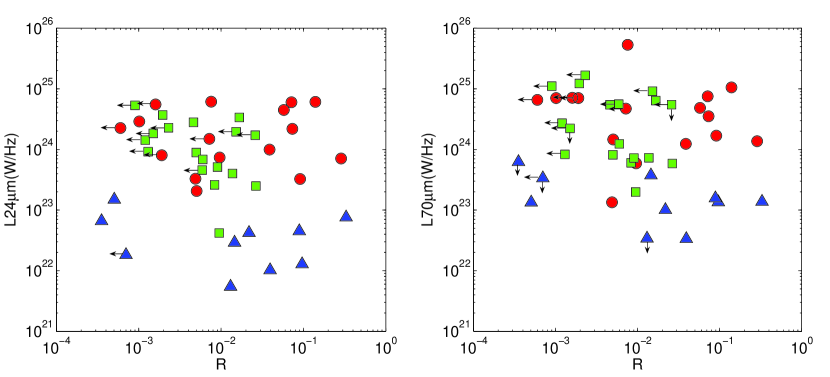
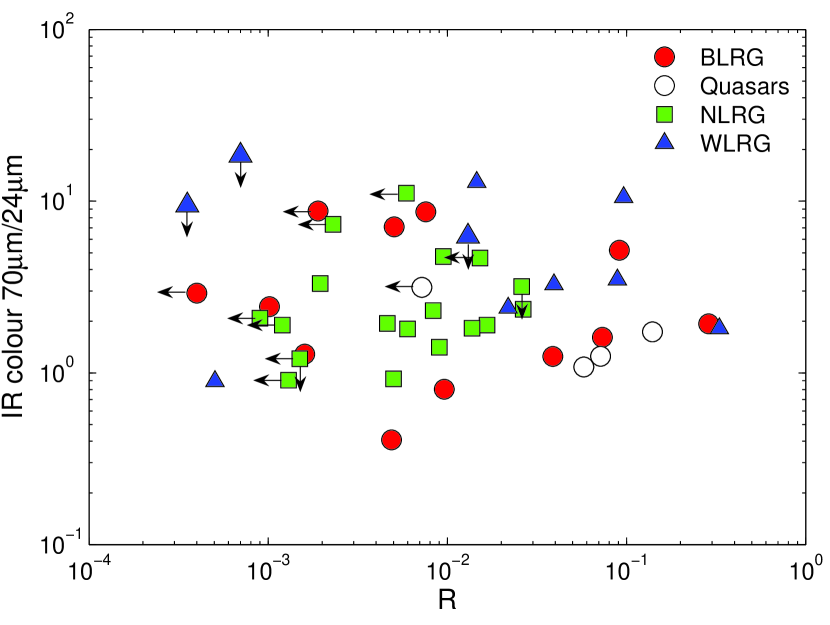
In Figure 4 we plot the 24 and 70m luminosities against R. It is clear from these plots that, on average, the BLRG/Q have the highest R values in our sample (Morganti et al., 1997), consistent with unified schemes which predict that BLRG/Q have jet axes that are pointing closer to the line of sight, leading to stronger beamed core/jet emission. However, not all BLRG/Q are highly core dominated. In fact, the population of such objects shows a wide range of R parameter values.
In Figure 5 we plot R against the 70m/24m infrared flux ratio. Plotting similar parameters, Shi et al. (2005) found an anti-correlation in the sense that warmer IR colour corresponds to a smaller R parameter. In addition, they found some evidence that different optical classes lie in different regions of the plot, with the BLRG/Q tending to the highest R, and warmest colours.
From a visual inspection of Figure 5 there is little evidence for a strong anti-correlation as presented in Shi et al. (2005). The range of infrared colours suggests that the MFIR emission is relatively isotropic. However, it is worth noting that many of the objects in the lower region of the diagram, forming the group at low 70m/24m and high R, are BLRG/Q.
4.6 Weak line radio galaxies
It is not only the distributions of NLRG and BLRG/Q that are of interest in the correlation plots presented in Figure 2. The figure also provides clues to the nature of WLRG. Although many of the WLRG in our sample have been classified as FRI radio sources, a significant subset have FRII morphologies (see Tadhunter et al., 1998). Previous studies (e.g. Cao & Rawlings, 2004) have suggested that obscuration could provide an explanation for the differences between WLRG and radio galaxies with strong emission lines.
In Figures 2 (a) and (b) it is striking that the WLRG lie at the lowest luminosity end in both emission line and MFIR continuum luminosity. If the MFIR emission is primarily caused by AGN heating of the dust, then this demonstrates that WLRG contain intrinsically weak AGN. Therefore, WLRG cannot be accommodated in the simplest unified schemes for radio galaxies, which posit that the differences between all classes of radio-loud AGN are solely due to anisotropy and orientation. It is evident that, although obscuration may contribute at some level to the weakness of the emission lines in these objects, the idea that WLRG contain powerful quasar-like AGN, heavily obscured by dust, is certainly not consistent with our data. Hardcastle et al. (2007) suggest that the differences between WLRG and radio galaxies with strong emission lines (NLRG/BLRG/Q) may be accounted for by different accretion modes of the AGN, with the WLRG accreting hot ISM at a relatively low Eddington ratio, and NLRG/BLRG/Q accreting cold ISM at a higher Eddington ratio.
Figures 2 (c) and (d) clearly show that, despite being weak in both emission line and MFIR luminosity, the WLRG overlap with the NLRG and BLRG/Q in terms of radio luminosity. This suggest that other factors play an important role in boosting the radio powers of WLRG. In particular, as noted above, the radio luminosity is not necessarily a good measure of intrinsic AGN may power, and the properties of the local ISM have a large impact on the radio luminosity for a given intrinsic jet power. In this case we would expect that, for a given MFIR luminosity, the WLRG with powerful radio emission should be found in relatively dense cluster environments. Some evidence for this effect is presented in Barthel & Arnaud (1996), however, their result is based on a limited sample. Future deep optical imaging observations of the 2Jy sample will provide a direct indication of the significance of such environmental effects.
5 Origin of the Far-Infrared Emission
As discussed in §1, the nature of the heating mechanism for the cool dust radiating at 70m (the far-IR) is not well understood. However, it is widely accepted that the cool dust is likely to be heated by starbursts and/or by AGN illumination. Based on the tight correlation between and shown in Figure 2, we have concluded that the most probable heating mechanism for the dust emitting at both mid- and far-IR wavelengths is direct illumination by the AGN (§4). However, it is of course naive to rule out starburst heating as a contributor to far-IR emission altogether, specifically because morphological evidence suggests that at least some powerful radio galaxies are triggered in major, gas rich galaxy mergers (Heckman et al., 1986). Such mergers are predicted to be associated with powerful starbursts (e.g. di Matteo et al. (2005)). The starburst-AGN connection is also important for interpreting sub-millimetre observations in the context of the star formation history of radio-loud AGN at high redshift. Some studies, such as that by Archibald et al. (2001), assume that the cold dust responsible for the sub-mm emission is heated entirely by starbursts. Therefore to comprehensively understand the MFIR emission from powerful radio galaxies it is vital to investigate the contribution of starburst heating to the observed far-IR fluxes, and possible links between star formation and AGN activity.
5.1 Evidence for starburst heating of the far-IR continuum
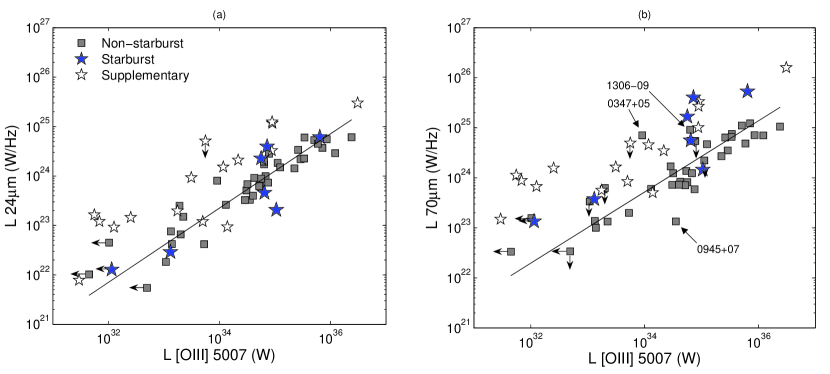
Careful spectral synthesis modelling of the high quality optical spectra for our sample (Tadhunter et al., 2002, Wills et al., 2004, 2008, Holt et al., 2007) has allowed us to identify the objects that show clear evidence for recent star formation activity at optical wavelengths (see Table 1). Therefore, in Figure 6 we are able to plot the and data against once again, but this time highlighting those seven objects that we have established to have unambiguous evidence for starburst activity at optical wavelengths (PKS002326, PKS040975, PKS062052, PKS091511 (3C218), PKS193246, PKS213520, PKS231403 (3C459)). As we have seen in §4, there are good correlations between both , and , but there is significantly more scatter in the 70m correlation, consistent with the findings of Rowan-Robinson (1995). As first described in the preliminary results presented in Tadhunter et al. (2007), we believe this scatter is in part due to the boosting by starburst heating of the cool far-IR emitting dust that is not as significant for the warm mid-IR 24m dust emission.
To demonstrate the degree of starburst boosting above the main correlations we have plotted regression lines on both plots in Figure 6. The lines shown are the bisector of a linear least squares fit of on and on . As for the sample used in the Spearman rank statistics, in calculating this fit we include only those objects with z 0.06, in order to avoid most of the objects with upper limits in their [OIII] emission. In addition, the 7 starburst objects and one more object (PKS183948) with upper an limit in [OIII] were also removed, leaving a total sample of 33 objects for the fit.
From a visual inspection of Figure 6(b) it is clear that the majority of those objects we identify as having evidence for optical star formation activity are displaced, showing enhanced far-IR luminosities relative to the regression line in the 70m plot; this enhancement is not apparent for most of the optical starburst objects in the 24m plot. Therefore, it appears that there must be some mechanism boosting the far-IR flux in starburst compared to non-starburst objects. Analysing the displacements of starburst objects we find that their far-IR fluxes are boosted by a factor of four on average relative to the remainder of the sample, with a maximum boosting factor of 20 in the case of 3C459.
In addition to our complete sample, we have also plotted a supplementary sample of starburst radio galaxies, taken from the literature on Figure 6. These supplementary sources represent all known radio-loud AGN that show spectroscopic evidence for star formation activity at optical wavelengths, apart from the similar objects in the 2Jy sample. The properties of these sources are presented in Table 3, and they are plotted as open stars in Figure 6. It is clear that these supplementary objects also lie well above the regression line fitted to our data in the 70m plot. A visual inspection of the supplementary starburst sample in Figure 6 also shows a tendency for increased 24 and 70m luminosities, relative to the majority of the sample, at low emission. This is not surprising given that, at low [OIII] luminosities, the AGN itself is intrinsically weak and a modest amount of ongoing star formation can boost the MFIR fluxes well above the regression line.
Due to the high level of completeness of our sample in terms of MFIR detections, our data can also be used to test the statistical significance of any differences between the starburst and non-starburst populations in Figure 6.
First, for our complete sample we have considered a one dimensional Kolmogorov-Smirnoff (K-S) two sample test, comparing the vertical displacements from our fitted regression line in the vs. plot (see also Tadhunter et al., 2007). In this case we find that we can reject the null hypothesis that the starburst and non-starburst samples are drawn from the same parent population at a better than 1% level of significance. We have made the same test, this time including both the 2Jy starburst and the supplementary starburst objects, and investigating whether they are significantly displaced relative to the regression line for the non-starburst 2Jy sample. In that case we find that we can reject the null hypothesis that the starburst and non-starburst samples are drawn from the same parent population at a level of significance of better than 0.1%.
Secondly, we consider the significance of the displacement between the starburst and non-starburst samples using a two dimensional K-S test (Peacock, 1983, Fasano & Franceschini, 1987). The method we apply here is the generalisation of the 2D K-S test developed by Fasano & Franceschini (1987). Again for the vs plot, initially considering the starburst objects against the non-starburst objects (in our complete 2Jy sample), we find that we can reject the null hypothesis that the starburst and non-starburst samples are drawn from the same parent population at a level of significance of better than 5%. We find exactly the same significance level when including the supplementary starburst objects. In addition, applying the same statistical test to the vs. plot we find no differences between the starburst and non-starburst samples, as expected given that the 24m luminosity is less likely to be effected by starburst heating.
There are three notable outliers from the correlation, which are labelled on Figure 6(b). These sources add to the increased scatter in the far-IR, and we describe them in more detail below.
-
•
PKS0347+05 (catalog ). This object lies behind the Galactic plane and, despite the relatively large correction of the [OIII] flux for Galactic extinction, it still lies above our fitted regression line. In a recent analysis of near-IR images for the source it was found that there are, in fact, two AGN within our MFIR photometric aperture for this object. If both AGN radiate at MFIR wavelengths this could perhaps explain some of the apparent excess relative to the correlation. Additionally, since PKS0347+05 (catalog ) is a BLRG, its AGN is likely to outshine any starburst signatures at optical wavelengths. Therefore, it is possible that this object could also have star formation activity that has not so far been detected at optical wavelengths.
- •
-
•
PKS1306-09 (catalog ). This object was discussed in Tadhunter et al. (2002), and shows marginal polarization at optical wavelengths, which could be due to scattered light or a non-thermal optical continuum component. In addition, the extrapolation of the radio component in the SED (see D08) is consistent with non-thermal contamination of the thermal MFIR continuum. So far, the optical spectra are inconclusive regarding the presence of a young stellar component in this object, but it is difficult to entirely rule out the presence of such a component.
| Object | z | (W/Hz) | (W/Hz) | (W) | (W/Hz) | SB ref | [OIII] ref |
|---|---|---|---|---|---|---|---|
| 3C48 | 0.367 | 6 | 4 | ||||
| 3C213.1 | 0.194 | 18 | 11 | ||||
| 3C236 | 0.101 | 1,5 | 2 | ||||
| 3C285 | 0.079 | 1,2 | 2 | ||||
| 3C293 | 0.045 | 7 | 1 | ||||
| 3C305 | 0.042 | 7 | 3 | ||||
| 3C321 | 0.096 | 1,3 | 2 | ||||
| 3C433 | 0.102 | 1,4 | 3 | ||||
| B2 064827 | 0.041 | 12 | 7 | ||||
| B2 072230 | 0.019 | 13,14 | 8 | ||||
| Cen A | 3.4Mpc | 15,16 | 9,10 | ||||
| PKS013136 | 0.030 | 1 | 5 | ||||
| PKS032037 | 0.006 | 8,9 | 5 | ||||
| PKS045320 | 0.035 | 11 | 5 | ||||
| PKS134512 | 0.122 | 1,10 | 6 | ||||
| PKS154979 | 0.152 | 17 | 5 |
Note. — Table 3 supplementary sample comprising of all radio-loud objects from the literature with spectroscopic evidence for recent star formation activity at optical wavelengths. All infrared fluxes were obtained from NED apart from the object 3C305 for which Spitzer/MIPS fluxes were extracted from the archive images. 24 and 70m luminosities for 3C213.1 are derived from IRAS upper limits. SB references: (1) Holt et al. (2007), (2) Aretxaga et al. (2001), (3) Tadhunter et al. (1996), (4) Wills et al. (2002), (5) O’Dea et al. (2001), (6) Canalizo & Stockton (2001), (7) Tadhunter et al. (2005), (8) Goudfrooij et al. (2001), (9) Kuntschner (2000), (10) Rodríguez Zaurín et al. (2007), (11)Wills et al. (2004), (12)Emonts et al. (2006), (13) Emonts (2006), (14) Emonts et al. in preperation, (15) Peng et al. (2002), (16) Peng et al. (2004), (17) Holt et al. (2007), (18) Wills et al. (2008). [OIII] flux references: (1) Emonts et al. (2005), (2) Saunders et al. (1989), (3) Robinson PhD thesis, 2001, Universtiy of Sheffield, (4) Chatzichristou et al. (1999), (5) Tadhunter et al. (1993), (6) Gelderman & Whittle (1994), (7) Emonts et al. (2006), (8) Emonts private communication, (9) Simpson (1998), (10) Storchi-Bergmann et al. (1997), (11) Holt (2005).
5.2 Correlation slope statistics
In the calculation of our fitted regression line plotted in Figure 6, we have chosen not to include those objects identified as having evidence for a starburst component. Using a bootstrap technique we have investigated the uncertainty in the slopes of our fit to these correlations and tested the effect that the removal of the 70m upper limits and starburst objects would have on the regression lines.
In order to investigate the uncertainties, a sample of N data points ( and points from Figure 6) were labelled and then drawn at random to create a group of N replacements for the original sample. We then recalculated the slope and repeated this process 1000 times. Provided the data points are independent, the distribution of the slopes estimated in the bootstrap trials provide an indication of the uncertainty in the estimated slopes.
The data fitted for this bootstrap are identical to those used in the Spearman rank correlation statistics (§4.2) i.e., with redshifts limited to z 0.06 in order to avoid most of the objects with upper limits in their [OIII] luminosity and PKS183948. Here we investigate the effects of including starburst objects and the upper limits in the sample drawn for the N data replacements, in order to quantify their effect on the fitted slopes.
The starburst objects are simply included or excluded when calculating the slope however, exactly as the Spearman rank test (§4.2), the 70m upper limits were included by randomly choosing a ratio of 70m/24m to derive new 70m upper limits. This process was repeated for each of the 1000 bootstrap trials. The results of our analysis are presented in Table 4.
Column 2 of Table 4 contains the values of the slopes we have fitted to the data in Figure 6 (the bisector of a linear least squares fit of on and on ) as well as the slope values calculated with starburst objects excluded. Columns 3 and 4 present the mean value for 1000 slopes of the sample, created using a bootstrap technique, column 3 includes the 70m upper limits and column 4 is for the sample bootstrapped without upper limits.
Considering, in the first instance, the results for the vs. correlation, we find that the addition/removal of the starburst objects and the objects with upper limits in 70m has little effect on the resulting mean slope values, where all values are consistent within the estimated 1 uncertainties.
Secondly, looking at the results in Table 4 for the vs. slopes, it evident, that although the upper limits do not significantly affect the mean regression line slopes and associated uncertainties, the introduction of the starburst sample does. This further supports our hypothesis that the starburst objects are responsible for much of the scatter in the vs. correlation. Excluding the optical starburst objects, the slopes and associated uncertainties of the vs correlation are entirely consistent with those of the vs correlation, reinforcing the idea that the dust radiating at both mid-IR and far-IR wavelengths has a common heating mechanism: AGN illumination.
Given that the bootstrap sample in column 3 is identical to that used to plot the regression line in Figure 6, these statistics map the uncertainty in our slope fit. For the sample with upper limits but not including the starburst objects, we calculate that the uncertainties in our regression line slopes are 0.05 and 0.07 for the 24m and 70m correlations respectively, from the standard deviations of the bootstrap slopes.
| Correlation plot | Bisector | with 70m UL | without 70m UL |
|---|---|---|---|
| 24m vs [OIII] with starburst | 0.78 | 0.79 0.05 | 0.76 0.08 |
| 24m vs [OIII] without starburst | 0.75 | 0.75 0.05 | 0.71 0.07 |
| 70m vs [OIII] with starburst | 0.83 | 0.88 0.11 | 0.93 0.13 |
| 70m vs [OIII] without starburst | 0.71 | 0.72 0.07 | 0.78 0.09 |
Note. — Table 4: Slopes for the complete sample excluding objects with z 0.06 and PKS183948. The uncertainties on the values presented in columns 3 and 4 are the standard deviations of the slopes derived from the 1000 bootstrap cycles.
6 Discussion
6.1 Heating mechanism
On the basis of our observational results, we have concluded that the MFIR continuum emitted by powerful radio galaxies is predominantly a consequence of AGN heating of the circum-nuclear dust. However, far-IR emission from dust heated by starbursts is apparent in the minority of the objects that fall above the main correlations involving 70m.
The link between far-IR bright radio sources and optical evidence for starburst activity has been noted in previous studies. Tadhunter et al. (2002) found that the two objects with the strongest evidence for optical starburst activity in their sample are also the most luminous in the far-IR. Subsequently Wills et al. (2002, 2004), while investigating the UV excess in radio galaxies, also found that those objects with the best evidence for young stars have significantly larger far-IR luminosities than the rest of their sample. The Spitzer results for this 2Jy sample strongly reinforce these earlier results with a much larger sample.
Contrary to our results, previous studies such as those by Rowan-Robinson (1995), van Bemmel & Barthel (2001); van Bemmel & Dullemond (2003), put forward starburst heating as the primary heating mechanism of the dust producing far-IR emission in powerful AGN, albeit without direct evidence. This has encouraged some investigators to search for more direct observational evidence of a starburst/AGN link. For example, Schweitzer et al. (2006) and Netzer et al. (2007) analyzed PAH starburst tracers and MFIR emission. Although unable to detect PAH features in 60% their sample, Schweitzer et al. (2006) suggest that star formation heating most likely accounts for at least 30% of the far-IR emission of their sample of PG quasars, finding a correlation between PAH luminosity at 7.7m and 60m luminosity similar to that of starburst dominated ULIRGs. Although Schweitzer et al. (2006) provide some of the best empirical evidence for a starburst/AGN connection, albeit with many upper limits both in the far-IR and PAH emission, it is not clear that PAH features are exclusively starburst signatures. Indeed, studies such as that by Siebenmorgen et al. (2004) have suggested that it may be possible to produce PAH emission from AGN heating alone if the dust is situated at sufficiently large radii from the AGN.
We have shown that the far-IR continuum luminosities () of the 2Jy radio sources are correlated with their [OIII] luminosities () with a similar slope to the correlation between and . The similarity of the two correlations points towards a common mechanism for producing both the mid and far-IR emission. If we assume, as is generally accepted, that the continuum emission at 24m is heated almost exclusively by the AGN then, in order for the cool dust emitting in the far-IR to be heated predominantly by starbursts rather than the AGN, a remarkable degree of coordination between AGN and starburst activity would be implied. Although we cannot entirely rule out this possibility, we regard it as unlikely.
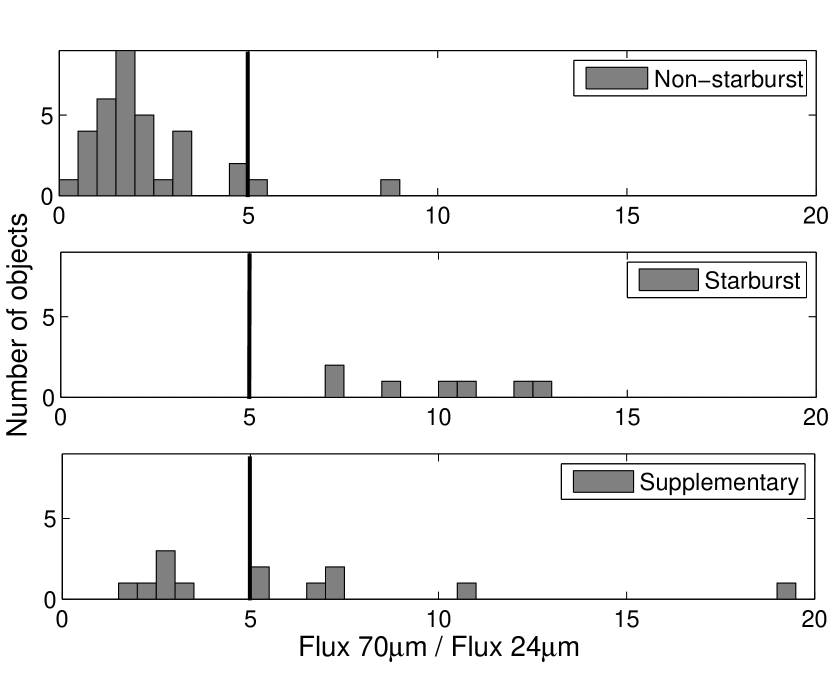
Empirically, starburst galaxies are known to be associated with cool MFIR colours, as expected in the case of illumination of extended dust structures by spatially distributed star forming regions. In Figure 7 we present histograms showing the 70m/24m MFIR colours of the non-starburst, starburst and supplementary samples separately. It is immediately apparent from the plot that all the 2Jy starburst objects have cool colours (), whereas all but two of the non-starburst sample have much warmer colours (). The non-starburst object in Figure 7 with the coolest colour is PKS 0347+05; as discussed above, it is possible that this object may contain as yet undetected star formation at optical wavelengths. Moreover, one of the non-starburst objects whose starburst status is uncertain – PKS1306-09 – also has relatively cool colours (70m/24m = 4.7).
The data presented in Figure 6 can also be used to consider links between AGN and starburst activity. As discussed in §5.1 at low emission line luminosities (W) it is evident that is only weakly correlated with the far-IR luminosity. However, it is notable that all the objects with large 70m luminosities (W/Hz) — many of which we have identified with starburst heating of the cool dust — also have large [OIII] luminosities (W). This suggest a weak link between starburst and AGN activity in the sense that only the most powerful radio-loud AGN are associated with powerful, ULIRG-like starbursts. However, the reverse is not true since many of the highest emission line luminosity objects — some of which are luminous enough at MFIR wavelengths to be classified as LIRGs — do not show evidence for starburst activity, suggesting that powerful AGN are not always accompanied by massive star formation activity. Similar trends have been found in a study of nearby type 2 Seyfert galaxies by González Delgado et al. (2001), who show that, for a given [OIII] luminosity, there are two populations of Seyferts: one with optical evidence for prodigious recent star formation, large far-IR luminosities and cool MFIR colours; the other with little evidence for enhanced star formation activity. However, in the case of the Seyferts, a higher proportion (50%) of objects show evidence for recent star formation activity compared with our sample of radio galaxies.
We can also estimate the rate of energetically significant starburst activity in our sample by considering the main optical and infrared indicators of starbursts: 7 (15%) of the objects in the 2Jy sample show unambiguous spectroscopic evidence for recent star formation activity at optical wavelengths; 9 (20%) have cool MFIR colours (); 12 (26%) of the objects lie more than 0.3 dex (factor2) about the regression line in the vs correlation in Figure 6; and 13 objects (28%) show at least one of these indicators. Therefore we estimate that the proportion of powerful radio-loud AGN showing evidence for energetically significant recent star formation activity is in the range 15-28%.
As first described in Tadhunter et al. (2007), this brings us to a key result: given the lack of a correlation between starburst and AGN activity, and the fact that only a minority of objects in our sample show any evidence for recent star formation activity, it is unlikely that all powerful radio galaxies are triggered at the peaks of major gas rich mergers. This conclusion is strengthened by the fact that not all powerful radio galaxies show tidal tails or other evidence for recent galaxy merger activity (e.g Heckman et al., 1986, Tadhunter et al., 1989, McLure et al., 1999).
6.2 Energetic feasibility
Having found preliminary evidence, based on the correlations between MFIR and [OIII] luminosities, that the MFIR emitting dust is predominantly heated by AGN, it is important to assess whether this heating mechanism is energetically feasible. We start by assuming a simple model in which the far-IR continuum, mid-IR continuum and [OIII] emission lines are produced by AGN illumination of structures with covering factors , and respectively. We make no assumptions about the radial distribution of dust, although the far-IR emitting dust must be situated at larger radial distances from the AGN than the mid-IR emitting dust in order to produce its cooler temperature.
Based on simple recombination theory, the total luminosity (), generated in the narrow line region (NLR) of an AGN, is related to the ionising luminosity () by
where is the mean ionising photon energy, is the energy of an photon, is the total case B recombination coefficient and is the effective recombination coefficient. From the results of Elvis et al. (1994) the bolometric luminosity is related to the ionising luminosity by , therefore
At high luminosities and ionization parameters, . In addition, fits to the line ratios of nearby radio galaxies are consistent with =, corresponding to an ionising continuum shape with () (Robinson et al., 1987). Also, given that (Osterbrock, 1989), we find:
| (1) |
This result can be related to the MFIR luminosities by assuming that the structures producing the MFIR absorb the short wavelength radiation and re-radiate it in the MFIR, then , and similarly . Defining the wavelength range of the mid-IR as 2 – 30m, and that of the far-IR as 30 – 100m, the mid-IR and far-IR bolometric luminosities are defined as:
and
Representing as a power law , we can then write
and
and we can write a similar expression for the . Given our assumption of a simple power-law shape for the MFIR SED, the MFIR spectral index is directly calculated from the MFIR colour:
For our complete sample we find a median MFIR colour of , leading to . Therefore the MFIR monochromatic luminosities can be related to the AGN bolometric luminosities by:
and
By substituting equation (1) into these expressions we find:
| (2) |
and
| (3) |
It is likely that the major uncertainty in is associated with the assumed ratio that may be uncertain by a factor of (Elvis et al., 1994).
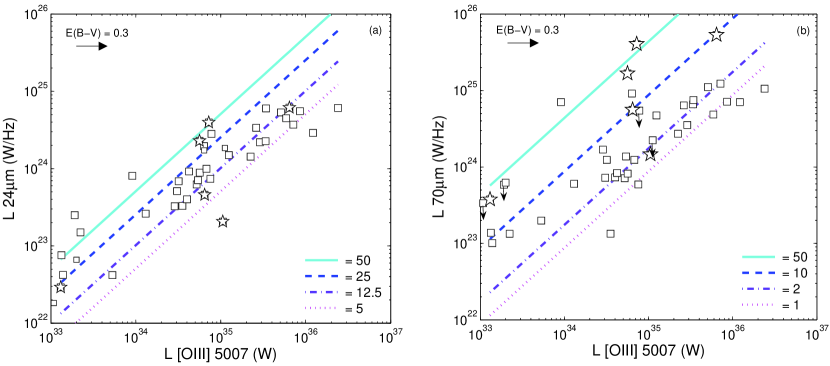
In Figure 8 we have plotted the vs and vs correlations with predictions from our calculations for a range of and covering factor ratios. This allows us to investigate whether the MFIR emission can be explained solely in terms of AGN illumination of the dust. Note that our calculations do not take into account the fact that the vs relationships are non-linear (discussed further in §6.3); the calculated ratio slopes are most relevant to the high luminosity ends of the correlations. Also, in the calculation so far we have assumed that the NLR, the mid-IR and far-IR emitting regions represent discrete structures at different locations in each galaxy, whereas, in fact, it is more likely that there exists a continuous distribution from one region to the next, or an overlap between the regions.
Firstly, Figure 8(a) shows that 5-25 would account for the mid-IR luminosities of the majority of the objects in our sample. However, a value of provides the best description of the high luminosity end of the main correlation (from Figure 6). Therefore NLR clouds cannot be responsible for the bulk of the mid-IR emission of the radio galaxies in our sample, a result consistent with detailed models for the mid-IR emission from NLR clouds (Groves et al., 2006). We further note that much of the scatter in the vs correlation can be explained in terms of variations in .
The absolute covering factor of the dusty torus structure emitting the mid-IR continuum can be estimated by assuming that the NLR has a covering factor in the range 0.02-0.08 (Netzer & Laor, 1993, Maiolino et al., 2001). For this gives . A large is entirely feasible in the context of obscuration by the putative dusty torus required by the orientation-based unified schemes (Barthel, 1989), since a torus with a typical opening half angle in the range would have a covering factor of 0.5-0.7. This calculation also indicates that the covering factor of the NLR must be small () if we require 1. Therefore, it is evident that the 24m continuum emission from the warm dust component can be feasibly powered by AGN heating alone for most of the objects; the relative covering factor of the mid-IR emitting structures is consistent with that expected for a circum-nuclear torus, which is not itself expected to radiate significant forbidden line radiation due to high densities and temperatures.
Secondly, it is clear from Figure 8(b) that the ratio of covering factors required for the emitting dust structures is much less in the far-IR than at mid-IR wavelengths: typically for the main non-starburst sample, corresponding to . Such covering factors are feasible if cool dust is associated with the outer parts of the torus, a kpc-scale dust lane such as those found in many nearby radio galaxies (de Koff et al., 2000), or indeed the NLR itself. In the latter context we note that, if we correct the emission line luminosities for the reddening typical of the NLR of radio galaxies (0.3E(B-V)1.0: Tadhunter et al., 1994, Robinson et al., 2000, Robinson, 2001)777These reddening estimates are based on Balmer line ratio measurements obtained after careful subtraction of the underlying stellar continuum. this will shift many of the points in Figure 8(b) close to the line. Moreover, the NLR in many nearby radio galaxies and PG quasars are extended on sufficiently large spatial scales (1kpc or larger: Bennert et al., 2002, Privon et al., 2008) that the dust associated with them would be heated by the AGN to the relatively cool temperatures required to produce the far-IR radiation. Therefore, rather than being separate entities, it is entirely plausible that the NLR clouds are the dusty structures emitting the far-IR continuum.
We have again marked the starburst objects from our sample in Figure 8. Many of these starburst objects require . If we attempt to explain the far-IR emission in such objects in terms of AGN illumination alone, this raises the question of how the AGN could illuminate the far-IR emitting regions without producing substantial emission line radiation from the gas associated with the dusty structures (i.e. leading to ). One explanation is that the is underestimated, and overestimated, due to dust extinction of the NLR. However, this would require more substantial reddening (E(B-V) 1) than is supported by most observations of the NLR. Therefore the objects that lie above the = 1 line are likely to have their far-IR flux boosted by starburst heating or non-thermal emission. Incidentally, this includes PKS0347+05 (catalog ) and PKS1306-09 (catalog ), which we discussed in §5.1 as possible starburst candidates.
6.3 Correlation slopes
The fitted regression lines from Table 4 (0.75 at 24m and 0.72 at 70m) are plotted on Figure 6. Taking into account the bootstrap uncertainties, the slopes of the correlations are significantly non-linear. It is notable that Maiolino et al. (2007) find a similar slope (0.82) between continuum luminosity at 5100A and infrared luminosity at 6.7m for a sample of 25 high luminosity QSOs. We now consider possible explanations for the non-linear slopes.
First we consider explanations related to the emission line physics of the NLR clouds. The most basic AGN photoionization models assume that the emission-line regions are photoionised by the AGN and that the properties of the emission line region, such as density and covering factor, do not change significantly with AGN power. Considering such a model for a simple optically thick slab, Tadhunter et al. (1998) found that at high luminosities, the relation between and ionising luminosity can be represented as a power-law , where . Assuming that the properties of the torus do not change with luminosity (but see below) and that the MFIR continuum luminosity is directly proportional to and , we therefore expect . This result is consistent with the slopes of our vs correlations as well as that found by Maiolino et al. (2007). However, based on several detailed studies of the emission line spectra of radio galaxies (e.g. Robinson et al., 2000, Taylor et al., 2003), it is likely that the single slab photoionization models are over-simplistic, and that multi-component models for the NLR are more appropriate. In this case the relationship between and is less clear. Moreover, investigations of the relationship between and the continuum luminosities in large samples of AGN provide direct observational evidence for steeper slopes in the relationship between and , albeit with larger scatter ( Netzer et al., 2004, 2006).
Alternatively, we can also consider whether the non-linear slopes are consistent with the basic receding torus model that has been suggested to explain the variation in the BLRG+Q/NLRG fraction with luminosity in the context of the unified schemes (Lawrence, 1991, Hill et al., 1996, Simpson, 1998, 2005). This solution is attractive because it is widely accepted that, if the mid-IR emitting dust lies close to the AGN, the inner radius of the torus at which the dust is sublimated due to illumination by the AGN must depend on AGN power. From simple thermal equilibrium arguments we can relate the distance of the illuminating AGN from the inner face of the torus (r) to the bolometric luminosity () and the sublimation temperature of the dust () as follows:
| (4) |
The area of the inner face of the obscuring torus can be written as where is the thickness of the torus from its mid-plane to its top surface. The covering fraction of the torus is then:
| (5) |
assuming all the radiation absorbed by the face of the torus is re-emitted by dust, and is fixed, then the relationship between emission in the mid-IR at 24m emitted by dust close to the AGN and the bolometric luminosity can be written as:
having substituted equation (5) into equation (4). Finally, assuming that we obtain:
In the context of the receding torus model we now consider three cases with different relationships between and :
-
1.
The relationship between and is linear with =1, and therefore the non-linear slopes of vs correlations are entirely due to the receding torus. In this case which is too shallow to account for the measured correlation slopes, even when considering the uncertainties on the measured slope we have estimated from the bootstrap analysis ( 0.05). Netzer et al. (2004) found evidence for such a linear relationship between and , from the lack of variation of the equivalent width of [OIII] as a function of continuum luminosity. However, there are many upper limits for the high luminosity objects in their sample.
-
2.
The correlation between and is not linear and has a slope , as predicted by simple AGN photoionization models (Tadhunter et al., 1998). If =0.8, as discussed above, then . This value is also significantly shallower than measured from our data.
-
3.
The correlation between and is non-linear and . In this context it is notable that Netzer et al. (2006) find evidence for , based on an analysis of X-ray and emission line properties of luminous AGN. This then gives , which is consistent with the measured slopes within the uncertainties.
Option 1, considering only a receding torus model, cannot satisfactorily explain our results. Simpson (2005) also shows that, assuming isotropic [OIII] emission, the fraction of BLRG/Q increases with AGN luminosity, but with a shallower slope than predicted by a pure receding torus model. He proposes an increase in torus height with luminosity to account for the discrepancy. Although this may not be the only explanation for the observed trends, the Simpson (2005) result shows that there remain questions about the application of the most basic receding torus model.
In this study we have shown that the slope of the vs correlation is similar to that of the vs correlation. If the far-IR radiation is emitted by extended cool dust structures it is clear that these must lie far from the AGN for the typical luminosities of our sources (kpc). In this case it is unlikely that the dust structures will recede in the same way as predicted for the torus. Therefore, while a receding torus might provide a plausible explanation for the non-linearity of the vs correlation (for ) such an explanation is unlikely to apply to the vs correlation.
6.4 Unification
Given the completeness of our sample, the similarities between the MFIR properties of the NLRG and BLRG/Q classes provide excellent support for the orientation-based unified schemes for radio-loud AGN. In addition, our results provide an important constraint for understanding the structure and optical depth of the obscuring torus. The question then remains: how do we reconcile our results with previous studies that did find evidence for significant obscuration at MFIR wavelengths? Apart from sample selection and incompleteness (see §1), there are several factors that may have biased previous studies and led to the finding of a difference between the two classes of radio-loud AGN:
-
•
Classification of BLRG objects: The deep spectra available for all our sample objects allow us to make secure classifications of objects into NLRG, BLRG/Q and WLRG categories. Past studies may have only included those objects with the most luminous broad lines; objects with weaker broad lines may have been missed. Therefore, excluding the weak BLRG from the broad line samples would have biased BLRG/Q towards higher luminosities compared with the NLRG.
-
•
Weak line radio galaxies: From Figure 2 (a) & (b), it is clear that the WLRG lie at the low luminosity end of both the MFIR bands. Many previous studies have not made the distinction between NLRG and WLRG objects. In not recognising these radio-loud galaxies as a separate population, it is clear that the inclusion of WLRG with NLRG would lower the mean MFIR luminosity of samples of NLRG/WLRG, making the BLRG/Q appear relatively stronger emitters at MFIR wavelengths (see Laing et al., 1994 for a a similar discussion relating to the [OIII] luminosities).
-
•
Beamed non-thermal MFIR components: When considering the MFIR emission from radio-loud galaxies, it is important to quantify the degree of non-thermal contamination of the thermal infrared emission from dust. Past investigations that did not account for such contamination (e.g. including flat spectrum objects) may have suffered a bias in their results. Contamination from a beamed non-thermal component is more likely in BLRG/Q oriented close to the line of sight, and therefore could have boosted the MFIR luminosities of some of the BLRG/Q objects in previous studies. As mentioned in Section 4.4 we find no more than 24% of our 2Jy sample have a possibility of contamination from non-thermal beamed components (see Dicken et al. (2008)), consistent with the results presented in Cleary et al. (2007).
Although the results of our study support the unified schemes, further data are required at shorter wavelengths () to provide necessary evidence for greater optical depth in NLRG compared with BLRG/Q objects. Additionally, our results have been based on the assumption that the [OIII] emission line luminosity is isotropic, and it is important to consider whether this assumption is valid.
Previous studies have presented evidence that quasars have higher [OIII]5007 luminosities than radio galaxies (Jackson & Browne, 1990, Haas et al., 2005), similar to the results in opposition to BLRG/Q and NLRG unification in the MFIR (Heckman et al., 1994, Hes et al., 1995). In fact, returning to Figure 2, it is notable that there is a weak tendency for the BLRG/Q sources to have higher [OIII]5007 luminosities than the NLRG sources for a given MFIR luminosity. On the other hand, Hes et al. (1993, 1996) demonstrate that the [OII] line, with its lower ionization potential and critical density, shows no evidence for a difference in luminosity between BLRG/Q and NLRG.
In Figure 9 we present and plotted against total radio luminosity (). A visual inspection of this figure reveals that the distributions of the NLRG and BLRG/Q are similar across several orders of magnitudes. Despite the BLRG/Q having some of the highest luminosities in [OIII] emission lines, there are no significant differences between the two populations in this plot. This is consistent with the findings of Laing et al. (1994), Mulchaey et al. (1994), Tadhunter et al. (1998) and Jackson & Rawlings (1997).
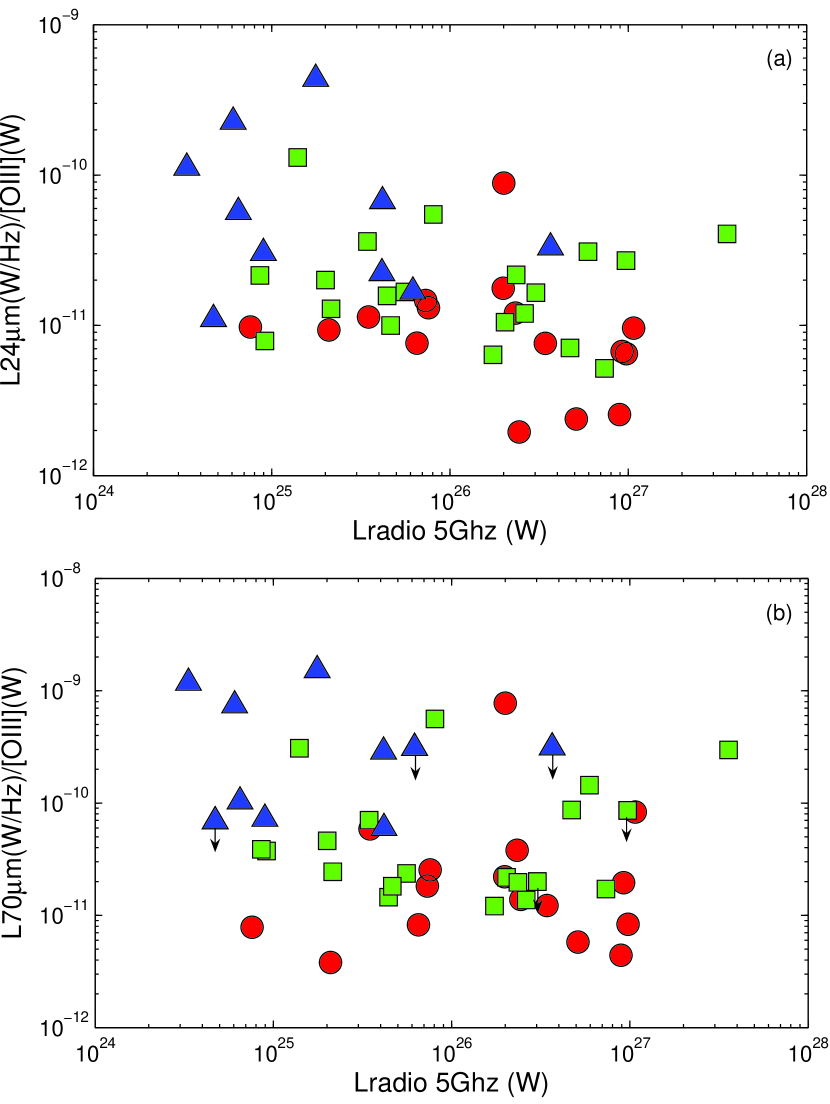
In Figure 10 we again present and plotted against , however in this Figure we have normalized the MFIR luminosities by . If we make the assumption that both the [OIII] and MFIR emission are isotropic then normalising the MFIR luminosity by should reveal no difference in the distribution of the different optical classifications in the plot. However, from a visual inspection of Figure 10, it is clear that, although there is a large scatter, the BLRG/Q objects clearly tend towards lower MFIR/[OIII] ratios than NLRG; the three lowest / ratios, and six lowest / ratios are associated with BLRG/Q. The BLRG/Q clearly tend to lower normalised MFIR luminosities than the NLRG. There are three explanations for such a result.
-
•
The [OIII] emission is isotropic, but the MFIR emission is weaker for a given [OIII] luminosity in the BLRG/Q objects than it is in the NLRG objects. This explanation is difficult to square with the orientation-based unified schemes. In particular, the optical [OIII] emission is more likely to suffer dust obscuration effects due to the circumnuclear torus than the MFIR emission. Moreover, assuming that their jets are truly pointing closer to the line of sight, the BLRG/Q are less likely to be affected by dust obscuration than the NLRG. Note, however, that it is possible that some individual BLRG/Q may have intrinsically under-luminous MFIR emission (e.g. PKS1932-46: see Inskip et al., 2007).
-
•
The [OIII] emission is affected by torus dust obscuration and therefore appears stronger in the BLRG/Q than it is in the NLRG for a given isotropic MFIR luminosity. This explanation is certainly consistent with the orientation-based unified schemes, and the conclusions of various other studies (e.g. Jackson & Rawlings, 1997, Haas et al., 2005). It is also consistent with the observational evidence for narrow line variability on a timescale of years in the BLRG 3C390.3 (Clavel & Wamsteker, 1987, Zheng et al., 1995), which suggests that a proportion of the narrow [OIII] emission may be emitted on a sufficiently small scale to be affected by torus obscuration. On the basis of Figure 10, the degree of anisotropy in [OIII] is a factor 2 – 3 for the majority of the objects, only reaching a factor of 10 in a few extreme cases.
-
•
The [OIII] emission is isotropic but the ratio decreases with luminosity because the covering factor of the torus decreases as the torus recedes. The receding torus model predicts that the BLRG/Q objects will have higher [OIII] luminosities on average than NLRG, even in the absence of dust obscuration, provided that there exists a range of intrinsic AGN luminosities for a given isotropic radio power. This is because the objects hosting the most intrinsically powerful AGN have a greater chance of being detected as BLRG/Q. As the inner face of the torus recedes with the luminosity the covering factor of the torus will decrease. This will lead to the following dependence of the ratio on at fixed radio power: (See Section 6.3) assuming a linear relationship between and . Therefore in order to explain the BLRG/Q ratios that are a factor lower than the average NLRG, we would require the BLRG/Q to be intrinsically more luminous than the NLRG at a given radio power by a factor of . However as discussed in Section 6.3 it is unlikely that this explanation can apply to the ratio because the structures emitting the far-IR continuum are unlikely to recede as envisaged by the receding torus model.
7 Summary
We have presented an analysis of deep Spitzer (MIPS) observations for a complete subset of the 2Jy sample. The main results are as follows:
-
1.
Heating mechanism: We find tight correlations between the MFIR luminosities and the [OIII] luminosities, with similar slopes for both 24 and 70m correlations (0.75 at 24m and 0.72 at 70m). Given that [OIII] is an indicator of intrinsic AGN strength, we conclude that direct AGN illumination is the primary heating source for the dust producing both the mid-IR and far-IR continuum. These correlations are better than those between MFIR and radio luminosities, and between radio and [OIII] luminosities.
-
2.
Energetics and dust geometry: Using simple arguments we have demonstrated that heating of MFIR-emitting dust structures by AGN illumination is energetically feasible. We identify the dust structure producing the mid-IR continuum with the circum-nuclear torus, and the dust structure producing far-IR continuum with the NLR clouds.
-
3.
Slopes of the correlations: Our finding of a non-linear slope in the vs. correlation is quantitatively in support of the simple receding torus model; however, this result can also be explained in terms of a non-linear correlation between the strength of [OIII] optical emission line luminosity and the AGN ionising luminosity.
-
4.
Unified schemes: Contrary to some previous studies we find no strong evidence for increased obscuration of MFIR emission of NLRG compared to BLRG/Q; the MFIR luminosities of NLRG and BLRG/Q also cover a similar range. These results fully support the orientation-based unified schemes, and we hypothesise that previous studies may have been affected by incomplete, heterogeneous, meager and/or low S/N data.
-
5.
Weak Line radio galaxies: The WLRG in our sample are found to have weak MFIR continuum emission as well as weak [OIII] emission line emission. This implies that the AGN in WLRGs are intrinsically low luminosity objects, and that their weak optical emission lines are not simply a consequence of enhanced dust obscuration by circum-nuclear dust.
-
6.
Starburst heating and triggering: We have analysed the increased scatter in the distribution of vs. compared to the vs. correlation. We find that the increased scatter is due, in part, to enhanced heating by starbursts in the objects in our sample that show evidence for recent star formation activity at optical wavelengths. The relatively low incidence of energetically significant starburst activity in our sample (15-28%) has implications for our understanding of the triggering and evolution of radio-loud AGN. In particular, only a minority are likely to be triggered close to the peak of major gas rich mergers with associated starburst activity. Clearly, a variety of triggering mechanisms must be present.
-
7.
Anisotropy of [OIII] emission: Finding lower ratios of MFIR/[OIII] of BLRG/Q compared to those of NLRG, we have concluded that the most likely explanation for this result is that there is mild anisotropy (typically factor 2-3) in the [OIII] emission due to obscuration by the circumnuclear dust in the NLRG that is not seen in the BLRG/Q.
References
- Archibald et al. (2001) Archibald, E. N., Dunlop, J. S., Hughes, D. H., Rawlings, S., Eales, S. A., & Ivison, R. J. 2001, MNRAS, 323, 417
- Aretxaga et al. (2001) Aretxaga, I., Terlevich, E., Terlevich, R. J., Cotter, G., & Díaz, Á. I. 2001, MNRAS, 325, 636
- Barthel (1989) Barthel, P. D. 1989, ApJ, 336, 606
- Barthel & Arnaud (1996) Barthel, P. D., & Arnaud, K. A. 1996, MNRAS, 283, L45
- Bennert et al. (2002) Bennert, N., Falcke, H., Schulz, H., Wilson, A. S., & Wills, B. J. 2002, ApJ, 574, L105
- Canalizo & Stockton (2001) Canalizo, G., & Stockton, A. 2001, ApJ, 555, 719
- Cao & Rawlings (2004) Cao, X., & Rawlings, S. 2004, MNRAS, 349, 1419
- Chatzichristou et al. (1999) Chatzichristou, E. T., Vanderriest, C., & Jaffe, W. 1999, A&A, 343, 407
- Clavel & Wamsteker (1987) Clavel, J., & Wamsteker, W. 1987, ApJ, 320, L9
- Cleary et al. (2007) Cleary, K., Lawrence, C. R., Marshall, J. A., Hao, L., & Meier, D. 2007, ApJ, 660, 117
- de Koff et al. (2000) de Koff, S., Best, P., Baum, S. A., Sparks, W., Röttgering, H., Miley, G., Golombek, D., Macchetto, F., & Martel, A. 2000, ApJS, 129, 33
- di Matteo et al. (2005) di Matteo, P., Capuzzo Dolcetta, R., & Miocchi, P. 2005, Celestial Mechanics and Dynamical Astronomy, 91, 59
- di Serego-Alighieri et al. (1994) di Serego-Alighieri, S., Danziger, I. J., Morganti, R., & Tadhunter, C. N. 1994, MNRAS, 269, 998
- Dicken et al. (2008) Dicken, D., Tadhunter, C., Morganti, R., Buchanan, C., Oosterloo, T., & Axon, D. 2008, ApJ, 678, 712
- Elvis et al. (1994) Elvis, M., Wilkes, B. J., McDowell, J. C., Green, R. F., Bechtold, J., Willner, S. P., Oey, M. S., Polomski, E., & Cutri, R. 1994, ApJS, 95, 1
- Emonts (2006) Emonts, B. 2006, PhD thesis, University of Groningen
- Emonts et al. (2006) Emonts, B. H. C., Morganti, R., Tadhunter, C. N., Holt, J., Oosterloo, T. A., van der Hulst, J. M., & Wills, K. A. 2006, A&A, 454, 125
- Emonts et al. (2005) Emonts, B. H. C., Morganti, R., Tadhunter, C. N., Oosterloo, T. A., Holt, J., & van der Hulst, J. M. 2005, MNRAS, 362, 931
- Fasano & Franceschini (1987) Fasano, G., & Franceschini, A. 1987, MNRAS, 225, 155
- Fritz et al. (2006) Fritz, J., Franceschini, A., & Hatziminaoglou, E. 2006, MNRAS, 366, 767
- Gelderman & Whittle (1994) Gelderman, R., & Whittle, M. 1994, ApJS, 91, 491
- Golombek et al. (1988) Golombek, D., Miley, G. K., & Neugebauer, G. 1988, AJ, 95, 26
- González Delgado et al. (2001) González Delgado, R. M., Heckman, T., & Leitherer, C. 2001, ApJ, 546, 845
- Goudfrooij et al. (2001) Goudfrooij, P., Mack, J., Kissler-Patig, M., Meylan, G., & Minniti, D. 2001, MNRAS, 322, 643
- Granato & Danese (1994) Granato, G. L., & Danese, L. 1994, MNRAS, 268, 235
- Groves et al. (2006) Groves, B., Dopita, M., & Sutherland, R. 2006, A&A, 458, 405
- Haas et al. (2004) Haas, M., Müller, S. A. H., Bertoldi, F., Chini, R., Egner, S., Freudling, W., Klaas, U., Krause, O., Lemke, D., Meisenheimer, K., Siebenmorgen, R., & van Bemmel, I. 2004, A&A, 424, 531
- Haas et al. (2005) Haas, M., Siebenmorgen, R., Schulz, B., Krügel, E., & Chini, R. 2005, A&A, 442, L39
- Hardcastle et al. (2007) Hardcastle, M. J., Evans, D. A., & Croston, J. H. 2007, MNRAS, 376, 1849
- Heckman et al. (1992) Heckman, T. M., Chambers, K. C., & Postman, M. 1992, ApJ, 391, 39
- Heckman et al. (1994) Heckman, T. M., O’Dea, C. P., Baum, S. A., & Laurikainen, E. 1994, ApJ, 428, 65
- Heckman et al. (1986) Heckman, T. M., Smith, E. P., Baum, S. A., van Breugel, W. J. M., Miley, G. K., Illingworth, G. D., Bothun, G. D., & Balick, B. 1986, ApJ, 311, 526
- Hes et al. (1993) Hes, R., Barthel, P. D., & Fosbury, R. A. E. 1993, Nature, 362, 326
- Hes et al. (1996) —. 1996, A&A, 313, 423
- Hes et al. (1995) Hes, R., Barthel, P. D., & Hoekstra, H. 1995, A&A, 303, 8
- Hill et al. (1996) Hill, G. J., Goodrich, R. W., & Depoy, D. L. 1996, ApJ, 462, 163
- Holt (2005) Holt, J. 2005, PhD thesis, University of Sheffield
- Holt et al. (2007) Holt, J., Tadhunter, C. N., González Delgado, R. M., Inskip, K. J., Rodriguez, J., Emonts, B. H. C., Morganti, R., & Wills, K. A. 2007, MNRAS, 381, 611
- Howarth (1983) Howarth, I. D. 1983, MNRAS, 203, 301
- Impey & Gregorini (1993) Impey, C., & Gregorini, L. 1993, AJ, 105, 853
- Inskip et al. (2007) Inskip, K. J., Tadhunter, C. N., Dicken, D., Holt, J., Villar-Martín, M., & Morganti, R. 2007, MNRAS, 382, 95
- Jackson & Browne (1990) Jackson, N., & Browne, I. W. A. 1990, Nature, 343, 43
- Jackson & Rawlings (1997) Jackson, N., & Rawlings, S. 1997, MNRAS, 286, 241
- Kuntschner (2000) Kuntschner, H. 2000, MNRAS, 315, 184
- Laing et al. (1994) Laing, R. A., Jenkins, C. R., Wall, J. V., & Unger, S. W. 1994, in Astronomical Society of the Pacific Conference Series, Vol. 54, The Physics of Active Galaxies, ed. G. V. Bicknell, M. A. Dopita, & P. J. Quinn, 201–+
- Lawrence (1991) Lawrence, A. 1991, MNRAS, 252, 586
- Maiolino et al. (2001) Maiolino, R., Marconi, A., & Oliva, E. 2001, A&A, 365, 37
- Maiolino et al. (2007) Maiolino, R., Shemmer, O., Imanishi, M., Netzer, H., Oliva, E., Lutz, D., & Sturm, E. 2007, A&A, 468, 979
- McLure et al. (1999) McLure, R. J., Kukula, M. J., Dunlop, J. S., Baum, S. A., O’Dea, C. P., & Hughes, D. H. 1999, MNRAS, 308, 377
- Meisenheimer et al. (2001) Meisenheimer, K., Haas, M., Müller, S. A. H., Chini, R., Klaas, U., & Lemke, D. 2001, A&A, 372, 719
- Miley et al. (1984) Miley, G., Neugebauer, G., Soifer, B. T., Clegg, P. E., Harris, S., Rowan-Robinson, M., & Young, E. 1984, ApJ, 278, L79
- Morganti et al. (1997) Morganti, R., Oosterloo, T. A., Reynolds, J. E., Tadhunter, C. N., & Migenes, V. 1997, MNRAS, 284, 541
- Mulchaey et al. (1994) Mulchaey, J. S., Koratkar, A., Ward, M. J., Wilson, A. S., Whittle, M., Antonucci, R. R. J., Kinney, A. L., & Hurt, T. 1994, ApJ, 436, 586
- Nenkova et al. (2002) Nenkova, M., Ivezić, Ž., & Elitzur, M. 2002, ApJ, 570, L9
- Netzer & Laor (1993) Netzer, H., & Laor, A. 1993, ApJ, 404, L51
- Netzer et al. (2007) Netzer, H., Lutz, D., Schweitzer, M., Contursi, A., Sturm, E., Tacconi, L. J., Veilleux, S., Kim, D.-C., Rupke, D., Baker, A. J., Dasyra, K., Mazzarella, J., & Lord, S. 2007, ApJ, 666, 806
- Netzer et al. (2006) Netzer, H., Mainieri, V., Rosati, P., & Trakhtenbrot, B. 2006, A&A, 453, 525
- Netzer et al. (2004) Netzer, H., Shemmer, O., Maiolino, R., Oliva, E., Croom, S., Corbett, E., & di Fabrizio, L. 2004, ApJ, 614, 558
- O’Dea et al. (2001) O’Dea, C. P., Koekemoer, A. M., Baum, S. A., Sparks, W. B., Martel, A. R., Allen, M. G., Macchetto, F. D., & Miley, G. K. 2001, AJ, 121, 1915
- Osterbrock (1989) Osterbrock, D. E. 1989, Astrophysics of gaseous nebulae and active galactic nuclei (Research supported by the University of California, John Simon Guggenheim Memorial Foundation, University of Minnesota, et al. Mill Valley, CA, University Science Books, 1989, 422 p.)
- Peacock (1983) Peacock, J. A. 1983, MNRAS, 202, 615
- Peng et al. (2004) Peng, E. W., Ford, H. C., & Freeman, K. C. 2004, ApJ, 602, 705
- Peng et al. (2002) Peng, E. W., Ford, H. C., Freeman, K. C., & White, R. L. 2002, AJ, 124, 3144
- Pier & Krolik (1992) Pier, E. A., & Krolik, J. H. 1992, ApJ, 401, 99
- Pier & Krolik (1993) —. 1993, ApJ, 418, 673
- Polletta et al. (2000) Polletta, M., Courvoisier, T. J.-L., Hooper, E. J., & Wilkes, B. J. 2000, A&A, 362, 75
- Privon et al. (2008) Privon, G. C., O’Dea, C. P., Baum, S. A., Axon, D. J., Kharb, P., Buchanan, C. L., Sparks, W., & Chiaberge, M. 2008, ApJS, 175, 423
- Rawlings & Saunders (1991) Rawlings, S., & Saunders, R. 1991, Nature, 349, 138
- Robinson (2001) Robinson, A. 2001, PhD thesis, University of Sheffield
- Robinson et al. (1987) Robinson, A., Binette, L., Fosbury, R. A. E., & Tadhunter, C. N. 1987, MNRAS, 227, 97
- Robinson et al. (2000) Robinson, T. G., Tadhunter, C. N., Axon, D. J., & Robinson, A. 2000, MNRAS, 317, 922
- Rodríguez Zaurín et al. (2007) Rodríguez Zaurín, J., Holt, J., Tadhunter, C. N., & González Delgado, R. M. 2007, MNRAS, 375, 1133
- Rowan-Robinson (1995) Rowan-Robinson, M. 1995, MNRAS, 272, 737
- Sanders & Mirabel (1996) Sanders, D. B., & Mirabel, I. F. 1996, ARA&A, 34, 749
- Saunders et al. (1989) Saunders, R., Baldwin, J. E., Rawlings, S., Warner, P. J., & Miller, L. 1989, MNRAS, 238, 777
- Schweitzer et al. (2006) Schweitzer, M., Lutz, D., Sturm, E., Contursi, A., Tacconi, L. J., Lehnert, M. D., Dasyra, K. M., Genzel, R., Veilleux, S., Rupke, D., Kim, D.-C., Baker, A. J., Netzer, H., Sternberg, A., Mazzarella, J., & Lord, S. 2006, ApJ, 649, 79
- Shi et al. (2005) Shi, Y., Rieke, G. H., Hines, D. C., Neugebauer, G., Blaylock, M., Rigby, J., Egami, E., Gordon, K. D., & Alonso-Herrero, A. 2005, ApJ, 629, 88
- Siebenmorgen et al. (2004) Siebenmorgen, R., Freudling, W., Krügel, E., & Haas, M. 2004, A&A, 421, 129
- Simpson (1998) Simpson, C. 1998, MNRAS, 297, L39
- Simpson (2005) —. 2005, MNRAS, 360, 565
- Storchi-Bergmann et al. (1997) Storchi-Bergmann, T., Bica, E., Kinney, A. L., & Bonatto, C. 1997, MNRAS, 290, 231
- Tadhunter et al. (2007) Tadhunter, C., Dicken, D., Holt, J., Inskip, K., Morganti, R., Axon, D., Buchanan, C., González Delgado, R., Barthel, P., & van Bemmel, I. 2007, ApJ, 661, L13
- Tadhunter et al. (2002) Tadhunter, C., Dickson, R., Morganti, R., Robinson, T. G., Wills, K., Villar-Martin, M., & Hughes, M. 2002, MNRAS, 330, 977
- Tadhunter et al. (2005) Tadhunter, C., Robinson, T. G., González Delgado, R. M., Wills, K., & Morganti, R. 2005, MNRAS, 356, 480
- Tadhunter et al. (1996) Tadhunter, C. N., Dickson, R. C., & Shaw, M. A. 1996, MNRAS, 281, 591
- Tadhunter et al. (1989) Tadhunter, C. N., Fosbury, R. A. E., & Quinn, P. J. 1989, MNRAS, 240, 225
- Tadhunter et al. (1994) Tadhunter, C. N., Metz, S., & Robinson, A. 1994, MNRAS, 268, 989
- Tadhunter et al. (1993) Tadhunter, C. N., Morganti, R., di Serego-Alighieri, S., Fosbury, R. A. E., & Danziger, I. J. 1993, MNRAS, 263, 999
- Tadhunter et al. (1998) Tadhunter, C. N., Morganti, R., Robinson, A., Dickson, R., Villar-Martin, M., & Fosbury, R. A. E. 1998, MNRAS, 298, 1035
- Taylor et al. (2003) Taylor, M. D., Tadhunter, C. N., & Robinson, T. G. 2003, MNRAS, 342, 995
- van Bemmel & Barthel (2001) van Bemmel, I., & Barthel, P. 2001, A&A, 379, L21
- van Bemmel et al. (2000) van Bemmel, I. M., Barthel, P. D., & de Graauw, T. 2000, A&A, 359, 523
- van Bemmel & Dullemond (2003) van Bemmel, I. M., & Dullemond, C. P. 2003, A&A, 404, 1
- Wall & Peacock (1985) Wall, J. V., & Peacock, J. A. 1985, MNRAS, 216, 173
- Wills et al. (2004) Wills, K. A., Morganti, R., Tadhunter, C. N., Robinson, T. G., & Villar-Martin, M. 2004, MNRAS, 347, 771
- Wills et al. (2008) Wills, K. A., Tadhunter, C., Holt, J., González Delgado, R., Inskip, K. J., Rodríguez Zaurín, J., & Morganti, R. 2008, MNRAS, 385, 136
- Wills et al. (2002) Wills, K. A., Tadhunter, C. N., Robinson, T. G., & Morganti, R. 2002, MNRAS, 333, 211
- Zheng et al. (1995) Zheng, W., Perez, E., Grandi, S. A., & Penston, M. V. 1995, AJ, 109, 2355