Spitzer/IRS Mapping of Local Luminous Infrared Galaxies
Abstract
We present results of our program Spitzer/IRS Mapping of local Luminous Infrared Galaxies (LIRGs). The maps cover the central or regions of the galaxies, and use all four IRS modules to cover the full m spectral range. We have built spectral maps of the main mid-IR emission lines, continuum and PAH features, and extracted 1D spectra for regions of interest in each galaxy. The final goal is to fully characterize the mid-IR properties of local LIRGs as a first step to understanding their more distant counterparts.
1 Introduction
Luminous Infrared Galaxies (LIRGs, ) are an important cosmological class of galaxies as they are the main contributors to the co-moving star formation rate density of the universe at . Moreover, the mid-IR spectra of high redshift () very luminous IR galaxies () appear to be better reproduced with those of local starbursts and LIRGs. This may just reflect the fact that at high-z star-formation was taking place over a few kiloparsec scales rather than in very compact (kpc) regions.
We used the spectral mapping capability of IRS on Spitzer with low (SL+LL modules, , m) and high (SH+LH modules, , m) spectral resolution (see AAH08 for details) to observe 12 local (distances of 75Mpc) LIRGs selected from the sample of AAH06 . The maps cover the central or regions of the galaxies. The spectral data cubes were assembled with CUBISM Smith .
2 Results
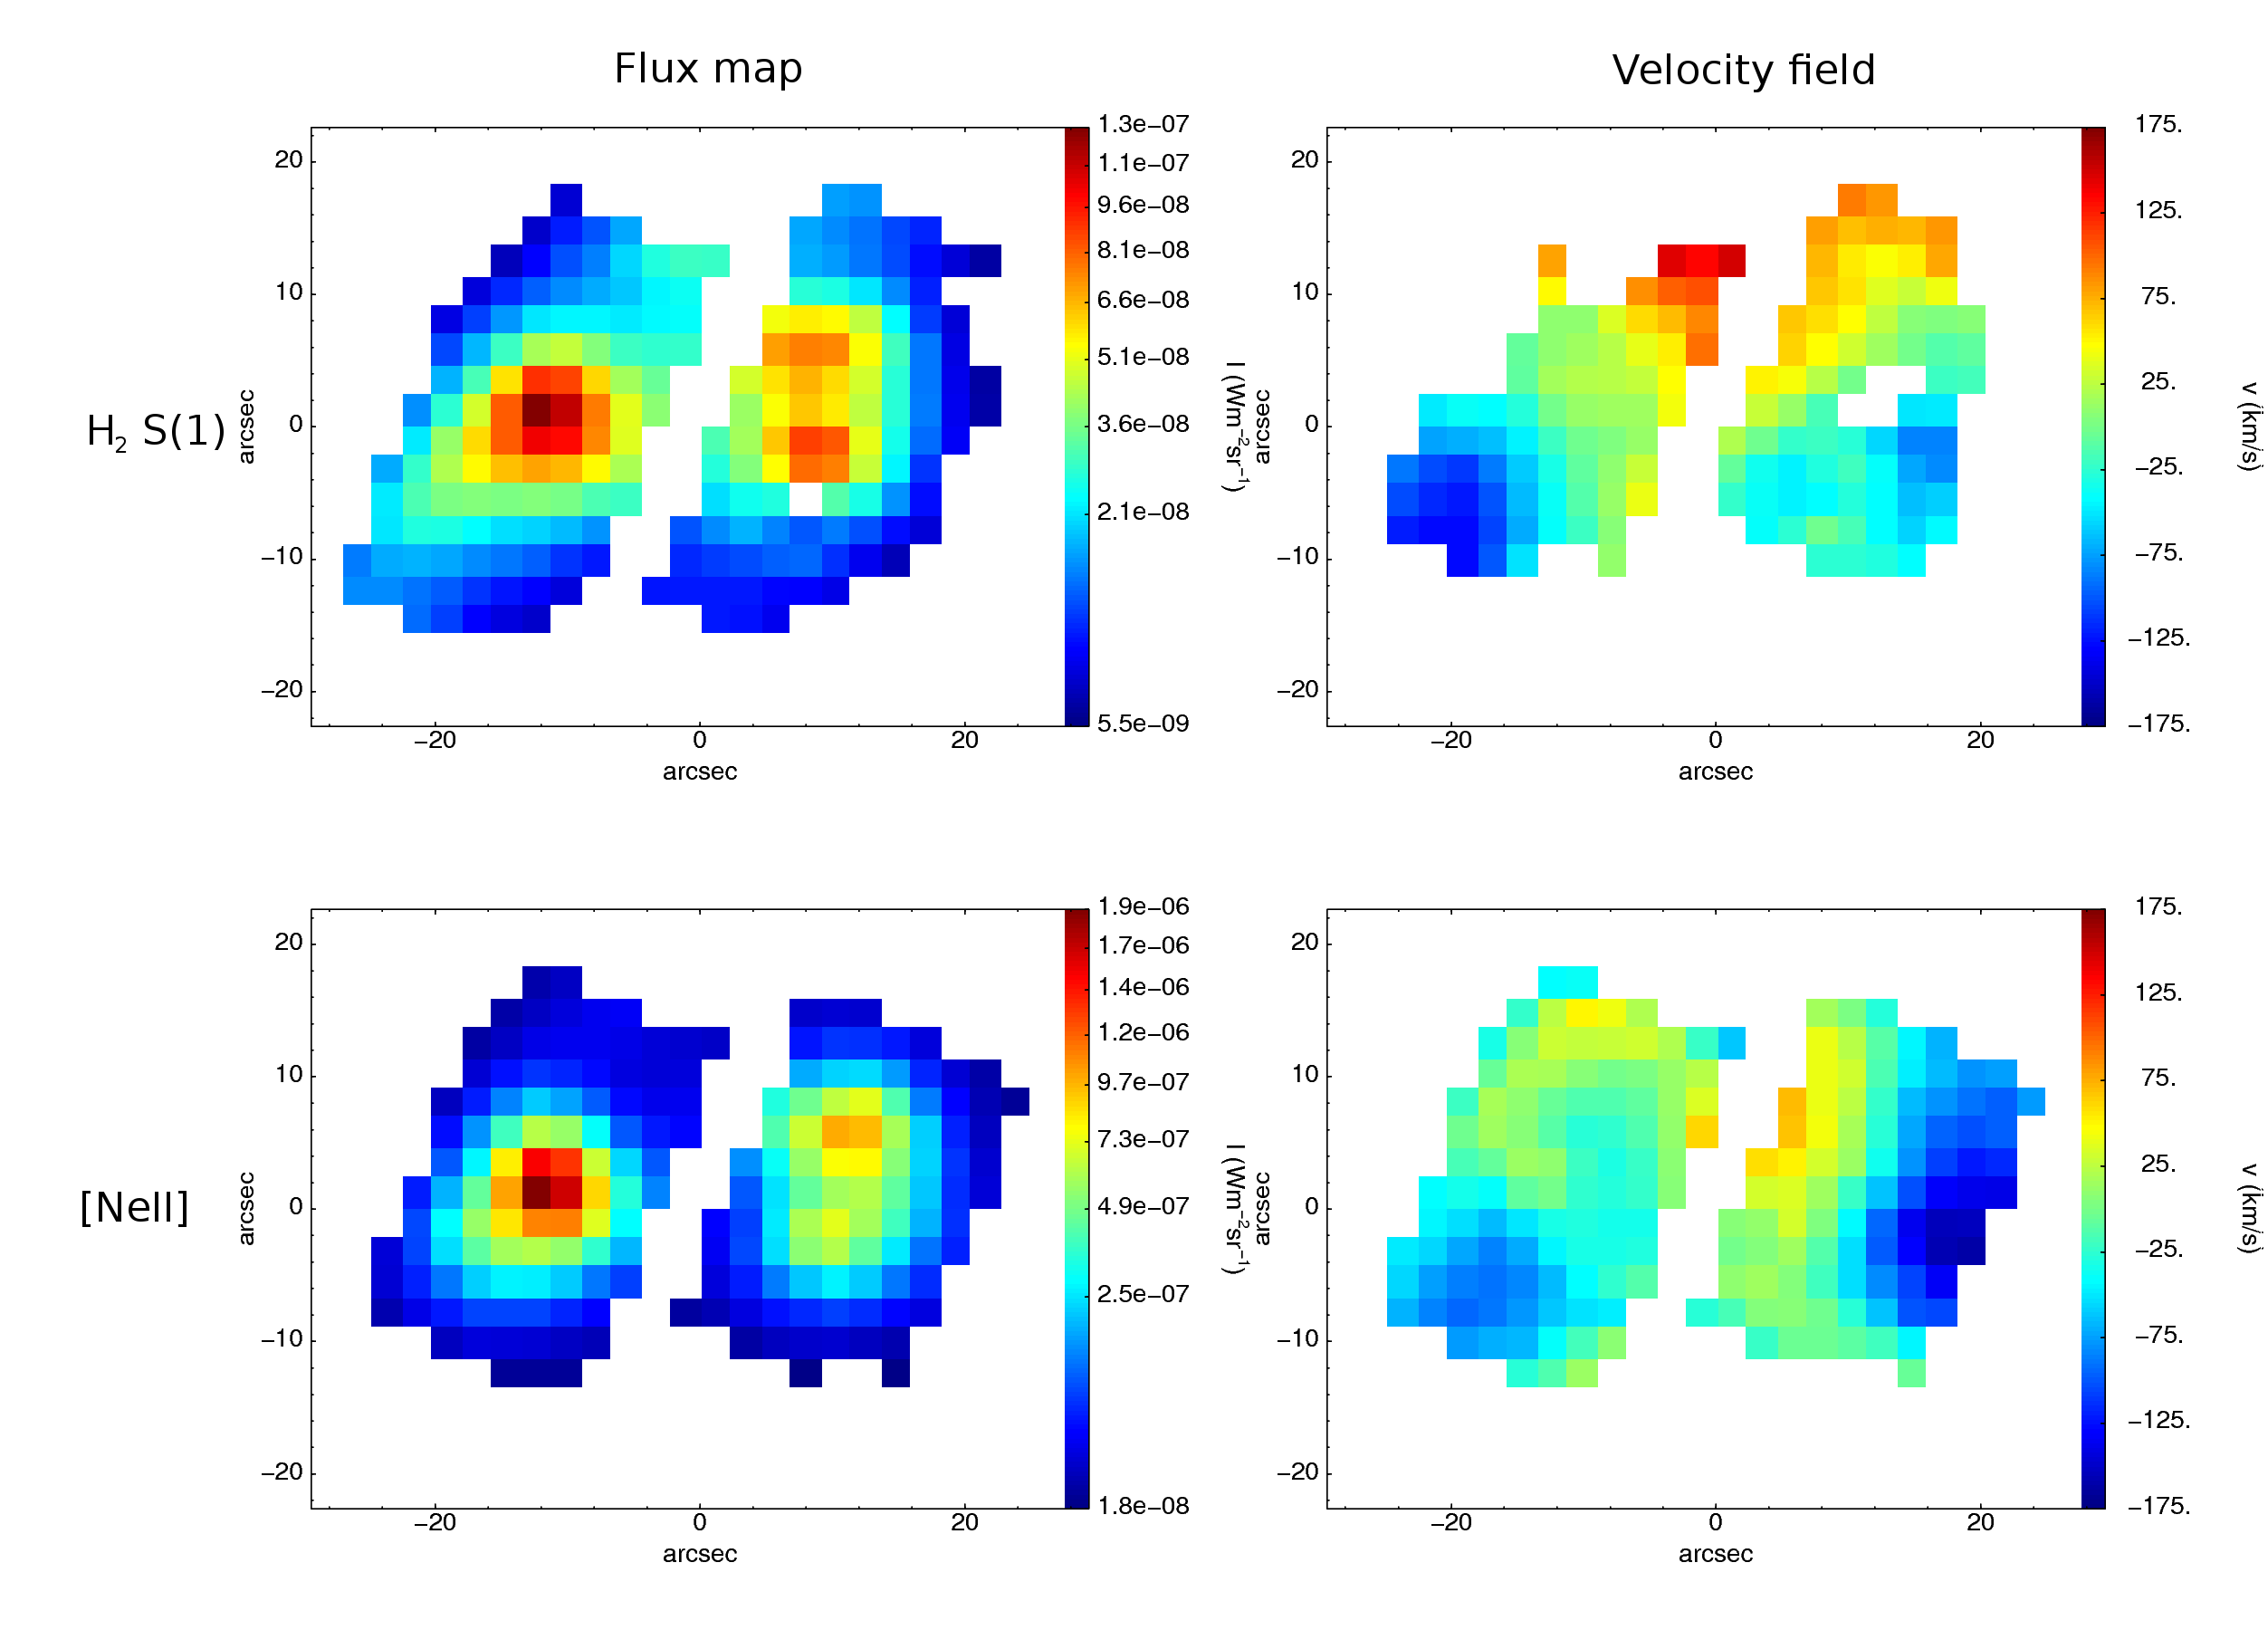
2.1 Maps of emission lines and velocity fields
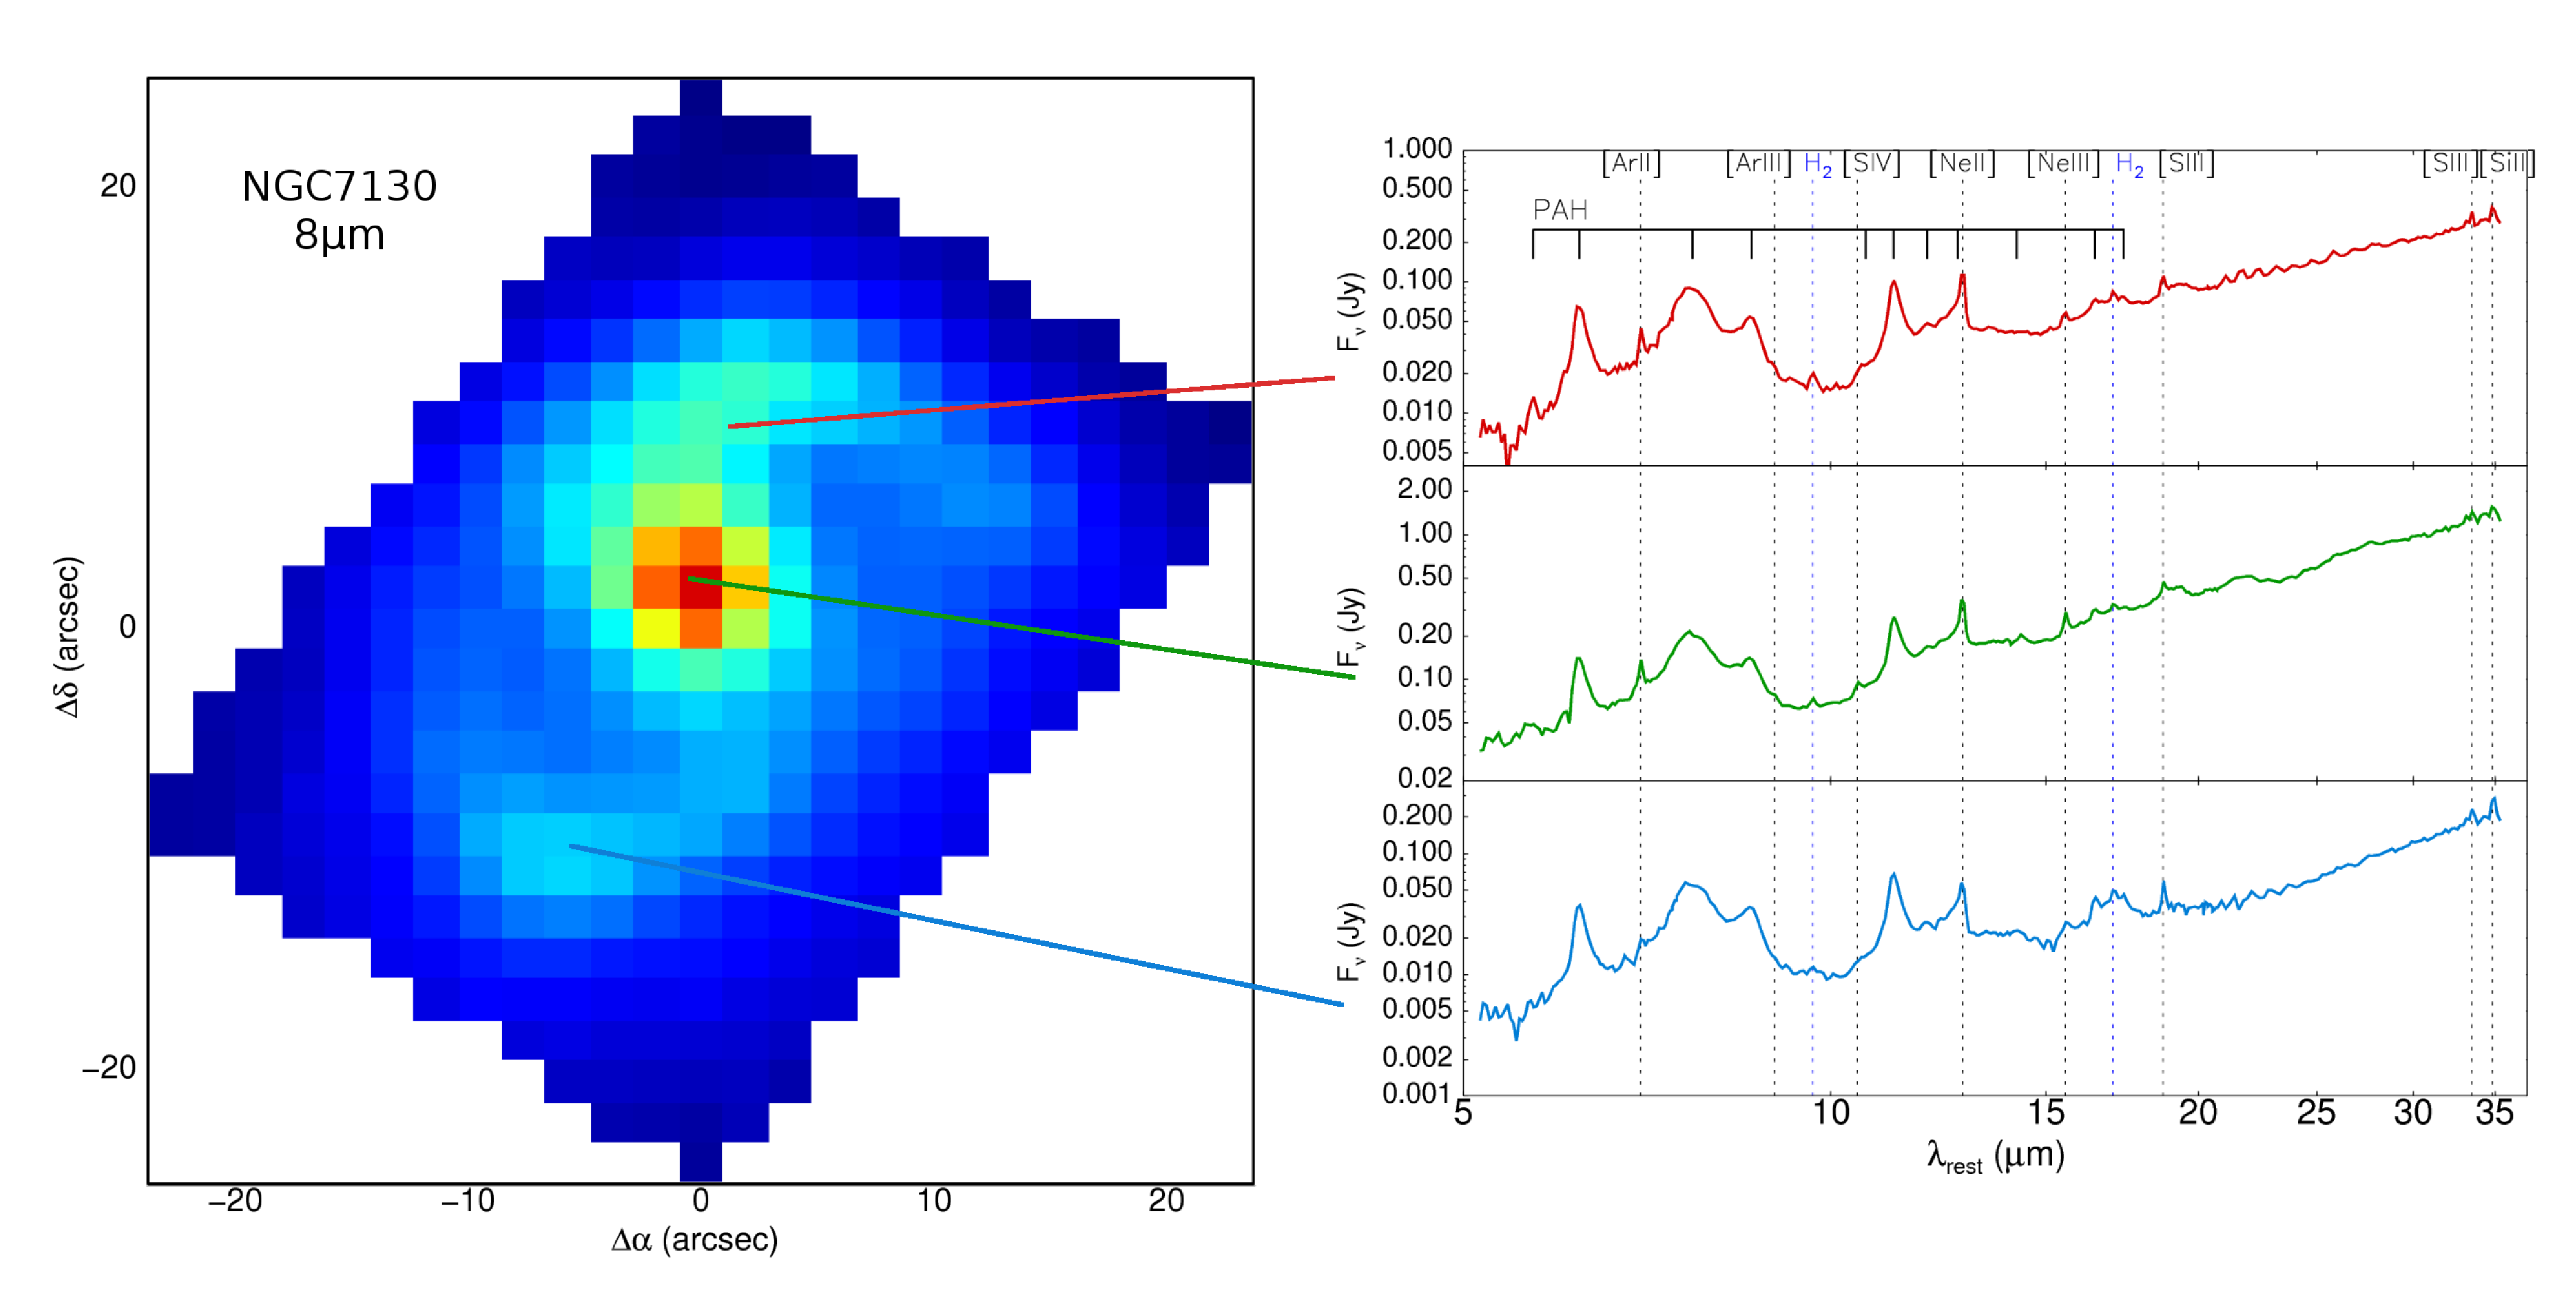
We fitted the brightest emission lines in the cubes using Gaussians for the emission lines and an order one polynomial for the local continuum. We obtained spectral maps of the line fluxes, line ratios, FWMHs and velocities (see Fig. 1 and Fig. 2). The spectral maps allow us to select regions of interest in each galaxy and extract 1D spectra to study their physical properties (Fig. 3).

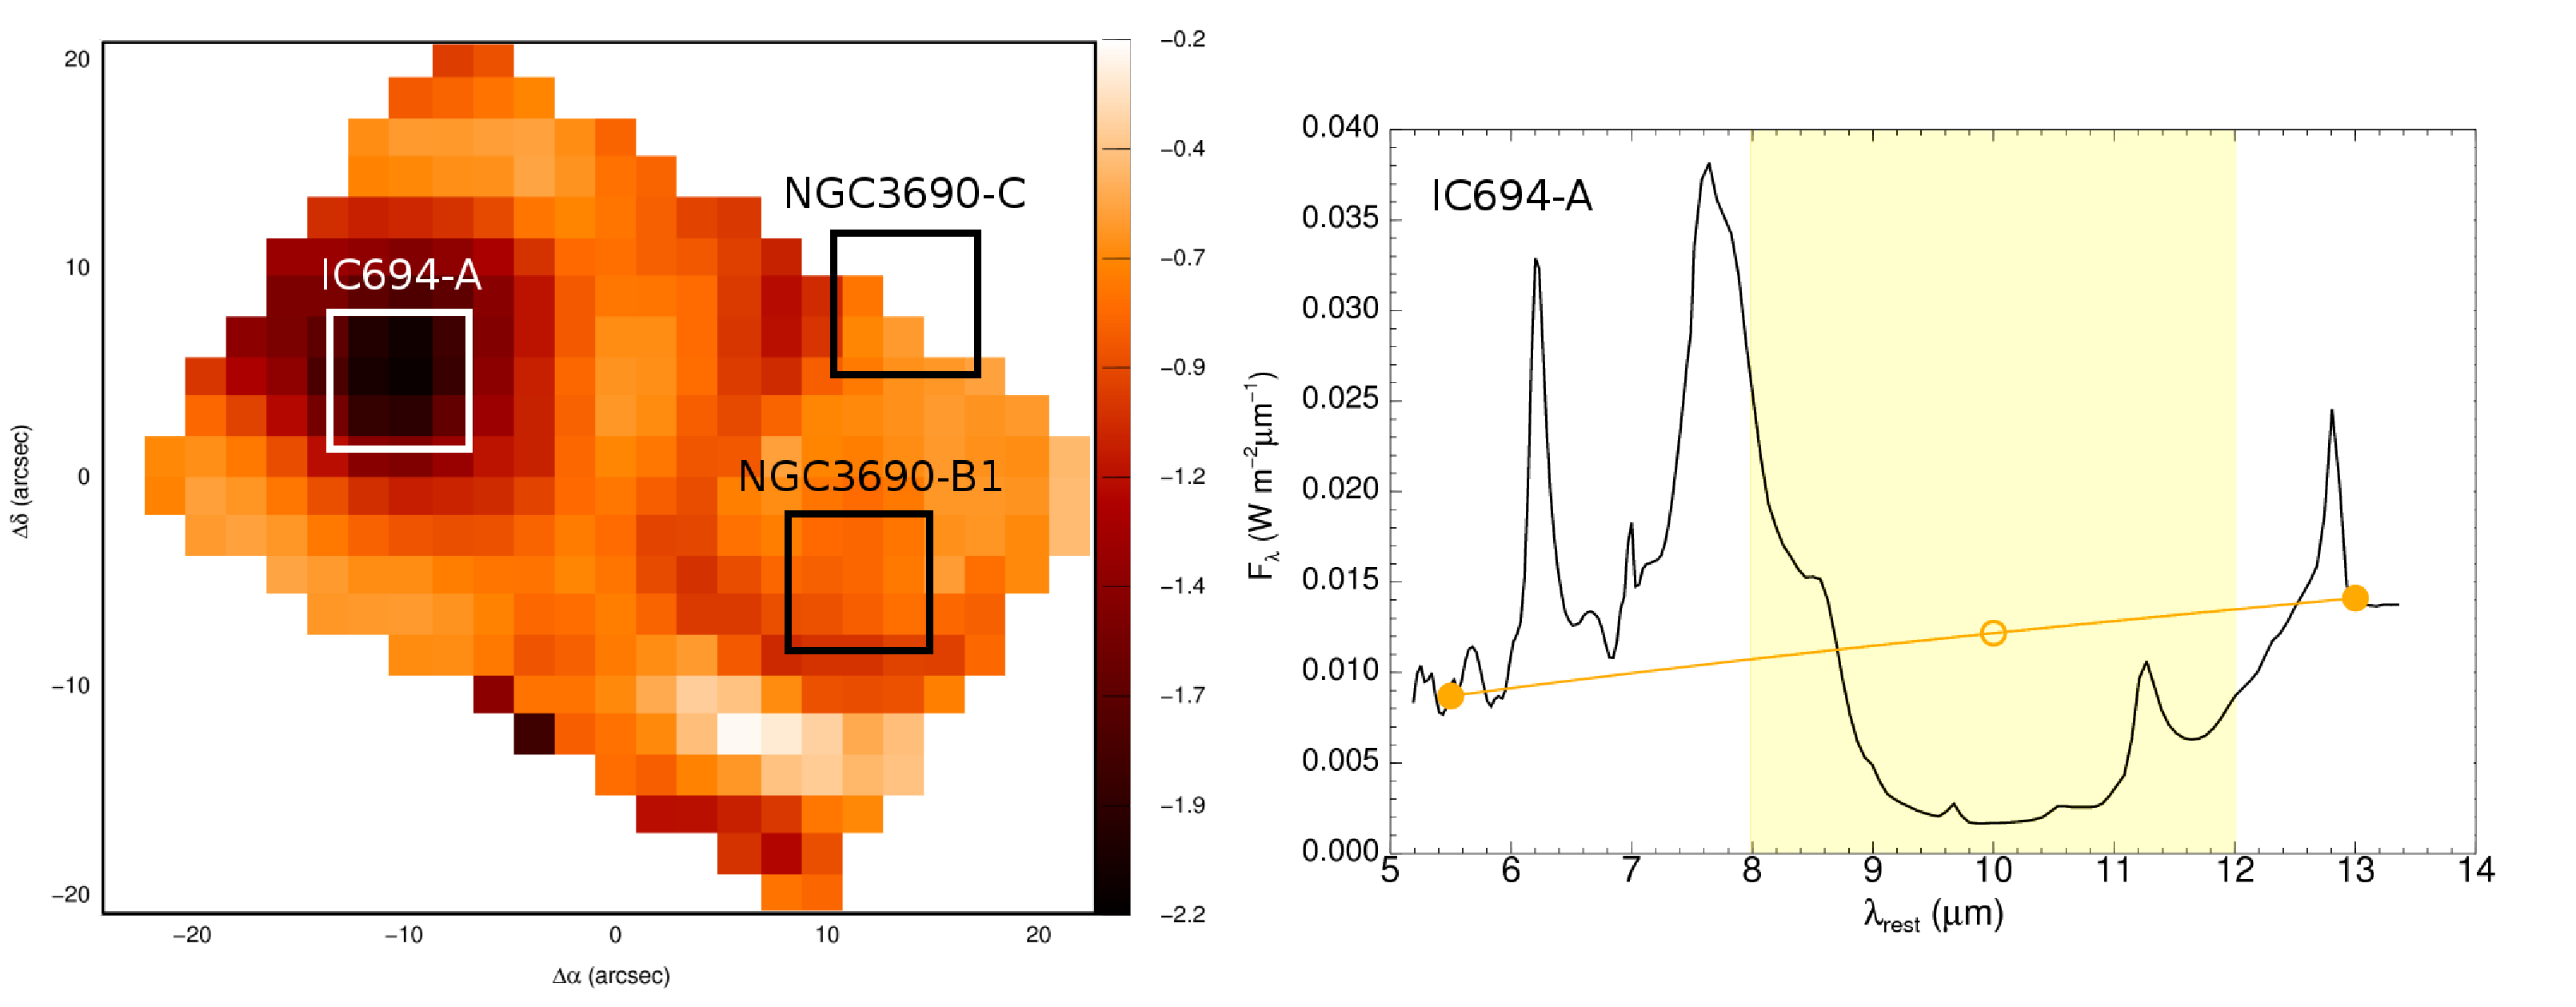
2.2 Silicate absorption
Amorphous silicate grains have a broad absorption feature centered at m. To measure its depth we used a method similar to that proposed by Spoon et al. Spoon . The continuum at m is estimated by fitting a power law through free feature continuum pivots at m and m. The silicate strength is defined as: . Assuming an extinction law and a dust geometry the silicate strength can be converted into visual extinction. Fig.4 shows the spatial variation of the silicate strength in Arp 299.
2.3 Detecting AGNs
We used two independent methods to detect AGN. The first method is the detection of high ionization emission lines such as, [NeV] at 14.3 and 24.3m (97.1eV) and [OIV] at 25.9m (54.9eV). The high ionization potential of these lines implies the presence of an AGN because stars cannot generally produce such amount of ionizing radiation (see Fig. 5 right). The second method, proposed by Nardini et al. Nardini , uses the m spectral region to separate out the starburst component in the form of PAH emission and the AGN component in the form of hot dust continuum, as can be seen from Fig. 5.

References
- (1) A. Alonso-Herrero et al.: ApJ, 650, 635 (2006)
- (2) A. Alonso-Herrero et al.: ApJ, submitted (2008)
- (3) E. Nardini et al.: MNRAS, 385, 130 (2008)
- (4) J. D. T. Smith et al.: PASP, 119, 1133 (2007)
- (5) H. W. W. Spoon et al.: ApJ, 654, L49 (2007)