11email: rsed@ast.cam.ac.uk 22institutetext: Department of Astronomy, University of Florida, 211 Bryant Space Science Center, P.O. Box 112055, Gainesville, FL, 32611-2055, USA
33institutetext: European Southern Observatory, Alonso de Cordova 3107, Casilla 19001, Vitacura, Santiago 19, Chile
Resolved debris disk emission around Tel: a young Solar System or ongoing planet formation?
Abstract
Aims. 60% of the A star members of the 12 Myr old Pictoris moving group (BPMG) show significant excess emission in the mid-infrared, several million years after the proto-planetary disk is thought to disperse. Theoretical models suggest this peak may coincide with the formation of Pluto-sized planetesimals in the disk, stirring smaller bodies into collisional destruction. Here we present resolved mid-infrared imaging of the disk of Tel (A0V in the BPMG) and consider its implications for the state of planet formation in this system.
Methods. Tel was observed at 11.7 and 18.3m using T-ReCS on Gemini South. The resulting images were compared to simple disk models to constrain the radial distribution of the emitting material.
Results. The emission observed at 18.3m is shown to be significantly extended beyond the PSF along a position angle . This is the first time dust emission has been resolved around Tel. Modelling indicates that the extension arises from an edge-on disk of radius 0.5 arcsec ( 24 AU). Combining the spatial constraints from the imaging with those from the spectral energy distribution shows that 50% of the 18m emission comes from an unresolved dust component at 4 AU.
Conclusions. The radial structure of the Tel debris disk is reminiscent of the Solar System, suggesting that this is a young Solar System analogue. For an age of 12Myr, both the radius and dust level of the extended cooler component are consistent with self-stirring models for a protoplanetary disk of 0.7 times minimum mass solar nebula. The origin of the hot dust component may arise in an asteroid belt undergoing collisional destruction, or in massive collisions in ongoing terrestrial planet formation.
Key Words.:
circumstellar matter – infrared:stars – planetary systems – stars: Tel1 Introduction
Debris disks around nearby stars are often discovered through the detection of emission beyond that predicted to come from the stellar photosphere in the infrared or sub-millimeter (see Wyatt 2008, for a recent review). The detected emission arises from the absorption and subsequent re-emission of starlight at longer wavelengths by dust particles in the disks. These dust grains are believed to be continuously reproduced by the collisional destruction and/or sublimation of larger bodies (planetesimals), as the lifetimes of such small grains due to removal by radiation pressure or Poynting-Robertson (P-R) drag are small compared to the age of the star (Backman & Paresce 1993). Studying these debris disks can give clues about how the circumstellar region has evolved during the star’s formation and subsequent lifetime, how any planetary system around the star may have formed and evolved, and the current status of the system (see e.g., Wyatt et al. 1999).
Tel (HD 181296) is an A0Vn member of the Pictoris moving group, with an age estimated to be 12 Myr (age estimated for moving group in Zuckerman et al. 2001). It has an M7/8V companion at an offset of 4″at a position angle of 160∘ to the star (Lowrance et al. 2000). Hipparcos listed parallax measurements put this system at a distance of 48pc, giving a projected offset of 192 AU for the companion. Backman & Paresce (1993) first identified this star as a debris disk candidate based on IRAS measurements which indicates that excess emission is present at 12, 25 and 60m. The excess measurement at 12m is particularly rare (Aumann & Probst 1991), as debris disks are more typically characterised by dust at several 10s of AU which is too cool to emit at 12m. Indeed the majority of A star sources with disk emission resolved at thermal wavelengths have disks extended on 100s of AU scales ( Pic, HR4796A, 49 Ceti, HD 141596 and HD 32297 Backman & Paresce 1993; Jayawardhana et al. 1998; Wahhaj et al. 2007; Fisher et al. 2000; Moerchen et al. 2007a). Nevertheless, examples of A stars with dust confirmed to lie within 10AU are known (e.g., Lep, Moerchen et al. 2007b), and there remains debate as to whether such hot emission can originate in the steady-state destruction of planetesimal belts (Wyatt et al. 2007b) or in collisions between growing protoplanets that are expected during terrestrial planet formation (Kenyon & Bromley 2002). Chen et al. (2006) presented IRS observations of Tel showing that the excess emission cannot be fit by a single temperature of dust as the spectrum is too flat. They interpret this as evidence for two temperatures of dust, but from the emission spectrum alone it is not possible to tell if this arose from dust in two separate radial locations around the star, or alternatively two different grain populations at the same radial location. The aim of this paper is to use resolved imaging of the disk to allow a differentiation between these alternatives. In addition these images will confirm that the excess emission is in fact centred on the primary star and not the binary, although due to the brightness of the 12m flux it is unlikely that the emission arises from dust around the M7/8 companion.
The age of this system and membership of the moving group make it very interesting in terms of evolutionary studies of debris disks. Recent work by Currie et al. (2007) has shown that excess emission at 24m around A stars increases from 5–10 Myr, peaks around 10–15 Myr and then declines with age. The cause of the peak is not yet known (see review in Wyatt 2008), but is suggested to be the delayed formation of Pluto-sized bodies further from the star, as these bodies are necessary to stir the disk so that collisions are destructive thus releasing large quantities of dust (Kenyon & Bromley 2004). The 12 Myr Pictoris moving group has 5 A star members, 3 of which are known to have debris disks that exhibit excess emission in the mid-infrared ( Pictoris, HD 172555 and Tel; Chen et al. 2006; Rebull et al. 2008), and the proximity of this group means it offers the chance to assess the origin and diversity of the peak.
Here we present 11.7 and 18.3m imaging of Tel taken with the T-ReCS instrument on Gemini South which shows a resolved debris disk at 18.3m. We confront these observations with models to determine the optimal disk parameters and discuss the implications of the inferred structure for the status of planet formation in this system, both by comparison with the self-stirred models of Kenyon & Bromley (2004) and with our understanding of the early Solar System.
2 Observations
The source was observed under proposal GS-2007A-Q-45 using T-ReCS on Gemini South with filter Qa ( = 18.3 m, = 1.51 m) and Si-5 ( = 11.66 m, = 2.13 m), which we refer to as Qa and Si-5 observations henceforth. The pixel scale of the T-ReCS imager is 009 with a total field of view of 29″ 22″. The observations were taken in parallel chop-nod mode with a chop throw of 10″and chop position angle of 55∘ (East of North) at Q, 100∘ at N. The Qa observations were taken over two consecutive nights (1st and 2nd July 2007), with the Si-5 observations taken on one night only (12th July 2007). Total integration time was 9120s (4560s on source) at Qa, and 912s (456s on source) at Si-5. Observations of standard stars HD 196171 (spectral type K0III) and HD 179886 (spectral type K3III), both listed in Cohen et al. (1999), were made to calibrate the photometry and also determine the PSF of the observations. The order of observations and integration times are shown in Table 1.
These data for Tel were taken in multiples of 304s-long integrations, each consisting of 7 complete nod cycles (ABBA). The data were reduced using custom routines described in Smith et al. (2008). Data reduction involved determination of a gain map using the mean values of each frame to determine pixel responsivity (masking off pixels on which emission from the source could fall, equivalent to a sky flat). In addition a dc-offset was determined by calculating the mean pixel values in columns and rows (excluding pixels on which source emission was detected) and this was subtracted from the final image to ensure a flat background. Pixels showing high or low gain, or those which showed great variation throughout the observation were masked off. In order to avoid errors in co-adding the data which could arise from incorrect alignment of the images, we used re-binned images in which each pixel was a fifth the size of the T-ReCS image pixels to determine an accurate centre of the stellar images, aligned and co-added these images and then re-binned to the original pixel size. The re-binning was performed using bilinear interpolation across the array. This technique was used both to determine a final image of Tel and standard star for each band. To ensure that background noise did not affect the re-binning process the same procedure was applied with an additional step of smoothing the images with a Gaussian kernel of FWHM equal to that of the standard star image before re-binning. It was found that the relative sizes of the final images of Tel and the standard stars and ellipticity of the images was unchanged by this additional step, indicating that the re-binning was not affected by background noise. This is as to be expected in data such as this where the detector super-samples the PSF.
| Date | Object | Filter | Integration | Calibrated |
| time (s) | flux, mJy | |||
| 01/07/2007 | HD 196171 | Qa | 152 | 6058 |
| 01/07/2007 | Tel | Qa | 1824 | 350 11 |
| 01/07/2007 | HD 196171 | Qa | 152 | 6058 |
| 01/07/2007 | Tel | Qa | 1824 | 347 11 |
| 01/07/2007 | HD 196171 | Qa | 152 | 6058 |
| 02/07/2007 | HD 196171 | Qa | 152 | 6058 |
| 02/07/2007 | Tel | Qa | 1824 | 345 10 |
| 02/07/2007 | HD 196171 | Qa | 152 | 6058 |
| 02/07/2007 | Tel | Qa | 1824 | 350 11 |
| 02/07/2007 | HD 196171 | Qa | 152 | 6058 |
| 02/07/2007 | Tel | Qa | 1824 | 331 10 |
| 02/07/2007 | HD 196171 | Qa | 152 | 6058 |
| 12/07/2007 | HD 179886 | Si-5 | 304 | 4417 |
| 12/07/2007 | Tel | Si-5 | 912 | 342 18 |
| 12/07/2007 | HD 179886 | Si-5 | 304 | 4417 |
3 Results
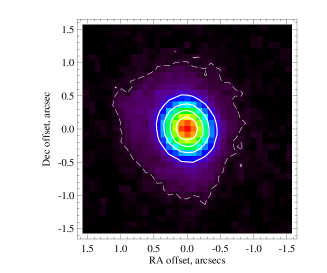
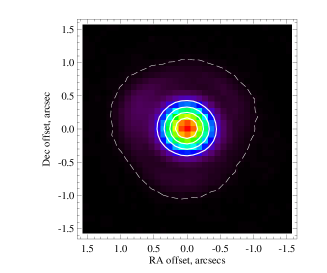
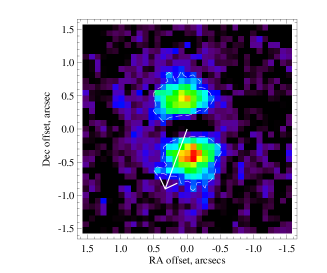
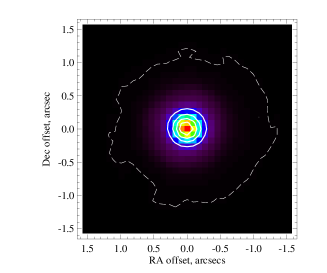
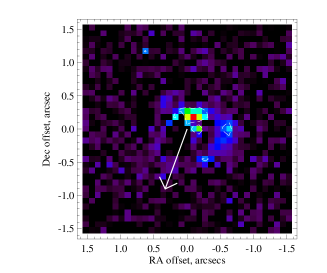
The final co-added images of Tel in both filters and the standard star for PSF reference are shown in Figure 1. The contours shown in the images are at 20%, 40%, 60% and 80% of the peak in each case (peak value in Qa 5.24mJy/pixel, in Si-5 9.89mJy/pixel). Also shown in the right-hand image for each row is the residual emission around Tel observed when subtracting the standard star image as a PSF reference scaled to the peak of the Tel image. The contours and residuals are discussed further below.
Qa
Tel
Standard
Residual
Si-5
Photometry was performed using 10 radius circular apertures centred on the stellar image. The centre of the image was determined through a 2-dimensional Gaussian fit. An average of the calibration factors determined from the standard star observations taken on the night was used for corresponding photometric calibration. Statistical noise was determined using an annulus with inner radius 1″and outer radius 2″centred on the source, resulting in uncertainties of 0.13 and 0.06 mJy/pixel at Qa and Si-5 respectively. The calibration factors were found to vary by 4% and 2% on the first and second nights of Qa band observations, respectively, which is consistent with the variation of 3% found between fluxes measured on individual 304s integrations on Tel (which is bright enough for an 60 sigma detection even in such a short integration). Although the calibration factors varied by just 5% for the two observations of standards in the Si-5 filter, analysis of the individual 304s integrations on Tel (each of which resulted in a 78 sigma detection) showed that photometric accuracy was in fact at a level of 13%. Our photometry yields total fluxes of 342 44 mJy in Si-5 (with S/N of 292) and 345 15 mJy in Qa (with S/N of 129), including both calibration and statistical noise, where the S/N given in brackets indicates the level of statistical noise. Standard stars were observed at a similar airmass to Tel. In addition, calibration levels were compared to airmass for the standard star observations and no correlation was found, therefore no correction for extinction was applied to calibration. Using a Kurucz model profile scaled to the 2MASS K band magnitude, the stellar flux in filters Si-5 and Qa is expected to be 282 mJy and 114 mJy, respectively. Thus the photometry gives an excess of mJy and mJy in Si-5 and Qa. The IRS spectrum of Chen et al. (2006) after subtraction of the above mentioned photospheric emission gives excess emission of 1505 and 2572 mJy, respectively, at these two wavelengths and so the photometry presented here is in agreement within the T-ReCS photometric errors with the IRS results at the 2 level. Thus it does not appear that the IRS spectrum includes any emission centred on the star outside the 1″aperture used here for photometry, as might happen in the larger IRS beam (extracted along a 37 slit).
Figure 1 shows the final co-added images of Tel and the standard star for a PSF reference. The top line of this figure shows the Qa total image of Tel and the standard. An elliptical shape can clearly be discerned, and a 2-dimensional Gaussian fit to the image has an ellipticity of 0.117 0.007 with the major axis at East of North; the same ellipticity was seen on the two separate nights of Qa observing. For comparison, the ellipticity of the final standard image is 0.084 0.005 with the major axis at 83. This slightly elliptical shape of the PSF is seen across the standard star integrations (see later this section) and does not coincide with the extension seen in the Tel images. As all Qa observations were performed with no on-sky rotation and chop-nod performed at 55∘, the direction of the extension is unlikely to be the result of chop smearing.

Also shown in Figure 1 is the residual emission of Tel following a subtraction of the PSF reference standard star image scaled to the peak of the Tel image, which subtracts a total of 252mJy from the image. Although this subtraction method is likely to remove some of the disk emission (some of which contributes to the peak surface brightness), it does highlight the location of the non-pointlike emission. Peaks are seen in the Qa residual image that are centred at 045 (21.6AU), 5.2∘ East of North, and 040 (19.2AU), 190.5∘ East of North. Symmetrical peaks in the residual emission either side of the star are exactly what would be expected for an edge-on ring (Telesco et al. 2000, although also note that we cannot rule out a less inclined ring without detailed modelling of the disk, see section 4.). Since the residual peaks are more representative of the extension seen than the 2-dimensional Gaussian fit discussed above, hereafter the extension is considered to be at a position angle of 8∘. Thus the extension is at 28∘ with respect to the direction of the binary (shown with an arrow), suggesting if this arises from an edge-on disk, then that disk is not in the same plane as the binary. The flux in the residual peaks totals 80 5 mJy (measured in 04 radius apertures; the error term includes background and calibration uncertainty added in quadrature), which as expected is below that of the excess emission 23115mJy measured in our photometry. An estimate of the level of disk emission which may have been removed from the residuals image by our method of PSF subtraction can be determined from consideration of how much the two peaks may have contributed to the central pixel. Using the PSF model scaled to the residual peaks this was calculated as 0.3mJy (as compared to the total peak before subtraction of 5.24mJy). This method suggests the extended emission represents a minimum of 6% of the peak emission, as if the extended emission is truly a disk lying across the star, this method will again underestimate the disk flux in the central pixel). A more detailed model of the extended emission seen in the Qa image is discussed in section 4.
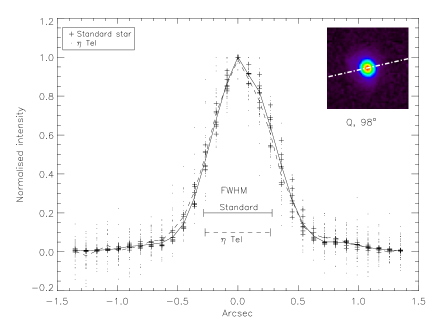
To assess the temporal variability of this FWHM and the significance of the extensions, as well as to search for a dependence on time or airmass, linecuts were performed at position angles of 8∘ and 98∘ for individual nod set images (22s) for the standard star and two nod set images (43s) for Tel. Two methods of fitting the cuts, by a Gaussian profile and a Moffat profile were tried. Both fits provided the same relative results, although the peak was normally fitted more accurately using the Gaussian profile. No dependence on airmass or time was found, and median FWHM values and standard errors were found to be: for the standard target 0531 0002 at 8∘, 0566 0004 at 98∘; and for Tel 0582 0010 at 8∘ and 0545 0007 at 98∘. The lower signal-to-noise on the Tel observations naturally leads to a larger degree of scatter in the intensity profiles. However it is clear that at Qa there is no difference in the FWHM of the Tel frames and standard star target frames at 98∘, but that at 8∘ the FWHM is larger for Tel than for any of the individual integrations of the standard stars. A further graphical demonstration of the significance of the extension is provided by Figure 2 which shows the cuts through each Qa integration (of 304s) from the standard star imaging (plus signs) and the Tel observations (dots). At the Tel sub-integrations are not only broader at the FWHM but also have broader wings to their profiles compared to the standard star images. Neither of these features is seen at 98∘.
The Si-5 image of Tel shown in Figure 1 includes only the first 2 of 3 integrations on the source. The final integration showed an unusual shape compared to the previous integrations: a greater extension in the North-South direction, and an unusual asymmetric shape, with an extension towards the East of the image not matched on the West side. This shape was seen in all but the first nod set. Neither the North-South extension nor the Easterly extension match the chop PA of 55∘. The eccentricities and orientations of the major axis for the 3 integrations are: 0.027 0.009 at 110∘; 0.082 0.009 at 167∘; and 0.163 0.012 at 80∘. Thus we consider that the shape seen in the final integration is not evidence for true extension, but is due to the variable seeing conditions on this night.
In the Si-5 residual image we see only low significance emission at the Northern edge of the original stellar image. The emission seen in this residual image (Figure 1 lower right image) is 6.6 0.9 mJy (this error includes only background error, not PSF uncertainty), however with subtraction of individual standard star images rather than the coadded standard star PSF reference image flux in this region can be as low as -7.8mJy, demonstrating the importance of consideration of the PSF variation when determining evidence of extended emission close to the star, and the true insignificance of this emission. Again the linecuts for individual nodsets, both for Tel and standard, were assessed. No dependence on airmass or time was found, and median values and standard errors of the Gaussian FWHM measurements excluding the final integration for Tel (see above) are: for the standard target 0383 0003 at 8∘, 0407 0006 at 98∘; and for Tel 0386 0003 at 8∘ and 0414 0013 at 98∘. Thus examination of the PSF uncertainty indicates that the residual emission is likely to be the result of PSF variation over the course of the observation.
4 Modelling the emission
In order to determine the constraints on the radial distribution of emission provided by the resolved Qa imaging, we considered models for disk structure of increasing complexity. For all models it is assumed that the images are comprised of unresolved stellar flux (of 114 mJy), plus an additional unresolved disk component (motivated by the hot component inferred by Chen et al. 2006) of flux , along with an additional resolved disk component of flux . The IRS photometry was used to constrain the total flux so that 257mJy. The resolved flux is assumed to arise from an axisymmetric disk of opening angle 5∘ (which is not constrained by the modelling) which lies at an inclination to our line-of-sight. Since the emission is consistent with an edge-on disk is assumed in the modelling, although the extent to which it is edge-on is constrained later (see section 4.2). Two types of resolved disk were assumed. Narrow rings are defined by , the radius of the mid-point of the disk, in AU; a finite ring width of was assumed, with a constant surface density. Extended rings were defined by a continuous distribution of surface density from some inner radius to an outer radius with surface density following a power-law , assuming grains with black body temperatures and emissivities.
The total models (disks and point sources) were convolved with the average PSF (shown in Figure 1) for comparison with the observed data. The compatibility of each model with the observed structure was tested by taking line cuts along the direction of extension (at a PA of 8∘). The line cuts were averaged over 3 pixels (027) in width centred on the peak of the emission, taken over a length of 50 pixels (i.e., 225 from the centre) to give a 1 dimensional profile for both the observation of Tel (with error bars) and for each model tested (e.g., Figure 3, right). For each model described below a range of parameters was tried and a goodness-of-fit test applied to find the best fitting parameters and confidence limits (errors from background statistical error). In addition to the from the line-cuts, that from a comparison of the model images and observation was also considered (e.g., Figure 3, left).
To test whether more complicated models are necessary to explain the images, a Bayesian Information Criterion (BIC) test was applied to the model fitting:
| (1) |
where is the number of data points and the number of free parameters, and is the minimum value found from each model (Schwarz 1978; see also Liddle 2004; Wahhaj et al. 2005). This test penalises models for having unnecessary parameters. A lower value of the BIC is preferred; a difference of 2 between BICs of different models indicates positive evidence against the higher BIC value, and a difference of 6 indicates strong evidence against the higher BIC value.
4.1 One parameter models
The simplest model is one with no resolved disk component. In this case we allowed to be a free parameter, but as expected from the images and comparison of radial profiles in Figure 2, the testing showed that no model provided a good fit to the profile with =786 and a reduced =16, where =1.0 is a perfect fit. The BIC of this model was 98 (from the 1 dimensional profiles).
Another possibility is to assume that there is no unresolved disk component, just a narrow ring defined by the free parameter . Values of tested in this case were in the range 8–60AU. This lower limit was chosen as smaller disks appear unresolved and thus provide the same goodness-of-fit as the unresolved emission only model described above. In this case the fit to the observed profile was poor, worse than assuming the emission to be completely unresolved with =2815 and a reduced =59. The BIC of this model was 160. This demonstrates that the images confirm the suggestion of Chen et al. that the material is at multiple radii.
4.2 Two parameter (preferred) model
The two free parameter model assumes that the disk emission is comprised of a narrow ring of radius and an unresolved component at a level (and so is essentially a combination of the two one parameter models considered above). The free parameter , which also controls the value of , was varied between 0 and 280 mJy (in 35 mJy steps), while was tested with values between 0 and 95AU (in 3 AU intervals). A much better fit was achieved with the two parameter model with an unreduced = 53 and a reduced =1.13 for AU and mJy (corresponding to mJy). The profile of this best fitting model is shown in Figure 3 in which the contributions of the different components are identified. The BIC for this model was 31 (from 1 dimensional profiles) indicating that this is strongly favoured over the 1 parameter models.
The minimisation showed that the parameters were constrained to the ranges: mJy and AU at the 1,2, and levels respectively (ranges from a marginalisation of the joint distribution of the two parameters). Using the line cuts perpendicular to the direction of maximum extension the inclination to our line of sight was constrained to be less than 20∘, since at the model FWHM (0574) exceeds the observed FWHM (0566 0004) by more than 1.
Given the importance of PSF variation in the residual structure seen in the N band images, and as we used the average PSF in the modelling outlined above, we performed the same modelling process using the different PSFs measured in the single standard star observations (i.e. not co-added). The sensitivity of our best fit parameters on the chosen PSF was minimal, with typical 1 confidence regions close to those given in section 4.2 (largest ranges were 8AU r 32AU and 203mJy 339mJy). Thus the variation in the observed PSF does not strongly change the best fitting model for the extended emission.

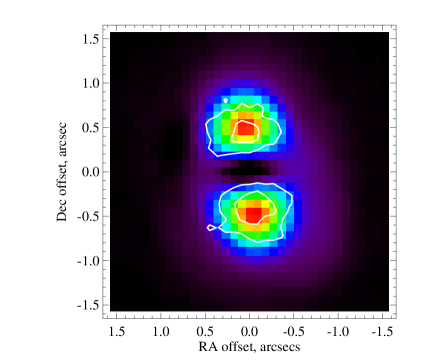
The final total model at Qa is shown after subtraction of the PSF scaled to the peak of the observed image of Tel in Figure 3 along with the profile of this best fitting model with an edge-on disk (inclination = 0). Subtracting the model image from the observation reveals that two are a close match within the statistical noise over the area of the image (900 pixels = 2727, reduced = 1.3).
4.3 More complicated models
As soon as the ring is assumed to be broad the number of free parameters increases to 3 or 4, depending on whether an unresolved component was included: i.e., , , , and possibly . We started by assessing whether the radial distribution could be explained by a single continuous distribution of dust, without an unresolved component. We tried model grids with AU spaced at 0.2AU intervals, AU in 1.5AU intervals and tested at intervals of 0.5 with . This resulted in a poor fit to the data (=198 over the 1 dimensional profile, reduced =4.2), and the BIC of 83 which suggests that the radial distribution is discontinuous.
It was possible to find a better fit to the observations than the two parameter model of section 4.2 when was also included as a free parameter; a reduced of 1.03 (from the 1d profile) was found for AU, AU, and 26 mJy. However, the BIC calculation results in a value of 55 suggesting that the additional parameters required for an extended dust distribution are not justified to fit the data.
4.4 Combining imaging and SED constraints

The emission spectrum of Tel is shown in Figure 4. Here the stellar photospheric emission has been modelled using a Kurucz atmosphere of 9506K that has been scaled to the 2MASS K band photometry (implying a stellar luminosity of 22L⊙ for 48pc). The photosphere of the M7.5 star companion is shown for reference and is modelled using 2700K NEXTGEN model atmosphere (Hauschildt et al. 1999). This companion is outside the aperture used to determine the TReCS photometry. In any case the emission from this M7.5 star at the wavelength range covered by both TReCS and the Spitzer IRS spectrum is below the background statistical noise level and thus it does not contribute to the photometry shown at 5m. Photospheric contributions have been subtracted from the fluxes shown at m which represent the excess emission from the disk. The results of our imaging require that the emitting dust be at two radii, in agreement with the conclusions of Chen et al. (2006). These separate components are shown by open symbols on Figure 4.
Modelling was performed to provide a two component fit to the SED in which each component (the unresolved excess and resolved disk) is pegged to its 18m flux, with the unresolved component dominating the IRS spectrum m and the resolved component dominating the longer wavelength fluxes. We assume a maximum grain size of 1000m, with a minimum grain size of 10.8m as this is the size at which grains are removed from the system by radiation pressure. Large grains (greater than mm-sized) are inefficient absorbers and emitters of radiation, and their addition to the grain population would not have a great affect on the SED. A size distribution of (see Dohnanyi 1969) was also assumed. We consider a distribution of grain sizes to be a realistic model for a dust population created in the different origin scenarios presented in section 5 (Chen et al. 2006 use a single grain size to fit the IRS spectrum). Grains were assumed to have a silicate core and organic refractory/icy mantle (as used in Li & Greenberg 1998; Augereau et al. 1999). Dielectric constants were calculated using Maxwell-Garnett effective medium theory and optical properties calculated using Mie theory, Rayleigh-Gans theory and Geometric Optics in the appropriate size regimes (Bohren & Huffman 1983). The unresolved component was then best fit by a silicate fraction of 30% by volume (with the remaining volume composed of organic refractory material) and porosity of 0.2, which fit the shape and level of the silicate feature at m, resulting in a dust population at 3.9AU of fractional luminosity . Although we do not consider this modelling to have uniquely constrained the grain composition, this is a physically based model from which it is possible to estimate the radial location of the dust. Since this location is smaller than the FWHM it is confirmed that this should appear unresolved in our images, which would be expected as long as the radius was AU.
| Band | Observed | Photospheric | Observed Excess | Expected from | Expected from |
| emission, mJy | emission, mJy | emission, mJy | unresolved | resolved | |
| component, mJy | component, mJy | ||||
| Si-5 | 342 44 | 282 | 60 44 | 140 | 6 |
| Qa | 345 15 | 114 | 231 15 | 185 | 62 |
The same dust grain size distribution was used to model the cold resolved component. The same dust composition with the dust located between 21 and 26AU as constrained by modelling the resolved Qa emission provides a good fit to the Spitzer IRS spectrum of the excess emission (Figure 4). The fractional luminosity of the resolved component is similar to the unresolved component at . The N band flux of the resolved component is just 6mJy, which is consistent with the non-detection of the resolved emission in the imaging which is dominated by the unresolved component (at 140mJy). The full SED fit was compared to the observed photometry and a goodness-of-fit computed. Data points from IRAS, MIPS, TReCS and the IRS spectrum were weighted according to their uncertainty. Data points at 7m were excluded from the fit due to high levels of uncertainty arising from the correct determination of the stellar contribution at this range. The resulting reduced of 1.14 indicates the model fits the observed emission well.
Thus the two component model provides a consistent picture of this disk (see Table 2 and Figure 4 for comparison between model and observed emission levels), and while we cannot accurately assess the range of temperatures (and radii) that are present in the two components, the poor fit of a continuous surface density distribution (section 4.3) suggests that there is a region of lower surface density between the two.
5 Discussion
In the following section we explore the possible origin of the two dust populations around Tel. We consider two possibilities: that Tel represents an analogue of the Solar System when it was at a similar age; and that the observed emission could arise from ongoing planet formation. We discuss the implications of these scenarios for any as yet undiscovered planets in the system, and place the Tel disks in a wider context by comparison to the other Pic moving group A star disks.
5.1 A young solar system analogue
The two component model for the Tel disk represents an intriguing analogue to the young solar system. Current theory suggests that the asteroid and Kuiper belts in the Solar System were originally much more massive than they are today and that much of the mass depletion occurred during a chaotic period known as the Late Heavy Bombardment several hundreds of Myr after the formation of the Solar System, possibly triggered by the migration of the giant planets (Gomes et al. 2005). According to the Nice model (Tsiganis et al. 2005), which reproduces fairly accurately the current configuration of the Solar Systems giant planets and the Kuiper Belt (Levison et al. 2007), the Kuiper belt was situated between 15.5–34AU, with the orbits of the outer planets confined to the 5-15AU region, whereas the asteroid belt was at its current location. Thus in terms of radial location it is tempting to interpret the Tel disk in terms of an analogous asteroid belt (the unresolved component at 3.9AU) and an analogous Kuiper belt (the resolved component at 24AU). It is worth noting that the luminosity of Tel is much higher than the Sun at , and thus the snow line (the location at which ices are expected to form) would be much further from the star. Using a simple 150K blackbody approximation the snow line would be expected at 17AU around Tel (compared to 3.5AU in the Solar System).
The current levels of excess emission arising from the two populations of debris in the Solar System are 2-3 orders of magnitude lower than that observed around Tel, since the fractional luminosity of asteroid belt dust is 10 (Dermott et al. 2002), and that of Kuiper belt dust is 10 (Stern & Colwell 1997). However, the luminosities would have been much larger at an age similar to Tel, since this would have been before the depletion of the asteroid and Kuiper belts. The original belts in the Nice model had masses of 1M⊕ and 35M⊕ respectively (total mass in full size range of bodies), and so would also have had correspondingly higher levels of dust emission. The fractional luminosity of the Kuiper belt was estimated to be around during the pre-LHB phase (Wyatt 2008; Booth et al. in prep.), which is comparable to that of the resolved component of the Tel disk.
5.2 Origin of the unresolved component
The fractional luminosity of the pre-LHB asteroid belt would also have been considerably higher, since of material at AU distributed in a collisional cascade size distribution from 2000km asteroids down to 0.8m dust blown out by radiation pressure would have resulted in a fractional luminosity of . However, collisional processing would ensure that such a high mass would not be long-lived, and Wyatt et al. (2007b) showed how there is a maximum fractional luminosity for planetesimal belts of a given age and radius. For a belt at 3.9AU around Tel that has been undergoing catastrophic disruption for 12Myr this maximum fractional luminosity is . Although the current fractional luminosity is 30-40 times larger than this maximum value, this does not rule out the possibility that the unresolved component arises from the steady state collisional destruction of an asteroid belt for two reasons. First, the model requires times larger to indicate a discrepancy given the various uncertainties in the model parameters including assumptions about the maximum planetesimal size, planetesimal strength and orbital eccentricities of around 0.05 used to determine (see also Löhne et al. 2008). Second, it is possible that collisions in the asteroid belt only became destructive after the protoplanetary disk dispersed (after which time eccentricities can increase due to reduced dampening), and so more recently than 12Myr thus increasing .
However, another possible interpretation of emission at a few AU is that it arises in the late stages of the formation of terrestrial planets (e.g., Rhee et al. 2007; Meyer et al. 2008). High levels of hot emission are expected in the planet formation models of Kenyon & Bromley (2004) once the planetesimal disks are stirred by the formation of Pluto-sized objects. As such objects form within yrs at 4AU in a quiescent disk with the same density as the minimum mass solar nebula (MMSN) (Kenyon & Bromley 2005), stirring of the disk by a newly formed Pluto does not seem likely to explain the hotter dust emission. However, evidence from the Solar System suggests massive collisions between terrestrial planet cores could occur quite frequently in the first 100 Myr (e.g. formation of the Moon, Canup 2004), and models indicate that the final stage of terrestrial planet formation is characterised by such collisions (e.g., Kokubo et al. 2006). Thus the hot emission around Tel could be evidence of stochastic collisions between large rocky cores.
The unresolved component does not represent a population of PR-dragged particles from the resolved ring. Consideration of the collisional and PR-drag timescales for particles from the resolved ring ( for a belt at 3.9AU; see Wyatt 2005, for equations) indicates that any grains susceptible to PR-drag released by collisions in the outer belt are likely to undergo further collisions before PR-drag can affect their orbits to move a significant dust population to the radius of the unresolved component. Furthermore, were PR-drag a dominant process in this disk system, we would expect a dust distribution with a constant surface density (Wyatt 2005), not the two separate populations observed in the Qa images.
It is not possible to distinguish between the asteroid belt and protoplanet collision possibilities at this stage, although detailed spectral modelling may be able to determine the dust composition and so give clues as to the nature of the parent body (e.g., Lisse et al. 2007). Resolving the disk could also aid in its interpretation, although the small spatial scale of this population would make this a challenge. To date only the asteroid belt analogue around Lep has been resolved at a similar offset from the host star (Moerchen et al. 2007b).
5.3 Origin of the resolved component
Although the suggested location and fractional luminosity of the resolved component around Tel compare well with the early Kuiper belt, this does not require the two systems to have undergone a similar evolution and to have similar planetary systems. An alternative scenario for the evolution of the Tel system is given by the self-stirred planet formation models of Kenyon & Bromley (2004) which may also explain the delay in the onset of m emission peak until 10-15Myr (Currie et al. 2007). In such models planet formation within an extended planetesimal belt results in a bright ring of emission at the radius where Pluto-sized objects have recently formed. The timescale for the formation of Plutos, yr, around Tel suggests that to have reached this stage at 24AU by 12Myr requires a disk surface density equivalent to MMSN.
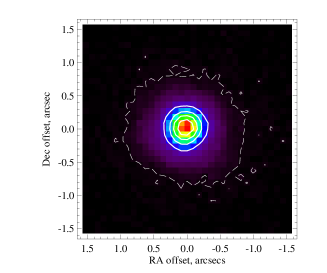
To assess the possibility that the bright ring in the Tel disk is caused by the recent formation of Pluto-sized objects at 24AU, we performed additional modelling of the 18m image based on the prescription for the evolution of dust surface density given in Wyatt (2008) that provides an empirical fit to the self-stirred models of Kenyon & Bromley (2005). This model considers an extended planetesimal belt of surface density scaled to the MMSN in which annuli at different radii have a suppressed dust content until the age at which Plutos form at which point their mass is eroded through steady state evolution (Wyatt et al. 2007b). The dust emission is calculated assuming a ratio of dust area to planetesimal mass appropriate for a collisional cascade size distribution, and further assuming black body temperatures and emission properties. To account for possible global deviations from this size distribution or from pure black body grains, an additional scaling factor was applied to the surface brightness of the whole disk. An unresolved disk component was included in addition to the unresolved star. The total flux from the self-stirred disc (as fixed by the disk surface density and scaling factor) and the unresolved component was fixed to 259 mJy from the IRS photometry (see section 4). Thus the model has 2 free parameters: , and , with fixed in response to the level of flux in the self-stirred disk.
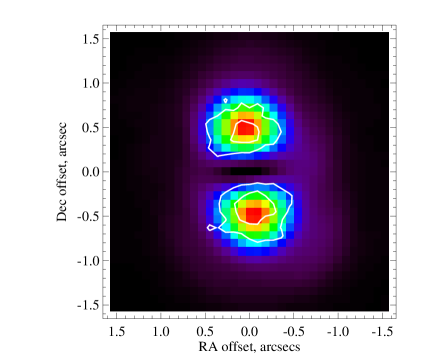
As expected from the simple calculation above, the best fitting model has a surface density of 0.7 times MMSN, leading to a ring at AU, with mJy (similar to the model of section 4.2) and . The low value of could arise because the grains are cooler than black body, since the ratio of is at 18m. The for this model is 58 with a reduced of =1.21, slightly higher than that of the 2 parameter model (=1.13) in Section 4.2. The reduced of the image (taken as described in Section 4.2) was 1.15, better than the two parameter model which had =1.3. The BIC for this model is 32, which is indicative of the almost equally good fit of the two models. The BIC values show there is no evidence against either the simple ring plus unresolved flux model (section 4.2) or the self-stirred model. The residuals for the best fitting self-stirred model are plotted in Figure 5. Multi-wavelength imaging may help break this degeneracy. The self-stirred model requires an extended disk with a brightness peak at the location of recent Pluto formation. If a larger disk location were observed in longer wavelength imaging this could be evidence in favour of the self-stirred interpretation, whereas in the solar system analogy we may expect to see the disk confined to a narrow radial range. Alternatively searching for planets in the system could further test these models.
In other words the structure of the disk is entirely consistent with a self-stirred extended planetesimal belt in which the inner region has been cleared through collisional erosion following the formation of Pluto-sized objects. One caveat is that an additional unresolved component still has to be invoked. To be consistent such a component could not originate in an asteroid belt (unless this had significantly different material properties to the outer regions), and further work is needed to assess the duration and radial location of any 18m emission expected from the final collisional phase of terrestrial planet formation.
5.4 Implications for the planetary system
Taking the solar system analogy to its extreme would suggest that the gap in the dust distribution seen around Tel at 5-20AU is caused by the existence of giant planets distributed in this region. Like the Solar System, the planetesimal belt at 3.9AU could represent a region where terrestrial planet formation was disrupted by the influence of a gas giant planet at 5-6AU, and the inner edge of the belt at 24AU could demark the outer edge of the planetary system.
The inner edge of the the hot dust could also be evidence of terrestrial planets at 3AU, as the hot dust at 1AU around HD 69830 (Beichman et al. 2005; Lisse et al. 2007) lies just outside 3 Neptune mass planets, the outermost of which is at 0.63 AU (Lovis et al. 2006) (although the location of the disk has not yet been confirmed through resolved imaging). Also, although no planets have been detected around zeta Lep, the restricted spatial extent of its asteroid belt (Moerchen et al. 2007b) is suggested to be possible evidence of perturbations of planetary bodies.
Implicit in the self-stirring interpretation is the formation of planets at least the size of Pluto in the inner regions. Such objects would presumably have grown through mutual collisions to larger sizes, but it is not required that they also evolved into gas giant planets, which would depend on whether they reached before the gas disk dissipated (e.g. Lissauer 1993).
A further possibility which is not discussed here is that this disk is a remnant of the protoplanetary disk, and that the dust is shepherded into a ring through the action of gas drag forces or instabilities (Takeuchi & Artymowicz 2001; Klahr & Lin 2005; Besla & Wu 2007). In this case it would not be necessary for any planets to be present. A massive gas disk around a star of this age would be highly unusual, as most gas disks are believed to dissipate in 10Myr (e.g. Hollenbach et al. 2005), although gas has been detected around 4 A stars ( Pic Brandeker et al. 2004; HD 141596 Jonkheid et al. 2006; 49 Ceti Dent et al. 2005; and HD 32297 Redfield 2007). To assess this possibility knowledge of the gas distribution is vitally important, yet gas has yet to be detected around Tel.
5.5 Comparison with A star disks in Pic moving group
Of the 5 A stars in the Pic moving group, 3 exhibit excess mid-IR emission from a debris disk ( Pic, Tel and HD 172555). The derived (or directly measured) structures of these 3 disks display significant diversity. Pic, an A6V star, has a well known highly extended disk with dust imaged from 10s of AU to an outer extent of 1500AU (Telesco et al. 2005; Larwood & Kalas 2001). Since dust at the outer edge is thought to be created in planetesimal belts much closer to the star (Augereau et al. 2001), it is probably most instructive to consider this disk as an extended planetesimal belt out to 100AU with a broad peak in surface density at around 70AU (Telesco et al. 2005). HD 172555 on the other hand has all of its emission much closer to the star. Its emission spectrum indicates the presence of silicate grains at 520K and a blackbody component at 200K implying a radial offset of 0.8–6AU (Chen et al. 2006; Rebull et al. 2008). The 24AU outer belt of the Tel debris lies intermediate between these two extremes. These disks thus represent the diversity that is seen amongst debris disks at the age when emission is seen to peak (Currie et al. 2007).
Within the context of the self-stirring model this diversity would be expected to arise primarily from different initial disk masses. While Tel is the product of a 0.7x MMSN disk, the protoplanetary disk of HD 172555 (and of the two A stars which are not detected) is presumably of lower density, and that of Pic is of higher density to allow Plutos to form out to 70AU by 12Myr. It is also worth noting that the beta Pic disk shows an asymmetry that may be the result of a catastrophic collision at 50AU, such as might be expected from the self-stirring models at the epoch of Pluto-formation. Such a diversity of protoplanetary disk masses is expected (e.g., Andrews & Williams 2005), but the small number of stars in this sample does not permit any definite conclusions to be drawn. In the young Solar System interpretation, the diversity in these disks could instead be due to the diversity in planetary system architecture across the three stars, which in addition to a dependence on initial disk mass (Wyatt et al. 2007a) could also have a significant stochastic component (e.g. Quintana & Lissauer 2006, find small changes in the location of planetary embryos has a great impact on the final system architecture). Furthermore the origin of the hot emission, and its diversity, remains a puzzle, and it is not clear whether the presence, or lack thereof, of asteroid belts and ongoing terrestrial planet formation should be a monotonic function of the initial disk mass (see e.g. Su et al. 2008, who find from a sample of middle-aged disks around A0–A3V stars that factors beyond variation in initial disk mass are needed to explain the variation in observed disk structure).
6 Conclusions
We have presented Si-5 and Qa band Gemini T-ReCS imaging of the 12Myr old A star Tel. The emission at 18.3m is shown to be significantly extended compared with a point source. This image represents the first resolution of dust emission around this star. These observations confirm the interpretation of the SED as a debris disk comprised of two populations: one component that is resolved at 24AU, the other that is unresolved with a temperature consistent with dust at 3.9AU.
Two interpretations are proposed for the origin of the architecture of these debris belts. (i) The system is a close analogue to the Solar System at a similar age, both in terms of the radial location of the debris and the level of emission; i.e., these belts represent analogous asteroid and Kuiper belts. ii) Alternatively this system is still undergoing planet formation, and the 24AU ring is the location where Pluto-sized objects recently formed; the 3.9AU ring could be the product of recent collisions between Mars-sized bodies in the final accumulation phases of terrestrial planets. This implies that this system evolved from a 0.7x MMSN protoplanetary disk.
These possibilities can be further tested by probing the radial structure of the disk through multiple wavelength imaging, and by searching for planets both through direct methods, or through looking for evidence for them in the disk structure. Thus Tel is a valuable source for testing planet formation theories, not least since it may be an example of a system where planet formation is ongoing.
Acknowledgements.
RS is grateful for the support of a Fellowship of the Royal Commission for the Exhibition of 1851. LJC is grateful for the support of an STFC studentship. MCW is grateful for the support of a Royal Society University Research Fellowship. MM acknowledges support from JPL funded by NASA through the Michelson Fellowship Program. JPL is managed for NASA by the California Institute of Technology. The authors would like to thank Christine Chen for providing the Spitzer IRS spectrum of Tel. Based on observations obtained at the Gemini Observatory, which is operated by the Association of Universities for Research in Astronomy, Inc., under a cooperative agreement with the NSF on behalf of the Gemini partnership: the National Science Foundation (United States), the Science and Technology Facilities Council (United Kingdom), the National Research Council (Canada), CONICYT (Chile), the Australian Research Council (Australia), Minist rio da Ci ncia e Tecnologia (Brazil) and SECYT (Argentina).References
- Andrews & Williams (2005) Andrews, S. M. & Williams, J. P. 2005, ApJ, 631, 1134
- Augereau et al. (1999) Augereau, J. C., Lagrange, A. M., Mouillet, D., Papaloizou, J. C. B., & Grorod, P. A. 1999, A&A, 348, 557
- Augereau et al. (2001) Augereau, J. C., Nelson, R. P., Lagrange, A. M., Papaloizou, J. C. B., & Mouillet, D. 2001, A&A, 370, 447
- Aumann & Probst (1991) Aumann, H. H. & Probst, R. G. 1991, ApJ, 368, 264
- Backman & Paresce (1993) Backman, D. E. & Paresce, F. 1993, in Protostars and Planets III, ed. E. H. Levy & J. I. Lunine ((Tucson: University of Arizona Press)), 1253–1304
- Beichman et al. (2005) Beichman, C. A., Bryden, G., Gautier, T. N., et al. 2005, ApJ, 626, 1061
- Besla & Wu (2007) Besla, G. & Wu, Y. 2007, ApJ, 655, 528
- Bohren & Huffman (1983) Bohren, C. F. & Huffman, D. R. 1983, Absorption and scattering of light by small particles ((New York: Wiley, 1983))
- Brandeker et al. (2004) Brandeker, A., Liseau, R., Olofsson, G., & Fridlund, M. 2004, A&A, 413, 681
- Canup (2004) Canup, R. M. 2004, ARA&A, 42, 441
- Chen et al. (2006) Chen, C. H., Sargent, B. A., Bohac, C., et al. 2006, ApJS, 166, 351
- Cohen et al. (1999) Cohen, M., Walker, R. G., Carter, B., et al. 1999, AJ, 117, 1864
- Currie et al. (2007) Currie, T., Kenyon, S., Balog, Z., et al. 2007, ArXiv e-prints: 0709.2510
- Dent et al. (2005) Dent, W. R. F., Greaves, J. S., & Coulson, I. M. 2005, MNRAS, 359, 663
- Dermott et al. (2002) Dermott, S. F., Durda, D. D., Grogan, K., & Kehoe, T. J. J. 2002, Asteroids III, 423
- Dohnanyi (1969) Dohnanyi, J. 1969, J. Geophys. Res., 74, 2531
- Fisher et al. (2000) Fisher, R. S., Telesco, C. M., Piña, R. K., Knacke, R. F., & Wyatt, M. C. 2000, ApJ, 532, L141
- Gomes et al. (2005) Gomes, R., Levison, H. F., Tsiganis, K., & Morbidelli, A. 2005, Nature, 435, 466
- Hauschildt et al. (1999) Hauschildt, P. H., Allard, F., & Baron, E. 1999, ApJ, 512, 377
- Hollenbach et al. (2005) Hollenbach, D., Gorti, U., Meyer, M., et al. 2005, ApJ, 631, 1180
- Jayawardhana et al. (1998) Jayawardhana, R., Fisher, S., Hartmann, L., et al. 1998, ApJ, 503, L79+
- Jonkheid et al. (2006) Jonkheid, B., Kamp, I., Augereau, J.-C., & van Dishoeck, E. F. 2006, A&A, 453, 163
- Kenyon & Bromley (2002) Kenyon, S. J. & Bromley, B. C. 2002, ApJ, 577, L35
- Kenyon & Bromley (2004) Kenyon, S. J. & Bromley, B. C. 2004, AJ, 127, 513
- Kenyon & Bromley (2005) Kenyon, S. J. & Bromley, B. C. 2005, AJ, 130, 269
- Klahr & Lin (2005) Klahr, H. & Lin, D. N. C. 2005, ApJ, 632, 1113
- Kokubo et al. (2006) Kokubo, E., Kominami, J., & Ida, S. 2006, ApJ, 642, 1131
- Larwood & Kalas (2001) Larwood, J. D. & Kalas, P. G. 2001, MNRAS, 323, 402
- Levison et al. (2007) Levison, H. F., Morbidelli, A., Van Laerhoven, C., Gomes, R., & Tsiganis, K. 2007, ArXiv e-prints, 712
- Li & Greenberg (1998) Li, A. & Greenberg, J. M. 1998, A&A, 331, 291
- Liddle (2004) Liddle, A. R. 2004, MNRAS, 351, L49
- Lissauer (1993) Lissauer, J. J. 1993, ARA&A, 31, 129
- Lisse et al. (2007) Lisse, C. M., Beichman, C. A., Bryden, G., & Wyatt, M. C. 2007, ApJ, 658, 584
- Löhne et al. (2008) Löhne, T., Krivov, A. V., & Rodmann, J. 2008, ApJ, 673, 1123
- Lovis et al. (2006) Lovis, C., Mayor, M., Pepe, F., et al. 2006, Nature, 441, 305
- Lowrance et al. (2000) Lowrance, P. J., Schneider, G., Kirkpatrick, J. D., et al. 2000, ApJ, 541, 390
- Meyer et al. (2008) Meyer, M. R., Carpenter, J. M., Mamajek, E. E., et al. 2008, ApJ, 673, L181
- Moerchen et al. (2007a) Moerchen, M. M., Telesco, C. M., De Buizer, J. M., Packham, C., & Radomski, J. T. 2007a, ApJ, 666, L109
- Moerchen et al. (2007b) Moerchen, M. M., Telesco, C. M., Packham, C., & Kehoe, T. J. J. 2007b, ApJ, 655, L109
- Quintana & Lissauer (2006) Quintana, E. V. & Lissauer, J. J. 2006, Icarus, 185, 1
- Rebull et al. (2008) Rebull, L. M., Stapelfeldt, K. R., Werner, M. W., et al. 2008, ArXiv e-prints, 803
- Redfield (2007) Redfield, S. 2007, ApJ, 656, L97
- Rhee et al. (2007) Rhee, J. H., Song, I., Zuckerman, B., & McElwain, M. 2007, ApJ, 660, 1556
- Schwarz (1978) Schwarz, G. 1978, Annals of statistics, 5, 461
- Smith et al. (2008) Smith, R., Wyatt, M. C., & Dent, W. R. F. 2008, A&A, 485, 897
- Stern & Colwell (1997) Stern, S. A. & Colwell, J. E. 1997, AJ, 114, 841
- Su et al. (2008) Su, K. Y. L., Rieke, G. H., Stapelfeldt, K. R., et al. 2008, ApJ, 679, L125
- Takeuchi & Artymowicz (2001) Takeuchi, T. & Artymowicz, P. 2001, ApJ, 557, 990
- Telesco et al. (2000) Telesco, C. M., Fisher, R. S., Piña, R. K., et al. 2000, ApJ, 530, 329
- Telesco et al. (2005) Telesco, C. M., Fisher, R. S., Wyatt, M. C., et al. 2005, Nature, 433, 133
- Tsiganis et al. (2005) Tsiganis, K., Gomes, R., Morbidelli, A., & Levison, H. F. 2005, Nature, 435, 459
- Wahhaj et al. (2005) Wahhaj, Z., Koerner, D. W., Backman, D. E., et al. 2005, ApJ, 618, 385
- Wahhaj et al. (2007) Wahhaj, Z., Koerner, D. W., & Sargent, A. I. 2007, ApJ, 661, 368
- Wyatt (2005) Wyatt, M. C. 2005, A&A, 433, 1007
- Wyatt (2008) Wyatt, M. C. 2008, ARA&A, 46, 339
- Wyatt et al. (2007a) Wyatt, M. C., Clarke, C. J., & Greaves, J. S. 2007a, MNRAS, 380, 1737
- Wyatt et al. (1999) Wyatt, M. C., Dermott, S. F., Telesco, C. M., et al. 1999, ApJ, 527, 918
- Wyatt et al. (2007b) Wyatt, M. C., Smith, R., Greaves, J. S., et al. 2007b, ApJ, 658, 569
- Zuckerman et al. (2001) Zuckerman, B., Song, I., Bessell, M. S., & Webb, R. A. 2001, ApJ, 562, L87