The fainter the better: cataclysmic variable stars from the Sloan Digital Sky Survey
Abstract
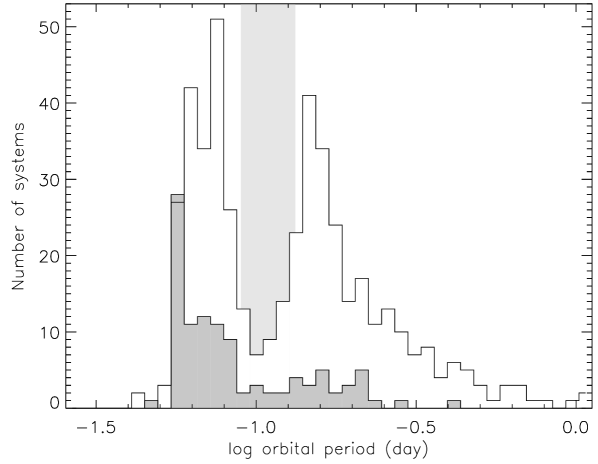
The Sloan Digital Sky Survey has identified a total of 212 cataclysmic variables, most of which are fainter than 18th magnitude. This is the deepest and most populous homogeneous sample of cataclysmic variables to date, and we are undertaking a project to characterise this population. We have found that the SDSS sample is dominated by a great “silent majority” of old and faint CVs. We detect, for the first time, a population spike at the minimum period of 80 min which has been predicted by theoretical studies for over a decade.
1 Introduction
Cataclysmic variables (CVs) are interacting binary stars containing a white dwarf accreting material from a low-mass main sequence star via an accretion disc or stream. Theoretical studies have consistently predicted that the population of CVs should be dominated by short-period systems, with many piling up up at a minimum period of 60–70 minutes (Kolb 1993; Politano 1996). Unfortunately, the known population of CVs, visciously biased by observational selection effects, bears no resemblance to theoretical predictions (Ritter & Kolb 2003). We are therefore undertaking a project to characterise the population of CVs discovered by the Sloan Digital Sky Survey (SDSS) (Szkody et al., 2002-6). This sample was identified spectroscopically and extends to faint magnitudes, so is much less biased than all previous samples.
We have identified the first CVs known to have a secondary star of brown dwarf mass (Southworth et al., 2006; Littlefair et al., 2006a, 2008), and for the first time are finding evidence for the long-predicted pile-up at the minimum period (Gänsicke et al., 2008). The orbital period distribution of the SDSS CVs is compared to the distribution for the previously known CVs in Fig. 1. Results for individual systems, based on observations with the VLT, NTT, WHT, INT and NOT, can be found in Gänsicke et al. (2006, 2008), Southworth et al. (2006, 2007ab, 2008ab), Dillon et al. (2008) and Littlefair et al. (2006ab, 2007, 2008).
Our work on the SDSS population of CVs is intended to shed light on how these weird objects evolve. For contrast, we are also running a program to measure the orbital periods of a sample of pre-CVs which has been spectroscopically identified by the SDSS (Rebassa-Mansergas et al. 2007, 2008; Schreiber et al. 2008; see also Gänsicke & Schreiber 2003). Below we pick out two recent highlights of our characterisation of the SDSS CVs.
2 SDSS J220553.98+115553.7: the pulsator which stopped
SDSS J2205 has twice been observed to vary in brightness (Woudt & Warner 2004; Szkody et al., 2007), with periods of 575 s, 475 s and 330 s and amplitudes of 10 mmag, which is typical of ZZ Ceti-type nonradial pulsations. Over two nights in 2008 August we obtained a light curve with the NTT. We were unable to detect these pulsations to a limit of 5 mmag, but instead found a previously unseen photometric period of 44.8 min. Our VLT spectroscopy yielded an orbital period of min (Southworth et al., 2008a). The vanishing pulsation periods cannot be attributed to destructive interference or changes in accretion rate, but may be explicable by changes in the white dwarf temperature or the surface visibility of the pulsation modes.
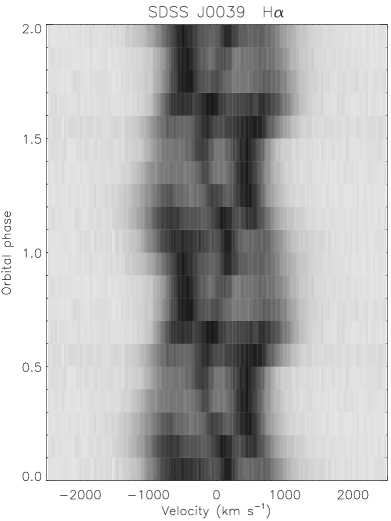
3 Triple-peaked Halpha emission from SDSS J003941.06005427.5
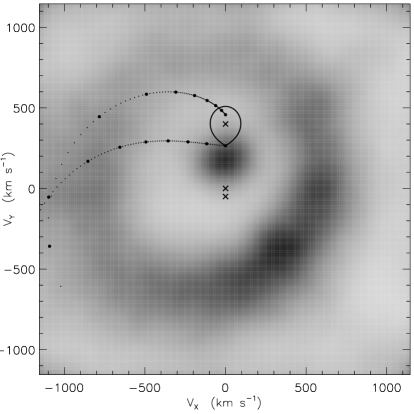
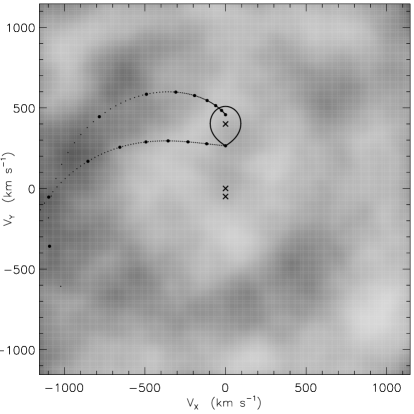
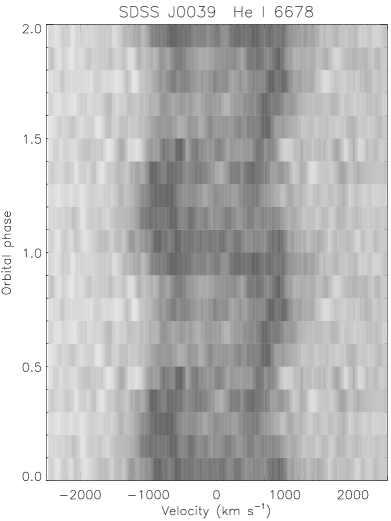
We obtained 29 spectra of SDSS J0039 over two nights in 2007 August using VLT/FORS2, finding an orbital period of min. The spectra of this system show a remarkable and unique triple emission peak at H (Southworth et al., 2008c). We have used the technique of Doppler tomography (Marsh & Horne 1988) to generate velocity maps of the emission. These show that the inner peak moves in velocity with an amplitude of 180 km s-1, so cannot easily be attributed to either the white dwarf, secondary star, or accretion disc. Its existence remains a mystery. The H Doppler maps also show that the accretion disc is very elliptical, which is not expected for a system in a state of very low mass transfer. Finally, there is also strong emission from the accretion disc in the [,] quadrant, which has been seen in some ultra-compact binaries but is very odd for standard hydrogen-rich CVs. These aspects of SDSS J0039 defy explanation in the current picture of the properties of CVs, and demand further follow-up observations.
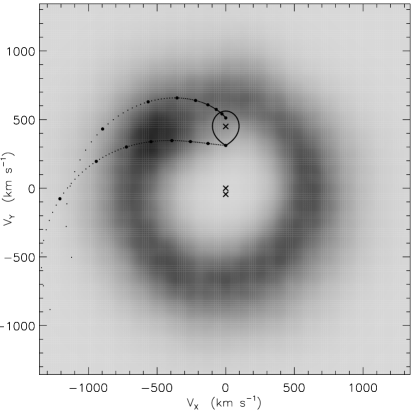
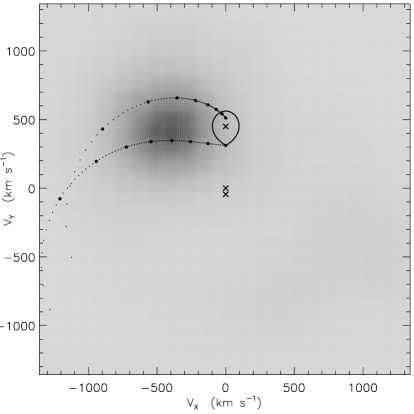
Doppler maps of the H and He I 6678 Å emission lines from SDSS J0039 are shown in Figs. 5 and 5. For comparison, we show Doppler maps from SDSS J2205 in Figs. 7 and 7, which have a behaviour which is much more like that expected from short-period CVs: a circular accretion disc in H emission and a bright spot visible in He I 6678 Å light where the mass transfer stream from the secondary star collides with the accretion disc. Overlaid on each Doppler map is a solid line indicating the Roche lobe of the secondary star in velocity space, crosses indicating the velocities of the centres of mass of the two stars and of the system, and dotted lines showing the velocity of the mass transfer stream as it follows a ballistic trajectory from the inner Lagrangian point.
References
Dillon M, Gänsicke B T, Aungwerojwit A, Rodríguez-Gil P, Marsh T R, Barros S C C, Szkody P, Brady S, Krajci T and Oksanen A 2008 MNRAS 386 1568–1576
Gänsicke B T et al. 2006 MNRAS 365 969–976
Gänsicke B T et al. 2008 MNRAS in preparation
Kolb U 1993 A&A 271 149–166
Littlefair S, Dhillon V S, Marsh T R, Gänsicke B T, Southworth J and Watson C A 2006a Science 314 1578–1580
Littlefair S, Dhillon V S, Marsh T R and Gänsicke B T 2006b MNRAS 371 1435–1440
Littlefair S, Dhillon V S, Marsh T R, Gänsicke B T, Baraffe I and Watson C A 2007 MNRAS 381 827–834
Littlefair S, Dhillon V S, Marsh T R, Gänsicke B T, Southworth J, Baraffe I, Watson C A and Copperwheat C 2008 MNRAS 388 1582–1594
Marsh T R and Horne K D 1988 MNRAS 235 269–286
Politano M, 1996 ApJ 465 338–358
Rebassa-Mansergas A, Gänsicke B T, Rodríguez-Gil P, Schreiber M R and Koester D 2007 MNRAS 382 1377–1393
Rebassa-Mansergas A et al. 2008, Preprint arXiv:0808.2148
Ritter H and Kolb U 2003 A&A 404 301–303
Schreiber M R and Gänsicke B T 2003 A&A 406 305–321
Schreiber M R, Gänsicke B T, Southworth J, Schwope A D and Koester D 2008 A&A 484 441–450
Southworth J, Gänsicke B T, Marsh T R, de Martino D, Hakala P, Littlefair S and Rodríguez-Gil P 2006 MNRAS 373 687–699
Southworth J, Gänsicke B T, Marsh T R, de Martino D and Aungwerojwit A 2007a MNRAS 378 635–640
Southworth J, Marsh T R, Gänsicke B T, Aungwerojwit A, Hakala P, de Martino D and Lehto H 2007b MNRAS 382 1145–1157
Southworth J, Townsley D M and Gänsicke B T 2008a MNRAS 388 709–715
Southworth J, Gänsicke B T, Marsh T R, Torres M A P, Steeghs D, Hakala P, Copperwheat C, Aungwerojwit A and Mukadam A 2008b Preprint arXiv:0809.1753
Southworth J, Marsh T R and Gänsicke B T 2008c in preparation
Szkody P, et al. 2002 AJ 123 430–442
Szkody P, et al. 2003 AJ 126 1499–1514
Szkody P, et al. 2004 AJ 128 1882–1893
Szkody P, et al. 2005 AJ 129 2386–2399
Szkody P, et al. 2006 AJ 131 973–983
Szkody P, et al. 2007 ApJ 658 1188–1195
Woudt P, Warner B 2002 Ap&SS 282 433–438