Sakurai’s Object: characterising the near-infrared CO ejecta between 2003 and 2007
Abstract
We present observations of Sakurai’s Object obtained at m between 2003 and 2007. By fitting a radiative transfer model to an echelle spectrum of CO fundamental absorption features around m, we determine the excitation conditions in the line-forming region. We find , consistent with CO originating in ejecta processed by the very late thermal pulse, rather than in the pre-existing planetary nebula. We demonstrate the existence of M⊙ of CO ejecta outside the dust, forming a high-velocity wind of km s-1. We find evidence for significant weakening of the CO band and cooling of the dust around the central star between 2003 and 2005. The gas and dust temperatures are implausibly high for stellar radiation to be the sole contributor.
keywords:
stars: individual: V4334 Sgr – stars: individual: Sakurai’s Object – stars: AGB and post-AGB – circumstellar matter – abundances – winds, outflows – infrared: stars.1 Introduction
Sakurai’s Object is a highly evolved post-AGB star that had begun to venture down the white dwarf cooling track when, in 1995, it underwent sudden rebrightening (Nakano, 1996) due to a final helium shell flash, or very late thermal pulse (VLTP) (Duerbeck et al., 1997). Since then, Sakurai’s Object has undergone observable changes on timescales of weeks to months, providing an instance in which this very brief stage of evolution experienced by of intermediate-mass stars (Iben, Tutukov & Yungelson, 1996) could be tracked over a period of only a few years. Several phases of dust production followed the outburst, with a deep optical minimum beginning in early 1999, such that any changes in the central star have since been inferred from radio and infrared observations (Tyne et al., 2000; Hajduk et al., 2005; van Hoof et al., 2007). Subsequent observations and modelling have revealed much about the dust shell formation and the outer regions of the ejecta [e.g. Tyne et al. (2002); Kimeswenger & Koller (2002)].
Using observations at 2.3 m from 1998, Pavlenko et al. (2004) modelled overtone CO band absorption in the stellar atmosphere to determine a 12C/13C ratio of , consistent with VLTP nucleosynthesis. In order to follow the development of the ejecta, annual monitoring of the target in the near-infrared has been undertaken. The discovery of fundamental band (4.7 m) lines of CO in the wind was reported by Eyres et al. (2004), based on low resolution spectroscopy obtained in 2002 and 2003. Here we present the analysis of observations of the CO fundamental lines in data obtained between 2003 and 2007, mostly at higher resolution.
2 Observations
All data presented here were obtained at the United Kingdom Infrared Telescope on Mauna Kea, Hawaii, using the facility spectrographs CGS4 and UIST. A summary of the observations is given in Table 1. Low resolution spectra were predominantly obtained with UIST, utilising the and slits, but in one instance (2005 August 3) CGS4 and its slit were used. For all observations the telescope was nodded in the standard ABBA pattern. Standard stars were observed just prior to or after Sakurai’s Object and at airmasses close to those of the target. The spectra of Sakurai’s Object were ratioed by those of the appropriate calibration stars (Table 1). Flux calibration was performed utilising photometry of the standard stars and colour corrections based on Tokunaga (2000). Wavelength calibration was obtained from an arc lamp or from telluric absorption lines in the spectrum of the calibration star, and was accurate to better than 0.0001 m for the UIST and low resolution CGS4 spectra.
In the case of the CGS4 echelle observations on 2004 June 10, three echelle settings were used with a slit width of to cover the wavelength range 4.68-4.77 m at a resolving power of 20000 (15 km s-1). Following data reduction, the three spectra were adjoined after applying small scaling factors to two of the spectra in order to match the continuum levels. Wavelength calibration for these spectra was derived from telluric CO lines and is accurate to 3 km s-1.
| Date | Waveband | Calibration Star | |||
|---|---|---|---|---|---|
| (s) | (m) | Name | Spectral Type | ||
| 2003-09-08 | 720 | 1.40-2.51 | 500 | HIP 86814 | F6V |
| 2003-09-08 | 480 | 2.91-3.64 | 1400 | BS 6378 | A2IV-V |
| 2003-09-08 | 240 | 3.62-4.23 | 1400 | BS 6378 | A2IV-V |
| 2003-09-08 | 960 | 4.38-5.31 | 1200 | BS 6378 | A2IV-V |
| 2004-06-10 | 1200 | 1.40-2.51 | 2000 | HIP 86814 | F6V |
| 2004-06-10 | 840 | 2.23-2.99 | 2000 | HIP 86814 | F6V |
| 2004-06-10 | 1440 | 2.91-3.64 | 2000 | BS 6378 | A2IV-V |
| 2004-06-10 | 720 | 3.62-4.23 | 2000 | BS 6378 | A2IV-V |
| 2004-06-10 | 1120 | 4.38-5.31 | 2000 | BS 6496 | F5V |
| 2004-06-10∗ | 600 | 4.678-4.692 | 20000 | BS 6378 | A2IV-V |
| 2004-06-10∗ | 600 | 4.713-4.727 | 20000 | BS 6378 | A2IV-V |
| 2004-06-10∗ | 510 | 4.758-4.762 | 20000 | BS 6378 | A2IV-V |
| 2005-08-03∗ | 560 | 4.48-5.12 | 2000 | BS 6595 | F5V |
| 2007-06-02 | 1080 | 3.62-4.23 | 2000 | BS 6595 | F5V |
| 2007-06-02 | 2400 | 4.38-5.31 | 2000 | BS 6595 | F5V |
3 Results
Figure 1(a) shows spectra of Sakurai’s Object in the m region from 2003 to 2007. The continuum can be seen to fade from one year to the next, with a substantial decrease in flux density between the 2004 and 2005 observations. To aid comparison of the continuum shapes, Figure 1(b) shows the 2005 and 2007 spectra scaled up by a factor of 14. Vertical offsets have also been applied to the 2004, 2005 and 2007 spectra for display purposes. A difference in gradient of the continua can be seen, particularly in the M-band, indicating a blackbody peak at increasing wavelength in consecutive years, strongly suggesting cooling of the dust. The only features superimposed upon the continuum are the fundamental absorption lines of CO around m. These can be seen in Figure 1(c); an enlargement of the 12CO P-branch and 13CO R-branch region. The 2004, 2005 and 2007 low resolution spectra have been convolved with a Gaussian profile of full width at half maximum (FWHM) equal to the resolution of the 2003 spectrum. Comparing the spectra, one can see a significant weakening of the CO band from 2003 to 2005. Although individual lines cannot clearly be seen in the 2005 spectrum, the apparent emission bump at m, the wavelength of the CO band centre, is a strong indication that weak P- and R-branch absorption lines are still present. The low signal-to-noise ratio of the 2007 spectrum precludes a meaningful estimate of the CO band strength.
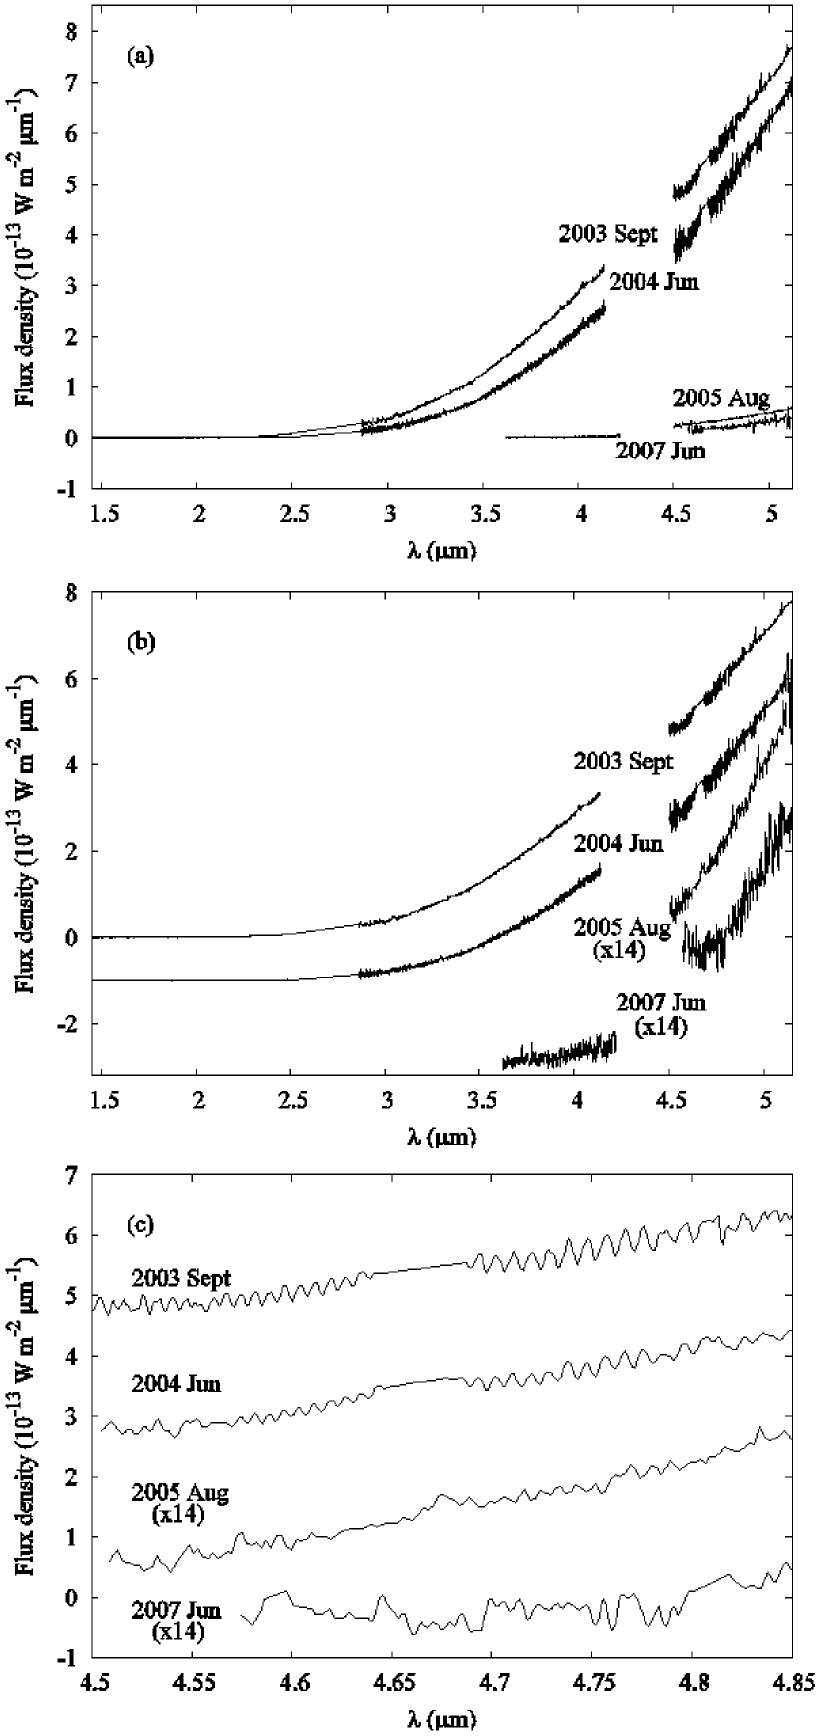
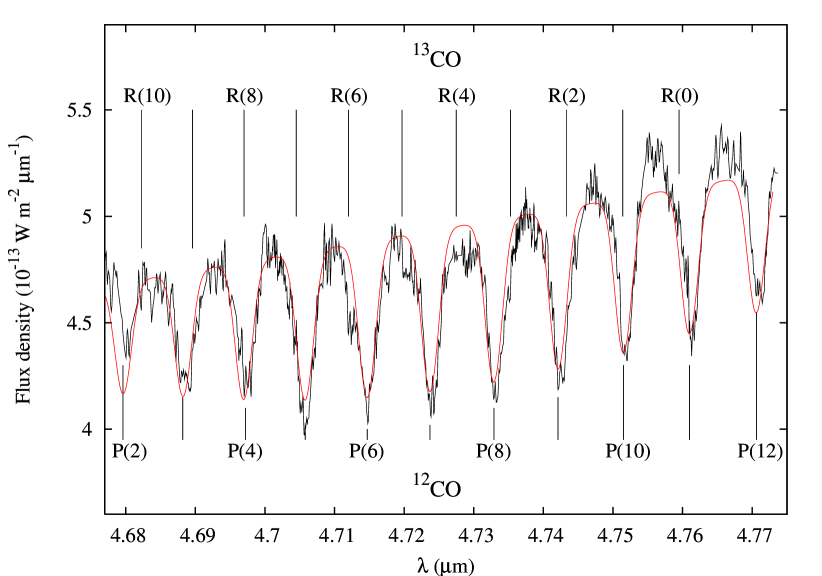
Figure 2 is the echelle spectrum from 2004 June, showing and in absorption around m. The absorption features have non-Gaussian profiles and show remarkably large linewidths. We measure a full width at zero intensity (FWZI) of km s-1 and FWHM of km s-1. By measuring the blueshift of absorption features in the echelle spectrum we can improve upon the km s-1 absorption maximum found by Eyres et al. (2004) using observations made at lower resolution. After correcting for the heliocentric radial velocity of +115 km s-1 (Duerbeck & Benetti, 1996), we find the velocity of the absorption maximum to be km s-1 relative to the star.
4 Modelling the CO
In order to ascertain whether the CO detected outside the dust in 2004 originates in ejecta from the central star observed by Pavlenko et al. (2004), or is associated with the old planetary nebula (PN) or interstellar medium, we estimate the isotopic ratio by applying a simple radiative transfer model to the m echelle spectrum, shown in Figure 2. Because the absorption features are extremely broad, the 13CO lines are blended with the stronger 12CO lines. Their presence has a tangible effect on the spectrum. There is an apparent deepening of the 12CO absorption features where 13CO lines are coincident [e.g. 12CO P(5) and 13CO R(7)], while the perceived continuum level is depressed in regions where 13CO lines occur in between 12CO lines [e.g. around 13CO R(4)]. To illustrate this point, the smooth red line in Figure 2 depicts a model spectrum for the case of absorption by 12CO alone, superimposed upon the echelle spectrum.
Primarily, we model the CO assuming a spherical geometry. For comparison, we consider an isothermal, plane parallel slab of absorbing CO as a secondary model. The results presented here are for the spherical model, favoured because it considers emission as well as absorption integrated over all lines of sight from Sakurai’s Object, rather than a single pencil beam of light.
4.1 Spherically symmetric shell model
The CO absorption region is modelled as an expanding, spherically symmetric shell, centred on the star. Assuming dust obscuration prevents the gas from seeing the central star, we take the radiation source to be the intervening dust. The validity of this assumption is discussed in Section 5.2. By fitting a blackbody function to the m continuum, we find dust temperatures of K in 2003, and K in 2004, consistent with the value of K estimated by Eyres et al. (2004). The radiative transfer model is insensitive to temperature because of the limited wavelength coverage of the echelle spectrum. We therefore fix the temperature of the dust at K. The relative strengths of the low and high 12CO lines place constraints on the gas temperature of K. We fix this parameter in the model accordingly.
The strength of the absorption component is determined by solving the radiative transfer equation along lines of sight within the shell. We employ the CO fundamental linelist taken from Goorvitch (1994), including vibrational levels up to . All identified lines correspond to lines, indicating no significant population of higher vibrational levels. The average measured FWHM of the CO lines is 180 km s-1. We use this value to constrain velocity broadening in the model.
The model is optimised for column density and isotopic ratio, and is fitted to the data using a minimum test. The output value corresponding to the lowest was established by use of the downhill simplex method of Press et al. (1992). Uncertainties in the output were estimated from the range of values produced by several iterations of the model, varying the starting points of the free parameter values. The output calculated by the model for the free parameters is given in Table 2, and compared with results from previously published works on Sakurai’s Object. An isotopic ratio of and column density cm-2 are determined by the fitting procedure. These output values were obtained after 48 iterations of the model. The value that was achieved, 5.0, implies a relatively poor fit. Fixing the continuum temperature resulted in some difficulty in modelling the data, likely due to non-local thermal equilibrium population of the energy levels. A blackbody curve is a reasonable approximation to the dust continuum; slight deviation may be due to instrumental effects.
There is a factor of 10 difference between the column density of CO in 2004, as determined by the spherical shell model, and that estimated for 2003 by Eyres et al. (2004) (Table 2). This is partially due to the weakening of the CO band between 2003 and 2004 [Figure 1(c)]. The 2003 estimate assumed an isothermal slab of absorbing CO, and is consistent with the value cm-2 determined by our plane parallel slab model for 2004. In part, we attribute the lower column density to the fact that the spherical model integrates the absorption over all lines of sight from Sakurai’s Object, hence a larger value is expected when a single line of sight is used to characterise the column density, as in the isothermal slab model. The two models find consistent isotopic ratios, independent of the geometry.
| Parameter | Model values | Published values | Date of published observations |
|---|---|---|---|
| Dust temperature (K) | 320 (fixed) | 2003 | |
| Velocity broadening (km s-1) | 180 (fixed) | 2003 | |
| CO excitation temperature (K) | (fixed) | 2003 | |
| Column density ( cm-2 ) | 2003 | ||
| 12C/13C | , , | 1996, 1998 | |
| , | 2003, 2005 |
5 Discussion
5.1 ratio
Possible contributors to 13C observed in the 13CO fundamental band lines are the interstellar medium, the pre-existing PN and the post-VLTP ejecta from Sakurai’s Object. The low ratio and high velocity of the material modelled here preclude origins in the ISM [ (Sheffer et al., 2007)] or the evolved PN [ (Palla et al., 2000), km s-1 (Acker, 1993)]. Pavlenko et al. (2004) fitted synthetic spectra to UKIRT echelle spectra of Sakurai’s Object from 1998, modelling the cool stellar atmosphere in the m region. Using this technique they find an isotopic ratio of 12C/13C in material close to the star, consistent with the VLTP interpretation of Sakurai’s Object. Here we find a compatible 12C/13C ratio in material observed outside the dust shell in 2004.
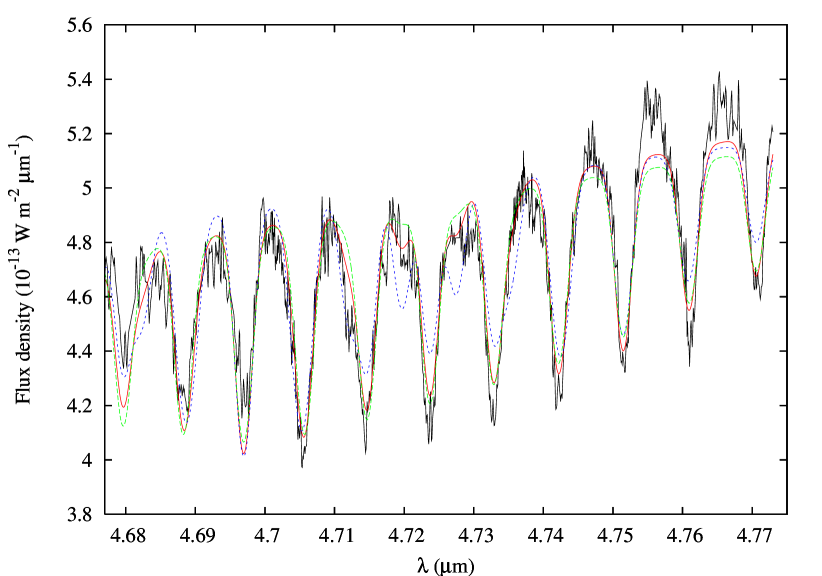
Figure 3 shows model spectra produced by the spherically symmetric shell model described in Section 4.1 for different 12C/13C ratios, superimposed upon the echelle spectrum. The best fit found by the model is depicted by the solid red line, for a 12C/13C ratio of 3.5. The blue dotted line corresponds to , in which the 13CO lines are more pronounced than observed in Sakurai’s Object (R(4) and R(5) in particular), whereas in the green dashed line, corresponding to , the absorption features are weaker than observed and there is insufficient depression of the continuum level at wavelengths where a 13CO line is expected. The isothermal slab model is in agreement with the best-fit result of the spherically symmetric model, finding .
5.2 CO velocity
From the echelle spectrum we measure a FWHM of the CO absorption features corresponding to a velocity broadening of km s-1. A gas shell expansion velocity of km s-1 is obtained from the difference between the mean radial velocity of the blueward edge of the CO lines ( km s-1) and the systemic radial velocity ( km s-1).
The absorption maximum occurs at km s-1, while the mean FWZI measures km s-1. Thus, assuming spherically symmetric expansion, material contributing to the redward edge of the line is moving at km s-1 with respect to the observer, i.e. with a velocity of km s-1 away from the central star, at an angle close to the plane of the sky. Similarly, the blueward edge ( km s-1) corresponds to gaseous motion along the line of sight to the observer. The fact that we see no emission from the limbs or the far side of the shell supports the model configuration of a star surrounded by concentric shells of dust and gas; the inferior dust shell obscures the far side of the superior gas shell, hence we detect only the blueshifted gas along the line of sight and do not see the redshifted (P Cygni) emission.
5.3 Evolution of the CO
In 1998 March, broad, blueshifted absorption of He I (m), which was absent from a spectrum of equal resolution obtained in 1997 July, was detected around Sakurai’s Object (Eyres et al., 1999). We assume the He I and CO-bearing materials were mobilised contemporaneously. Taking an expansion velocity of 500 km s-1 from the time of He I detection places limits on the outer gas shell radius of km in 2004 June; increasing to km at the time of the most recent observation in 2007. This recent gas radius is comparable with the range on the dust shell radius of km, modelled by van Hoof et al. (2007), and approximately 17 times larger than the 1997 dust radius of km determined by Kipper (1999). The consistent temperatures of CO and the continuum source (Table 2) indicate at least partial mixing of the gas and dust; we therefore take the radius of the CO shell to be a good approximation for that of the dust shell.
Shock acceleration to km s-1 would result in dissociation of the CO. The absence of CO in the spectrum of Sakurai’s Object in 1999 could be used to support a hypothesis of CO destruction in the 1998 onset of the fast wind, recombining by the 2000 April observation (Eyres et al., 2004). Alternatively, we suggest gentle acceleration of the gas by the dust due to radiation pressure. In this scenario it is expected that some of the dust would precede and hence obscure the gas; the CO only becoming visible with expansion and thinning of the dust shell over time.
Assuming a thin, spherically symmetric gas shell, and taking a column density of cm-2 (derived by the spherically symmetric shell model), we place limits on the total CO ejecta mass of kg (i.e. M⊙), dependent on the date the wind commenced. Significant asymmetry or asphericity of the nebular geometry [e.g. van Hoof et al. (2007); Kimeswenger et al. (2008)] would cause this value to vary.
5.4 Dust temperature
The equilibrium temperature of the dust at the radius determined in Section 5.3 is K. This is based on assumptions of 1 m graphitic carbon grains (Tyne et al., 2002); a stellar luminosity of 3000 L⊙ (Herwig, 2001; Tyne et al., 2002) and an effective temperature of 5200 K (Pavlenko, 2002). An equilibrium temperature of 320 K at this radius would require an impossibly high luminosity; a factor of greater than predicted by the models of Herwig (2001) and Tyne et al. (2002). The CO temperature of 320 K is also inconsistent with stellar radiation. This suggests some additional heating mechanism was operating prior to, and during, 2004. The most likely mechanism would appear to be associated with collisional heating within the wind as dust and gas velocities equalise and turbulence dissipates. The kinetic energy in the outflow is more than sufficient to heat the material to the observed temperature. The flux density at m dropped by a factor of in the 14 months between observations in 2004 and 2005. This decline corresponds to a drop in blackbody temperature of K, from 320 K in 2004 to K in 2005, comparable with K determined by Evans et al. (2006) from observations at 20 m in 2005 April. This is a much larger drop than in the years just prior to and subsequent to 2004-2005 [Figure 1(a)] and may indicate the rapid weakening of this additional heating process.
6 Conclusions
Observations in the m region show weakening of the CO and continued cooling of the dust surrounding Sakurai’s Object between 2003 and 2007, with a particularly marked temperature decrease between 2004 and 2005. The 2004 dust temperature is K hotter than can be accounted for by stellar radiation alone.
From an echelle spectrum of CO absorption features around m, we determine a wind velocity of km s-1, which we use to estimate an outer gas shell radius of km ( R⊙) in 2004. With consistent gas and dust temperatures ( and K, respectively), we believe the two components to be at least partially mixed. Assuming continuous, uninterrupted expansion of the CO away from the central star at constant velocity, the gas shell radius would have reached km ( R⊙) by the time of the most recent observation of Sakurai’s Object in 2007 June. We measure a velocity of peak absorption of km s-1, comparable with km s-1 obtained by Eyres et al. (2004) for 2003.
By modelling the CO fundamental in a spherically symmetric shell of material surrounding Sakurai’s Object, we have determined an isotopic ratio of . Application of a simple isothermal slab model of absorbing CO also yields . These results are consistent with earlier estimates of this isotopic ratio in this system (Asplund et al., 1999; Pavlenko et al., 2004; Eyres et al., 2004; Evans et al., 2006). In particular, agreement with the atmospheric simulations of Pavlenko et al. (2004) demonstrate this low ratio as being consistent with material having been ejected from the central star during the VLTP event and being swept out with the fast wind, rather than forming part of the old PN, or existing in the intervening interstellar medium.
Acknowledgements
HLW acknowledges studentship support from the University of Central Lancashire. MTR acknowledges support from the University of Central Lancashire. TRG is supported by the Gemini Observatory, which is operated by the Association of Universities for Research in Astronomy, Inc., on behalf of the international Gemini partnership of Argentina, Australia, Brazil, Canada, Chile, the United Kingdom, and the United States of America. Some of the data reported here were obtained as part of the UKIRT Service Programme. The United Kingdom Infrared Telescope is operated by the Joint Astronomy Centre on behalf of the Science and Technology Facilities Council of the UK.
References
- Acker (1993) Acker A., 1993, Acta Astron., 43, 419
- Asplund et al. (1999) Asplund M., Lambert D.L., Kipper T., Pollacco D., Shetrone M.D., 1999, A&A, 343, 507
- Duerbeck & Benetti (1996) Duerbeck H.W, Benetti S., 1996, ApJ, 468, L111
- Duerbeck et al. (1997) Duerbeck H.W, Benetti S., Gautschy A., van Genderen A.M., Kemper C., Liller W, Thomas T., 1997, AJ, 114, 1657
- Evans et al. (2006) Evans A. et al., 2006, MNRAS, 373, L75
- Eyres et al. (1999) Eyres S.P.S., Smalley B., Geballe T.R., Evans A., Asplund M., Tyne V.H., 1999, MNRAS, 307, L11
- Eyres et al. (2004) Eyres S.P.S., Geballe T.R., Tyne V.H., Evans A., Smalley B., Worters H.L., 2004, MNRAS, 350, L9
- Goorvitch (1994) Goorvitch D., 1994, ApJ, 95, 535
- Hajduk et al. (2005) Hajduk M. et al., 2005, Science, 308, 231
- Herwig (2001) Herwig F., 2001, ApJ, 554, L71
- Iben, Tutukov & Yungelson (1996) Iben I., Tutukov A.V., Yungelson L.R. 1996, ApJ, 456, 750
- Kimeswenger & Koller (2002) Kimeswenger S., Koller J., 2002, Ap&SS, 279, 149
- Kimeswenger et al. (2008) Kimeswenger S., Zijlstra A.A.,van Hoof P.A.M., Hajduk M., Lechner M.F.M., van de Steene G.C., Gesicki K., 2008, Proc. Asymmetric Planetary Nebulae IV, eds. Corradi R.L.M., Manchado A., Soker N., in press
- Kipper (1999) Kipper T., 1999, Baltic Astronomy, 8, 483
- Nakano (1996) Nakano S., Sakurai Y., Hazen M., McNaught R.H., Benetti S., Duerbeck H.W., Cappellaro E., Leibundgut B., 1996, IAUC 6322
- Palla et al. (2000) Palla F., Bachiller R., Stanghellini L., Tosi M., Galli D., 2000, A&A, 355, 69
- Pavlenko (2002) Pavlenko Y.V., 2002, Ap&SS, 279, 91
- Pavlenko et al. (2004) Pavlenko Y.V., Geballe T.R., Evans A., Smalley B., Eyres S.P.S., Tyne V.H., Yakovina L.A., 2004, A&A, 417, L39
- Press et al. (1992) Press W.H., Flannery B.P., Teukolsky S.A., Vetterling, W.T. 1992, Numerical Recipes in FORTRAN, Cambridge University Press, Cambridge.
- Sheffer et al. (2007) Sheffer Y., Rogers M., Federman S.R., Lambert D.L., Gredel R., 2007, ApJ, 667, 1002
- Tokunaga (2000) Tokunaga A.T., 2000, in Allen’s Astrophysical Quantities , ed. A.N. Cox (New York: Springer), 143
- Tyne et al. (2000) Tyne V.H., Eyres S.P.S., Geballe T.R., Evans A., Smalley B., Duerbeck H.W., Asplund M., 2000, MNRAS, 315, 595
- Tyne et al. (2002) Tyne V.H., Evans A., Geballe T.R., Eyres S.P.S., Smalley B., Duerbeck H.W, 2002, MNRAS, 334, 875
- van Hoof et al. (2007) van Hoof P.A.M., Hajduk M., Zijlstra A.A., Herwig F., Evans A., Van de Steene G.C., Kimeswenger S., 2007, A&A, 471, L7