59 \vgtccategoryResearch \vgtcinsertpkg
An Eye Tracking Study into the Effects of Graph Layout
Abstract
Graphs are typically visualized as node-link diagrams. Although there is a fair amount of research focusing on crossing minimization to improve readability, little attention has been paid on how to handle crossings when they are an essential part of the final visualizations. This requires us to understand how people read graphs and how crossings affect reading performance.
As an initial step to this end, a preliminary eye tracking experiment was conducted. The specific purpose of this experiment was to test the effects of crossing angles and geometric-path tendency on eye movements and performance. Sixteen subjects performed both path search and node locating tasks with six drawings. The results showed that small angles can slow down and trigger extra eye movements, causing delays for path search tasks, whereas crossings have little impact on node locating tasks. Geometric-path tendency indicates that a path between two nodes can become harder to follow when many branches of the path go toward the target node. The insights obtained are discussed with a view to further confirmation in future work.
keywords:
eye tracking, edge crossing, geometric path, evaluation, graph drawingH.1.2Models and PrinciplesUser/Machine SystemsHuman Factors; \CRcatH.5.0Information Interfaces and PresentationUser InterfacesEvaluation/methodology
1 Introduction
Graphs are typically visualized as node-link diagrams. A graph can be drawn in many different ways by simply changing the layout of nodes. A growing number of empirical studies have shown that graph layout affects not only readability, but also the understanding of the underlying data. In particular, edge crossings (or link crossings) has long been a major concern in graph drawing; it is commonly accepted and employed as a general rule that the number of crossings should be reduced as much as possible [10]. However, in practice, crossing minimization is a hard problem in designing algorithms for graph drawing [3]. There are also many graphs in which crossings are not removable. Although there is a fair amount of research focusing on crossing minimization (e.g., [2, 9, 15]) in the literature, little attention has been paid on how to handle crossings when they are an essential part of the final visualizations.
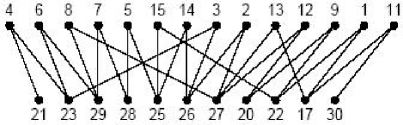
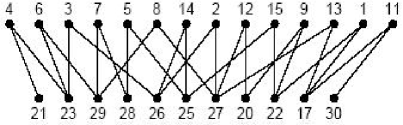
Some researchers have pointed out that different crossing styles may have different degrees of impact. Take the two drawings in Figure 1, as an example. These two drawings were of a graph and drawn using two different approaches: -planarization [15] and minimal-crossing-number [9], respectively. The drawing in Figure 1 has 34 crossings, which is more crossings than the drawing in Figure 1 has (24 crossings). However, as indicated in [15], an informal evaluation revealed that the former drawing was considered as having less crossings and being more readable. Further, not only the collective crossing pattern has a role in affecting graph perception, but also the individual crossing angle. For example, as mentioned in [7, 20], when edges cross at nearly-90-degree angles, they are less likely to be confusing than when crossing at acute angles.
In addition, more and more empirical studies are available showing that in some situations, crossings may not be as bad as we normally think (e.g., [7, 8]). For example, in perceiving sociograms (node-link diagrams for social networks), it was found that crossings are important only for tasks that involve path tracing [8]. Even when sociograms are drawn to convey specific information, such as how many social groups there are in the network, it is more desirable to cross edges connecting the group members [8]. It is also possible that drawing graphs without crossings can make some structural features less apparent, such as symmetry.
Thus, when the cost of crossing reduction cannot be justified, or when crossings become unavoidable, the questions arise: How can we reduce the negative impact of crossings to the minimum? In what situations can we simply ignore the presence of crossings, or even make use of them? To answer these questions, we need to have knowledge of how and when crossings, or visual layouts in a broader sense, affect graph understanding. In addition, it is also essential for us to have a good understanding of how people read graphs.
1.1 Related Work
User studies investigating layout effects can be divided into two groups according to the graphs used: abstract graphs and domain graphs (such as sociograms, UML diagrams).
Purchase [17] conducted a user study examining the effects of five graph drawing aesthetics (symmetry, edge crossings, angular resolution, and orthogonality) on task performance. It was demonstrated that minimizing crossings was overwhelmingly beneficial in understanding graph structure; edge crossings was “by far the most important aesthetic” compared to the other four. In an experiment that was to examine several aesthetics within the same set of computer-generated diagrams, Ware et al. [20] found that good path-continuity was also a positive factor for path search tasks. They also demonstrated that for shortest path tasks, “it is the number of edges that cross the shortest path itself that is important, rather than the total number of edge crossings in the drawing” [20].
Korner et al. [12] investigated the effects of visual properties of hierarchical graphs on task response speed: planarity (edge crossing), slopes (edge orientation), and levels (hierarchy). Analysis of response latencies showed that crossings was the most influential variable. “It is the general disarrangement present in crossed drawings that causes the slower comprehension speed [12]”, no matter whether the graph elements in question are involved with crossings or not. This is quite different from what was found in [20] on the effects of crossings. We will come back to this matter later in this paper.
In investigating layout effects on sociogram perception, McGrath et al. [14] administered a user study. Five different drawings of a network were used. In each of these drawings, the spatial arrangement varied in Euclidean distance between two nodes and nodes to the center of the drawing. Subjects were asked to perform domain specific tasks. It was found that both network structure and spatial arrangement of nodes influenced the understanding of network structural features [14]. In another study, McGrath et al. [13] found that the perception of network groups can be significantly affected by the visual clusters appearing in the sociogram.
1.2 Motivation
Many observations in graph layout evaluations are mainly based on task response time and accuracy. This approach tells us what the consequences will be in terms of task performance when a particular layout is to be used. However, this approach treats the human mind as a “black box”, and therefore cannot explain where the time is spent and how the accuracy is affected.
As an initial attempt to understand how people read graphs, an eye tracking study was conducted in [7] to understand how crossings affect task performance. Subjects were given five pairs of crossing and non-crossing drawings and asked to find a shortest path between two given nodes for each drawing. Their response times and eye movements while performing the tasks were recorded. It was reported that only one crossing drawing took the subjects a significantly longer time than the corresponding non-crossing drawing. The video analysis showed that:
-
1.
Crossings had little impact on subjects’ eye movements; it appeared that those crossings were simply ignored by the subjects during path searching.
-
2.
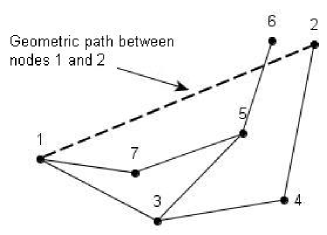
It was the edges going towards the target node that distracted eyes and caused delays. In other words, as illustrated in Figure 2, in performing the shortest path task, subjects tended to follow edges which were close to the geometric path of the two nodes. If the edges were not part of the shortest path, they had to go back and start searching again, which took time and caused errors. For simplicity, this graph reading behavior is termed as geometric-path tendency.
This was quite surprising since it indicated that crossings were not the major time consuming factor as expected. However, a closer look at the study revealed the following facts:
-
1.
The graphs used in [7] were sparse, and small with the largest graph containing only 11 nodes and 15 edges.
-
2.
The crossing angles in the crossing drawings were generally quite large (nearly 90 degrees).
When graphs are small and crossing angles are large, the impact of crossings may be too small to be significant. The user study described in this paper was aimed to address the above points. It was hoped that this experiment could provide some useful insights for future design of more formal experiments investigating layout effects.
1.3 Outline
The rest of the paper is organized as follows. Section 2 presents the experiment, followed by the results in section 3. The findings obtained in this experiment are discussed in section 4. Finally, section 5 concludes the paper with an outline of future work.
2 Experiment
This experiment was conducted to: 1) see how crossing angles affect eye movements; 2) replicate geometric-path tendency. The first is a drawing property and the second is a graph reading behavior.
2.1 Subjects
Sixteen subjects were recruited on a completely voluntary basis. All of them had normal vision and were regular computer users. They had different degrees of familiarity with node-link diagrams; two of them had no knowledge at all at the time of participation. The subjects were reimbursed $20 each for their time and effort upon the completion of their tasks.
2.2 Apparatus
The testing room contained one operator PC on which an eye tracking system was running, one subject IBM T41 laptop on which stimulus diagrams were to be shown, and adjustable chairs and tables. Adjustments were made to maintain the subject’s eyes at a distance of approximately 40 cm from the 14-inch monitor of the laptop. The eye tracking system used in the experiment was iViewX with Headmounted Eye-tracking Device (HED) (SensoMotoric Instruments GmbH (SMI)). The HED is a helmet to be worn by the subject that contains an eye camera.
A calibration tool called WinCal was used for visualizing calibration points and run on the subject laptop, so that the subject can calibrate while sitting in front of the laptop. The laptop and the operator PC were connected by a serial line for this purpose. Once enabled, WinCal can be triggered by the commands from the operator PC, maximize and minimize itself automatically at the start and end of calibration, respectively. The calibration area in iViewX had been set to match the resolution of the laptop monitor, that is, 1024 768 pixels.
The eye tracker tracks eye movements by observing the position of the pupil and corneal reflex from the right eye. The system had been reconfigured so that the content of the laptop monitor screen with eye gaze position indicated by a gaze cursor can be recorded into MPEG video files for offline analysis.
2.3 Stimuli
Six drawings were grouped into two three-drawing sets: Set 1 for testing crossing angles, and Set 2 for testing geometric-path tendency. As can be seen from Table 1, relatively larger graphs were used compared to those in [7]. Note that for Set 1 drawings in Table 1, only some of the nodes were labeled, though in the real tests, all labels were visible.
The three drawings (c1, c2 and c3) from Set 1 were of a graph containing 32 nodes and 43 edges. The graph had 2 components: path component and condition component. In producing the three drawings, the layout of the path component remained unchanged. The layout of the other component was modified to make the three conditions: no crossings on the path (c1), nearly-90-degree crossings on the path (c2) and small-angle crossings on the path (c3). c1 was the control condition that was to compare how eye movements changed when crossings were introduced in c2 and c3.
In drawing graphs, reducing crossings normally causes a path less continuous [20]. However, path continuity was also identified as a notable factor affecting graph perception [20]. By using two-component graphs and keeping the path component the same, this confounding effect can be removed. In addition, since the main purpose for Set 1 drawings was to test crossing angles, not to test how easy or difficult it is to find the correct path, the path component contained only one path to avoid any other confounding effects introduced by multiple paths and branches. However, subjects were not made aware of these facts beforehand, although they might have come to realize them after they had finished the tasks.
The three drawings (f1, f2 and f3) from Set 2 were of another graph containing 20 nodes and 32 edges. In f1, the shortest path between nodes 1 and 2 (1-11-15-2) was far away from the geometric path of nodes 1 and 2 and had no crossings, while the shortest path in f2 (1-6-11-2) and f3 (1-22-11-2) had three crossings (with nearly-90-degree angles) and was near the geometric path. In addition, there were more crossings in total in f2 than in f3.
| Set 1 | Set 2 |
|---|---|
![[Uncaptioned image]](/html/0810.4431/assets/x4.png) |
![[Uncaptioned image]](/html/0810.4431/assets/x5.png) |
| c1 | f1 |
![[Uncaptioned image]](/html/0810.4431/assets/x6.png) |
![[Uncaptioned image]](/html/0810.4431/assets/x7.png) |
| c2 | f2 |
![[Uncaptioned image]](/html/0810.4431/assets/x8.png) |
![[Uncaptioned image]](/html/0810.4431/assets/x9.png) |
| c3 | f3 |
2.4 Tasks
Shortest path tasks are typically used in previous studies in testing the effects of crossings. To understand the effects fully, a node locating task was also included in this study. After all, among the seven generic tasks described in [4], node locating is one of the important components in graph perception.
In testing path search tasks, related nodes are normally pre-selected and highlighted, so that locating the nodes can be excluded from path searching. As mentioned in section 1.2, the study [12] had a different finding on the effects of crossings, compared to the finding from the study in [20]. This might be due to the fact that the nodes to be considered were not highlighted beforehand in [12]; to find the path between them, the two nodes had to be located first. Korner et al. [12] suspected that “crossings themselves may affect early stages of visual information processing”. “Such salient properties (crossings) are processed in precedence, and draw attention and distract the visual system from the message of the drawing”. If this is the case, they are likely to happen during the node locating stage. To see what is really going on when node locating is part of a path search task, the shortest path task without highlighting nodes first was also included as one of the tasks.
As such, the following three tasks were used:
-
1.
Path task: find the shortest path between nodes 1 and 2. Nodes 1 and 2 were highlighted.
-
2.
Node+Path task: find the shortest path between nodes 1 and 2. Nodes 1 and 2 were not highlighted.
-
3.
Node task: find the most connected node.
The first task is a pure path search task, the third is a target locating task, and the second is the combination of path search and target locating.
2.5 Online Task Setting
A system had been developed for the subject to perform the tasks online. The system displayed a question first. The subject pressed the button on the screen, the question disappeared and the corresponding drawing was then shown. The subject answered the question by clicking one of the buttons above the drawing; each button showed one of the possible answers. Once the button was clicked, a new question was shown, and so on.
Subjects’ responses (time and accuracy) were logged by the online system. Their eye movements were recorded by the eye tracking system in real time.
The experiment included three sessions; one session for each task. The order of the three tasks was random. In each session, the subject had to perform the task with each of the six drawings. The drawings in each session were displayed randomly. There was a break between sessions. Just before each session a calibration was conducted.
Each time when a drawing was shown, the nodes were labeled differently to avoid possible recognition of the same graph.
2.6 Procedure
All the subjects were given time to read tutorial material, ask questions and practice. They were also instructed to answer each question as quickly as possible without compromising accuracy, and not to use a mouse to help.
The experiment was conducted on an individual basis. After some practice, subjects performed the tasks online. A post-task questionnaire was given, and a short interview held with the subject, following the experiment. Seven of the subjects were chosen to explain their eye-movement behaviors while watching their own eye movement videos. The whole experiment took about 50 minutes.
3 Results
3.1 Quantitative Results
Although eye movement data was of the main interest for this study, the performance data was also analyzed. Given the small number of subjects and the limited variety of the stimuli used in the study, quantitative results are presented as additional evidence in support of eye movement findings, which are described in sub-section 3.2.
3.1.1 Response Time
| Drawing ID | c1 | c2 | c3 | f1 | f2 | f3 |
|---|---|---|---|---|---|---|
| Node task | 16.37 | 19.97 | 23.22 | 16.54 | 17.52 | 16.20 |
| Path task | 6.81 | 14.74 | 29.41 | 13.61 | 16.07 | 13.33 |
| Node+Path task | 9.54 | 16.28 | 33.58 | 15.72 | 15.12 | 21.91 |
A non-parametric test of Friedman was used for statistical analysis. The median times for all responses are shown in Table 2.
Node Task: Among Set 1 drawings, the shortest time was spent with c1, followed by c2, then c3. The test indicated that there were significant differences in response times (). Pairwise comparisons found that only the difference between c1 and c3 was significant (). For Set 2 drawings, a slightly shorter time was spent with f3 than with f1. The longest time was spent with f2. However, the test did not find any significant differences ().
Path Task: From Table 2, it can be seen that the time spent with c2 and c3 was longer than with c1; the longest time was spent with c3. The test revealed that these differences were statistically significant (). Pairwise comparisons indicated that the time difference for each pair was also statistically significant (for each pair, ). For Set 2 drawings, the subjects spent the longest time with f2, followed by f1. The shortest time was spent with f3. However, the test showed that these differences were not statistically significant ().
Node+Path Task: For Set 1 drawings, the longest time was spent with c3, followed by c2, then c1. The analysis revealed that there were significant differences in response time among the three drawings (). Pairwise comparisons indicated that the difference for each pair was also statistically significant (). For Set 2 drawings, the shortest time was spent with f2, followed by f1. f3 took the subjects the longest time. The test showed that there were significant time differences among the three drawings (). Pairwise comparisons found that the differences between f1 and f3, f2 and f3 were statistically significant ().
3.1.2 Error Rate
| Drawing ID | c1 | c2 | c3 | f1 | f2 | f3 |
|---|---|---|---|---|---|---|
| Node task | 0.00 | 6.25 | 25.00 | 0.00 | 0.00 | 0.00 |
| Path task | 0.00 | 0.00 | 0.00 | 18.75 | 0.00 | 31.25 |
| Node+Path task | 0.00 | 0.00 | 0.00 | 18.75 | 12.50 | 37.50 |
The error rates for all the six drawings and the three tasks can be seen in Table 3. For the Node task, all the responses were correct except for c2 and c3; the error rates were and respectively. A visible inspection suggested that the angular resolution in c2 and c3 was the worst among all the drawings. It is reasonable to imagine that when the angular resolution is poor, the task will be harder, thus causing more errors in counting the number of edges that a node has. Although in this experiment, the bad angular resolution was the result of making crossings, angular resolution is not necessarily linked to crossings in practice.
For the path search tasks, regardless of whether the nodes were highlighted or not, the subjects made no errors for Set 1 drawings. This was not surprising, since there was only one path (therefore the shortest path) between nodes 1 and 2. For Set 2 drawings, when the nodes were highlighted, the highest error rate was made with f3 (), followed by f1 (). No errors were made with f2. When no nodes were highlighted, and following the same pattern, the highest error rate was with f3 (), followed by f1 (), then f2 ().
3.2 Eye Movements Video and Questionnaire Analysis
First, for the path search tasks with Set 1 drawings, it can be clearly seen that the speed of eye movements was the fastest with c1. With c2, the overall eye movements were still smooth but became slower. Although some subjects claimed that they were not affected by crossings here, the response time data did show that the subjects responded significantly slower with c2 than with c1, as stated in sub-section 3.1. With c3, eye movements were very slow, and more significantly, on the edge connecting nodes 13 and 6 (see c3 in Table 1). There were also quite a lot of back-and-forth eye movements around the crossing points on that edge. This indicted that the viewer was uncertain about which way to go. Clearly, the low-angle crossings in c3 caused slow and extra eye movements, which contributed to the longest response time. Subjects’ comments on crossings included: crossings “force me to focus harder”, “help to improve my concentration”; “crossings affect me except at right angles”; “I think edge crossings slowed me down”; “crossings make graphs more complicated and confusing”; “if the angle is small, you have to be careful when following the edge to make sure you end up at the right node”.
Secondly, for finding the shortest path in f1, most of the subjects searched on the paths near the geometric path first. For example, 15 subjects for the Path task and 12 for the Node+Path task searched the nearest path of 1-20-8-18-2 first. Some simply missed the correct path of 1-11-15-2. Most of them detected the path either at a later stage of search or just before pressing the button, as a subject commented: “I often found the shortest route last”.
The high error rate with f3 was surprising. The video inspection on f3 revealed that the subjects spent most of their time on the left part of the drawing, where there were more crossings. This also happened with f2. In addition, most of the subjects found the correct path (1-22-11-2) in f3 at the later stage. Six subjects mentioned in the questionnaire that long edges had some influence and commented: “long edges need more time to reconfirm”; “the shortest path of few long steps (edges) outside many short steps is harder to see”. However, intuitively long-edge paths in sparse areas are visually more outstanding and should be easier to detect [12], such as the shortest paths in f1 and f3. This was not the case in this study and therefore needs further examination.
Third, for the Node task, it seems that the subjects searched for the most connected node randomly rather than systematically. This probably was because the distribution of the nodes was unorganized in the drawings. However, it is clear that the eye movement pattern was as follows: eyes stayed around the node for a while counting the edges, then moved straight from one node to the next. Subjects’ eyes tended to start the task with nodes in dense areas first. All the subjects claimed that for the Node task, crossings did not have any influence on them. Some subjects preferred that edges are attached to the same side of the node so that they can count the edges at a glance, while others preferred that edges are evenly distributed around the node. The significant difference in response time between c1 and c3 for the Node task might be caused by the difference in angular resolution between the two drawings.
3.3 Comparison of Path Task and Node+Path Task
As mentioned in section 2.4, both Path task and Node+Path task were included in the study to see whether and how much the eyes can be distracted by crossings during the node locating stage. The video analysis showed that the eyes of the subjects appeared not to have been distracted by the crossings. Their eye movement patterns were much similar to those for the Node task, though their eyes moved faster since they only needed to check the labels for the Node+Path task. This was supported by comments from the subjects.
To compare the difference in response time, from Table 2, it can be seen that for each drawing, the subjects spent more time for the Node+Path task than for the Path task. This is normal since they needed extra time to locate the nodes first. However, the statistical test revealed that the differences in response time between the Path task and the Node+Path task were marginally significant (). The extra component of finding nodes in the Node+Path task contributed a little in response time.
With regard to the error rate (see Table 3), for Set 2 drawings, the error rate remained unchanged with f1 for both tasks, that is, . The subjects made slightly more errors with f2 and f3 for the Node+Path task compared to the Path task; the error rate increased from to with f2 and from to with f3. This might be because, when no nodes were highlighted, the shortest path became less visible and relatively harder for the viewer to detect.
4 Discussion
4.1 Layout Effects
The results of this experiment indicated that the eye movements of the Node task were largely independent of edge crossings. This is in line with the finding that crossings are important only when path tracing is involved [8, 11]. “After all, the presence or absence of crossed lines does not constrain the position of nodes in the graph” [11].
In this particular study, the extra component of locating nodes in the Node+Path task only made marginal differences in response time, compared to the Path task. This seemed unusual at first. However, it is in fact reasonable since the human visual system is good at searching for a target among similar distractions (e.g, [11]). In addition, during node searching, the subjects can get some idea about the paths between the nodes through their peripheral vision. This in turn helped to reduce the time for path searching, thus compensating for the time needed for locating nodes.
It should be noted that the different findings of Ware et al. [20] and Korner et al. [12] about the effects of crossings, should not be understood as a contradiction, but rather as additional evidence suggesting that the effects of crossings differ according to the situation. The task used in [12] involved a reasoning process about ordered sets, while the task in [20] was a simple path search task for abstract graphs.
With respect to the effects of crossing angles, the subjects spent a significantly longer time with c3 than with c2. Although we are unable to attribute this time difference exclusively to the small crossing angles in c3 (c3 also has a larger number of crossings), the eye movement data and user comments had made it clear that the extra back-and-forth eye movements at and around the crossing points were caused by the sharp crossing angles.
In the previous study [7], in which the graphs were small and the target shortest path was short (three at most), the impact of crossings was not so apparent. However, in this study, where a larger graph was used for c2 and the length of the shortest path was six, both eye movement data and quantitative data clearly indicted that crossings affected graph reading behavior and task performance negatively. We may conjecture that when a graph is larger and the searching path is longer, the impact of crossings can build up and become significant, even if edges cross at nearly 90 degrees.
Although the conjecture needs confirmation, an immediate implication for graph drawing is: when the graph to be drawn is small, we may need to determine whether it is worthwhile removing crossings; when the graph is large, it may be better to minimize the number of crossings first. On the other hand, when crossings are to be present in the final drawing, crossing angles should be increased to nearly 90 degrees if possible.
The effects of crossings on eye movements can be summarized as follows: when edges cross at nearly 90 degrees, eye movements may be slightly slowed down, but still smooth. When edges cross at small angles, crossings cause confusion, slowing down and triggering extra eye movements.
Geometric-path tendency is a graph reading convention; it seems irrelevant to layout effects at first glance. However, it is highly related to crossings. In many cases, it is crossings that cause confusion, making all the paths between two nodes, and branches along these paths, unforeseeable. Due to the geometric-path tendency, human eyes can easily slip into the edges that are close to the geometric path but not part of the target path.
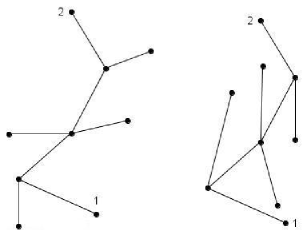
Further, the relevance of geometric-path tendency to layout effects goes beyond crossings. As illustrated in Figure 3, by changing the positions of the unlabeled nodes in the left drawing, some edges are made to go toward the labeled nodes, as shown in the right drawing. As a result of this, the path between nodes 1 and 2 may become harder to follow. Therefore, understanding how people read graphs in general and the geometric-path tendency in particular, should assist us in better assessing the effectiveness of a particular layout. More importantly, geometric-path tendency is independent of specific graph layouts. If this tendency can be extended for general path search tasks in future research, it is expected that geometric-path tendency will be a more reliable factor in predicting performance, compared to layout features such as crossings.
4.2 Eye Tracking in Graph Evaluation
Eye tracking has been successfully used in psychology as well as in HCI for many years [18]. Very few studies, however, are available in graph evaluation (understanding graphs that are drawn as node-link diagrams) [12].
This study demonstrated the promising usefulness of eye tracking in this area. Eye movement data offers additional insights into how tasks are actually carried out, which is otherwise difficult to obtain with traditional performance measures alone. In other words, the eye tacking technology can be used to approve and refine the theories developed with performance measures. In particular, since graph evaluations are all about how people visually process information from node-link diagrams, the use of eye tracking should hold great promise for future research.
5 Future Work
Given the purposes of the study and the settings of the experiment, the insights obtained in this study are far from conclusive. The quantitative evidence from further fine-tuned experiments is needed to verify them. In particular, a larger number of subjects and graphs should be employed in a more natural environment. When eye tracking is involved, standard ocular metrics [5] such as number of fixations and mean fixation duration should be included in eye movement analysis. This work is currently ongoing. More specific questions to be tested are:
-
1.
Crossing angle has a significant effect on task performance. The performance becomes worse when the angle decreases.
-
2.
Validity of geometric-path tendency and its impact on performance.
References
- [1] Brandes, U., Kenis, P. and Wagner, D. (2003) Communicating Centrality in Policy Network Drawings. IEEE Trans. on Visualization and Computer Graphics 9(2): 241-253.
- [2] Eades, P. and Wormald, N. C. (1994) Edge crossings in drawings of bipartite graphs. Algorithmica 11: 379-403.
- [3] Garey, M.R. and Johnson, D.S. (1983) Crossing Number is NP-Complete. SIAM Journal on Algebraic and Discrete Methods, 4: 312-316.
- [4] Ghoniem, M., Fekete, J.-D. and Castagliola, P. (2004) A Comparison of the Readability of Graphs Using Node-Link and Matrix-Based Representations. Proceedings of the 10th IEEE Symposium on Information Visualization (InfoVis’04), 17-24.
- [5] Goldberg, J. H. and Kotval, X. P. (1999) Computer Interface Evaluation Using Eye Movements: Methods and Constructs. International Journal Of Industrial Ergonomics, 24, 631-645.
- [6] Hill, T. and Lewicki, P. (2006) Statistics Methods and Applications. StatSoft, Tulsa, OK.
- [7] Huang, W., and Eades, P. (2005) How People Read Graphs. Proceedings of Asia Pacific Symposium on Information Visualisation 2005, 47-53.
- [8] Huang, W., Hong, S.-H. and Eades, P. (2005) Layout Effects on Sociogram Perception. In Proc. 13th International Symposium on Graph Drawing (GD’05), LNCS 3843, 262-273.
- [9] Junger, M. and Mutzel, P. (1995) Exact and heuristic algorithms for 2-layer straightline crossing minimization. In F. J. Brandenburg, editor, Graph Drawing (Proc. GD ’95), LNCS 1027, 337-348.
- [10] Kaufmann, M. and Wagner, D. (2001) Drawing Graphs: Methods and Models, LNCS 2025, Springer Verlag.
- [11] Korner, C. (2004) Sequential Processing in Comprehension of Hierarchical Graphs. Applied Cognitive Psychology, 18(4): 467-480.
- [12] Korner, C. and Albert, D. (2002) Speed of comprehension of visualized ordered sets. Journal of Experimental Psychology: Applied, 8, 57-71.
- [13] McGrath, C., Blythe, J. and Krackhardt, D. (1996) Seeing Groups in Graph Layout. Connections, 19(2): 22-29.
- [14] McGrath, C., Blythe, J. and Krackhardt, D. (1997) The effect of spatial arrangement on judgments and errors in interpreting graphs. Social Networks, 19(3): 223-242.
- [15] Mutzel, P. (1996) An alternative method to crossing minimization on hierarchial graphs. In Proc. Symp. Graph Drawing GD’96, LNCS 1190, Springer Verlag, 318-333.
- [16] Purchase, H., Cohen, R. and James, M. (1995) Validating graph drawing aesthetics. In Proc. Symp. Graph Drawing GD’95, LNCS 1027, Springer-Verlag, 435-446.
- [17] Purchase, H. (1997) Which aesthetic has the greatest effect on human understanding? In Proc. of the 5th International Symposium on Graph Drawing (GD’97), LNCS 1353, Springer-Verlag, 248-261.
- [18] Rayner, K. (1998) Eye movements in reading and information processing: 20 years of research. Psychological Bulletin, 124(3): 372-422.
- [19] Sugiyama, K., Tagawa, S. and Toda, M. (1981) Methods for Visual Understanding of Hierarchical Systems. IEEE Trans. Systems, Man, and Cybernetics, 11: 109-125.
- [20] Ware, C., Purchase, H., Colpoys, L. and McGill, M. (2002) Cognitive Measurements of Graph Aesthetics. Information Visualization. 1(2): 103-110.