Light pollution in Spain. An european perspective
Abstract
Spain appears in light pollution maps as a country less polluted than their neighbours in the European Union. This seems to be an illusion due to its low population density. The data indicate that Spain is one of the most contaminated countries. To reach these conclusions we compare the Spanish case to those of other European countries.
1 European light emission to the space
Using DMPS satellite night images taken in year 2000 we have estimated the saturated surface in many European countries. The goal of this study is to compare the illumination conditions and its effects in light pollution.
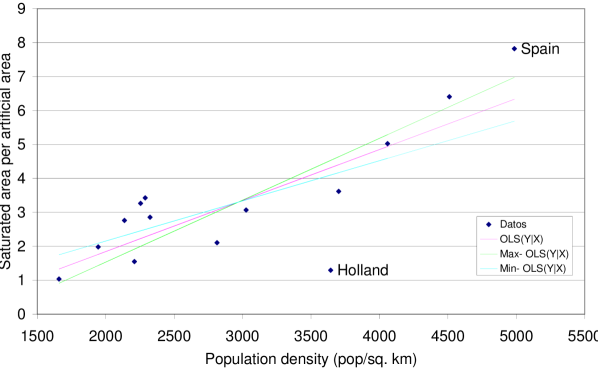
We have measured the surface of the saturated zone. We here compared this parameter to the ratio of population density of the country. To avoid biases we normalize by dividing the area built in each country prior to the comparison. In this way it only takes into account the surface that really makes sense to illuminate.
In satellite images and other light pollution (LP) maps, Spain seems to have less light pollution than other European countries. That could be an effect caused by the low population density. We have looked for the best intensive demographic parameter that represents better the real LP. This study shows that the correction using the mean light power used is important as non demographic parameter to take into account.
The results differ from the preliminary study of Sánchez 2007 because now we use high resolution images and new realised data of built area. Fits proposed by Isobe et al. (1990) have been used. Fig. 1 shows the ordinary least squares fit and its outstanding high and low for the uncertainty of this magnitude. The partial correlation corrected by power installed by light point, increase the correlation from R2=0.56 to R2=0.81. It can be discarded not correlation with 95% of confidence using the tests of Kendal, Fisher and Spearman. Bootstrap simulations and no parametric tests have also been used. In Fig. 1, Holland and Spain have been marked because are the extreme examples.
2 Spain: Champion of Europe in power for lights
2.1 Excess saturated area in Spain
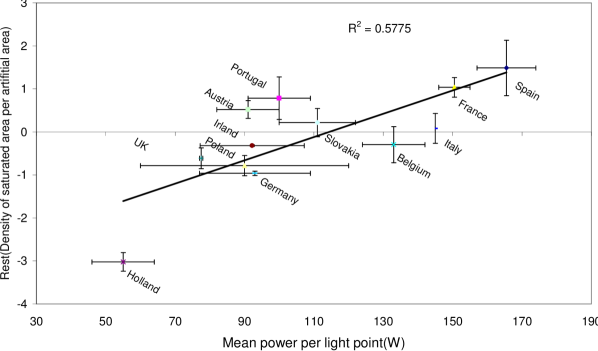
Spain and Holland position in Fig. 1 show a very important excess if it is compared to its theoretical position according with the fits. It is possible that other sources of error not connected demographics influence cause this dispersion. But we have found a correlation between power installed by light point and residuals of the fits between saturated and built area (see Fig. 2).
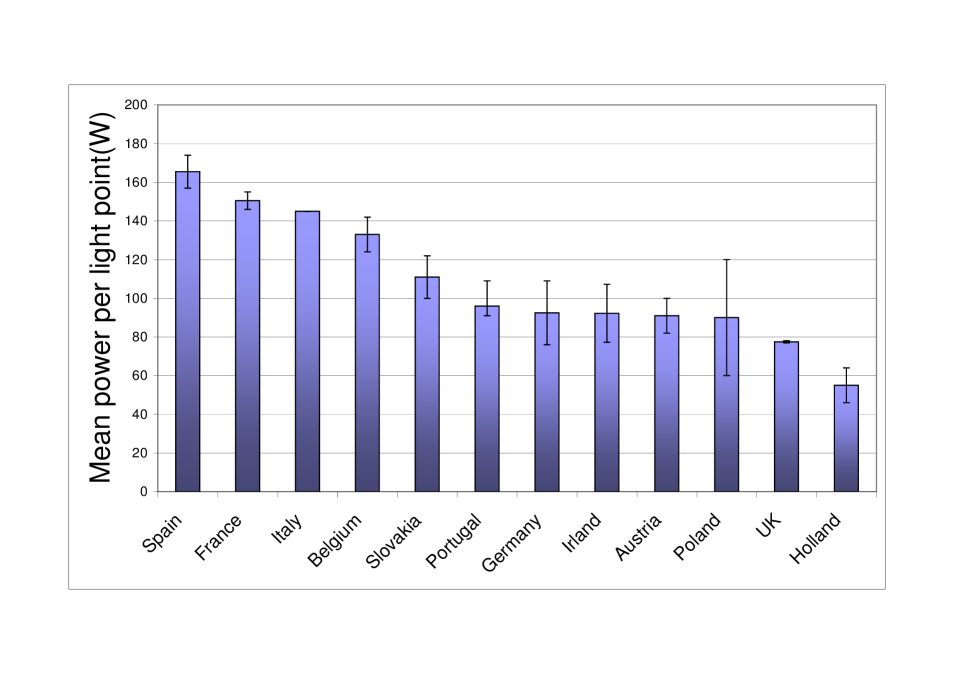
Now we are looking for other factors that could be connected as Light point’s density. A possible answer: If we consider the same sort of lamp, an increased power always produce greater emission. While the type use of the lamp and lighting can affect the final flux, the energy available is always marked by the power of the lamp. The data of EU studies (Van Tichelen et al 2007; EnLight Project) show that Spain is the country that used the most powerful lamps So, we have good reasons to suppose that the power excess in the Spanish cities makes that in Spain around 1,5 km2 more saturated area per square kilometre built.
The power excess increasing the effect of an incorrect use of light points and the light flux reflected of the pavements. Without control of power installed it will be impossible to reduce the increase effect of LP. The actual LP models remark the effect important secondary diffusion (Aubé 2007). It makes that great power light concentrated are worst than the same in disperse area.
2.2 Growing concern
The Energy General Secretary of Spain data show that the growing of installed power is constant since 1967 (Publicationes of the Spanish Ministerio de Industria, Turismo y Comercio, see references). Apparently, there is a plateau during 8 years, but detailed analysis show important increases in Madrid, Barcelona and other provinces consumption being the flat zone an artifact caused by the change of the statistical processes. The bottom line is that, despite the fight against Light Pollution, we are losing the battle.
References
- (1) Aubé, M., 2007, Proceedings of ’Starlight, a Common Heritage’ Unesco conference held at La Palma, C. Marin & J. Jafari eds. p.351
- (2) European Energy Efficiency Outdoor Lighting in Urban Areas (EnLight Project, www.eu-enlight.org)
- (3) Isobe, T.; Feigelson, E.; Akritas, M. and Babu, G.J. 1990, ApJ 364,104
- (4) Ministerio de Industria, Turismo y Comercio (www.mityc.es). Estadísticas anuales de la industria de energía eléctrica años 1967-2005.
- (5) Ministerio de Industria, Turismo y Comercio (www.mityc.es). La Energía en España 2004
- (6) van Tichelen, P.; Geerken, T.; Jansen, B.; Vadnden Bosch, M.; Van Hoof, V.; Vanhooydonck, L. and Vercalsteren, A., 2007, VITO (www.vito.be) Project Report Lot 9: ’Public Street Lighting’
- (7) Sánchez de Miguel, A., 2007, Proceedings of ’Starlight, a Common Heritage’ Unesco conference held at La Palma, C. Marin & J. Jafari eds. p.379