A Multiwavelength View of Star Formation in Interacting Galaxies in the Pavo Group
Abstract
We combine Spitzer IRAC mid-infrared and Chandra X-ray observations of the dominant galaxies NGC 6872 and NGC 6876 in the Pavo group with archival optical and HI data to study interaction-induced star formation. In the spiral galaxy NGC 6872, and nonstellar emission having colors consistent with polycyclic aromatic hydrocarbons (PAHs) is concentrated primarily in clumps in three regions: in a kpc radius outer ring about the center of the spiral galaxy, in a bridge of emission connecting NGC 6872’s northern spiral arm to IC 4970, and along the full extent of both NGC 6872’s tidal arms. PAH emission is correlated with young star clusters and dense HI regions. We find no strong differences in the mid-infrared colors of the star-forming regions in the spiral galaxy NGC 6872 as a function of position relative to the tidally interacting companion galaxy IC 4970. We find eleven very luminous X-ray sources ( erg s-1 ) clustered to the southwest in NGC 6872, near bright star-forming regions. In NGC 6872’s tidal features, young star clusters form at the boundaries of diffuse X-ray gas, suggesting that stars form as gas stripped by the interactions cools. The nucleus of NGC 6872 is a weak X-ray point source with keV luminosity of erg s-1 , but there is little evidence in the inner kpc of NGC 6872 for PAH emission from recent star formation or nuclear activity. However, a kpc ‘stream’, leading from the outer ring of NGC 6872 to the nucleus, may signal the transport of interstellar matter into NGC 6872’s nuclear region. Nonstellar emission, consistent with PAH emission, is also found in the central region of elliptical galaxy NGC 6877, companion to the dominant Pavo group elliptical galaxy NGC 6876. However, in the central region of NGC 6876, the dust emission is more likely due to silicate emission from old AGB stars.
Subject headings:
galaxies: clusters: general – galaxies:individual (NGC 6872, NGC 6876, NGC 6877) – galaxies: interactions – infrared: galaxies – X-rays: galaxies1. Introduction
Galaxy collisions and mergers have long been known to influence star formation in galaxies (see, e.g., the review by Struck 1999 and references therein) and likely play a fundamental role in the transformation of the population of gas-rich spiral galaxies at high redshift into the spheroidal and elliptical galaxies that dominate dense galaxy groups and clusters at the present epoch. Probing the details of the gravitational and hydrodynamical processes that affect star formation during these collisions has only recently become possible with the advent of high spatial resolution observations that are capable of resolving star-forming complexes within nearby galaxies across the full electromagnetic spectrum (radio to X-ray), and that allow us to measure the thermodynamic properties of cold and hot gas in and around these galaxies.
Early studies of star formation in interacting galaxies were based primarily on observations in the optical and far-infrared wavebands. These studies focused on global star formation properties and correlations between observable star formation indicators. For example, Kennicutt et al. (1987) found that H emission and far-infrared to blue luminosity ratios were enhanced in interacting galaxies compared to galaxies in non-interacting samples. More recent optical studies using large area redshift surveys suggest H equivalent widths may be correlated with galaxy pair separation (e.g., Barton et al. 2000 using the second CfA redshift survey; Lambas et al. 2003 using the 2dF survey; Nikolic, Cullen & Alexander 2004 using the SDSS survey). However, extinction in the optical wavebands and dust heating by evolved AGB stars in the far-infrared made global star formation activity in galaxies difficult to measure, and contributed to the large scatter in these relationships. Studies of individual star-forming regions within interacting galaxies were largely limited to optical wavebands, because of the low spatial resolution of the far-infrared data. From these optical studies, the spatial distributions and masses of star forming clumps were found to be diverse. While star formation was often enhanced in the nuclear region of the dominant galaxy of an interacting galaxy pair, star formation was also prevalent at large radii in extended tidal features. Masses of these star-forming clumps span more than six orders in magnitude, from young ( Myr old) star associations, that may rapidly dissolve (Werk et al. 2008), to bound systems, with masses similar to globular clusters (Trancho et al. 2007), and systems, sometimes called tidal dwarf galaxies. With the launch of the Spitzer Space Telescope (Werner et al. 2004), high spatial resolution mid-infrared imaging and spectroscopy of star-forming regions within nearby galaxies became possible. Using mid-infrared luminosities and colors, nonstellar emission from polycyclic aromatic hydrocarbon (PAH) molecules, excited by newly formed stars in dusty regions, could be separated from the diffuse starlight and the silicate emission expected from evolved stars, thus completing the census of global star formation in the galaxy. With the high angular resolution of the Spitzer Infra-Red Array Camera (IRAC; Fazio et al. 2004), subtle differences in the star-forming clumps could be probed as a function of their spatial distribution within the interacting system.
Most recent mid-infrared studies of interaction-induced star formation have focused on interacting galaxy pairs in isolation from their environment. Galaxies in the largest such study, the Spitzer Spirals, Bridges and Tails Interacting Galaxy Survey (SSB&T; Smith et al. 2007), were optically selected from the Arp catalog of interacting galaxies (Arp 1966) to include only nearby, isolated galaxy pairs that exhibited tidal features, and specifically excluded triple and higher multiple galaxy systems and merger remnants. Smith et al. (2007) compared the mid-infrared properties of interacting galaxies in the SSB&T sample, as a whole, to those of normal, noninteracting spiral galaxies drawn from the Spitzer Infrared Nearby Galaxy Survey (SINGS; Kennicutt et al. 2003). On average, they found that interacting galaxy pairs have redder mid-infrared colors, and that star formation is enhanced and more centrally concentrated in the dominant spiral galaxy of the interacting pair than in normal spiral galaxies. No evidence was found for a correlation between mid-infrared colors and galaxy pair separation in the interacting galaxies, as might have been expected from the optical data. Also, no strong differences were found between the mid-infrared colors in the interacting galaxies’ stellar disks and those measured in their tidal bridges and tails. However, since the study averaged over interactions with different orbital characteristics and galaxy masses, subtle differences related to the details of the interaction could be washed out. Individual case studies of a handful of isolated, interacting galaxy pairs, using ultraviolet, optical and mid-infrared data, suggested that interaction-induced star formation occurs in clumpy bursts. The ages and spatial distribution of the star-forming clumps may reflect the stage and orbital parameters of the collision, as inferred from numerical simulations of the collision (e.g. Wang et al. 2004 for NGC4038/4039; Smith et al. 2005a for Arp 107; Elmegreen et al. 2006 for NGC 2207; Hancock et al. 2007 for Arp 82).
Results from the DEEP2 galaxy survey show that the fraction of blue, star-forming galaxies is rapidly changing between redshifts , and that galaxy evolution at these redshifts occurs not in isolated galaxy pairs, but predominantly in moderately massive galaxy groups with galaxy members and velocity dispersions km s-1 (Gerke et al. 2005; Cooper et al. 2006). Thus understanding how the group environment affects star formation in interacting galaxies is vital to understanding how dusty, blue star-forming disk galaxies evolve into the early-type galaxies, hosting little or no ongoing star formation, that dominate groups and rich clusters today. By including X-ray observations with the other traditional (optical and infrared) tracers of star formation activity, we have direct observational constraints on the temperature and density of the intragroup gas (IGM) surrounding these galaxies, and on the three-dimensional motions of the interacting galaxies with respect to the group IGM (see, e.g. Merrifield 1998; Vikhlinin et al. 2001; Machacek et al. 2005a, 2005b). X-ray observations also help identify nuclear activity and hot gas flows that might trigger or quench subsequent star formation.
The Pavo galaxy group is an important nearby laboratory to study the evolution of galaxies within their group environment, because it shares many properties with the high redshift galaxy groups found in the DEEP2 galaxy survey. Like those galaxy groups, the Pavo group is moderately massive with a velocity dispersion, derived from its member galaxies, of km s-1 , and contains a gas-rich spiral galaxy (NGC 6872) interacting with its environment. Yet, at Mpc, the Pavo group is close enough for star-forming clumps with typical separations of kpc (Elmegreen & Efremov 1996) to be resolved in Chandra X-ray and Spitzer mid-infrared images, as well as in the optical bands.
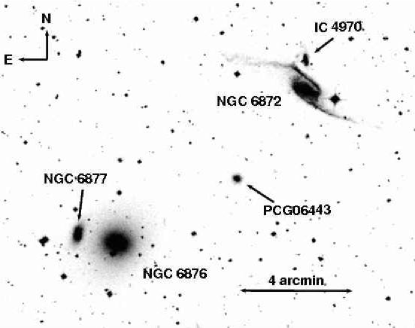
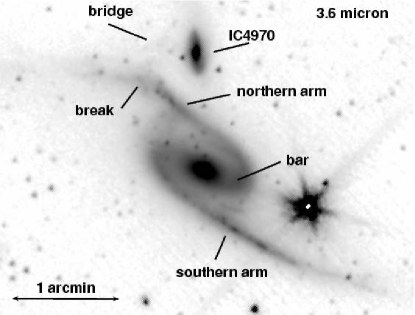
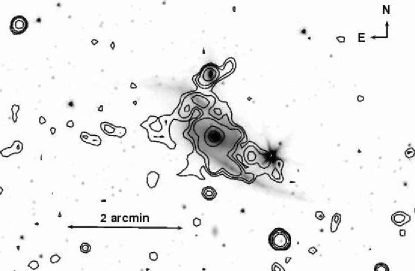
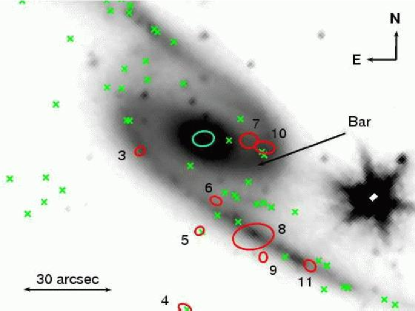
The Pavo group is dynamically young. It hosts a variety of galaxy and group interactions expected to be important at high redshift. In Figure 1 we show a Bj band image of the two brightest galaxies in the Pavo group: the elliptical galaxy NGC 6876 at the center of the group and the large, tidally distorted SAB(rs)c spiral galaxy NGC 6872 located to the northwest. The large spiral galaxy, NGC 6872, and its spheroidal companion galaxy, IC 4970, located to the north near a break in NGC 6872’s northern tidal arm, have long been known to be a tidally interacting galaxy pair (Vorontsov-Velyaminov 1959), and are well-studied in the optical (Mihos et al. 1993; Bastian et al. 2005) and radio (Horellou & Booth 1997; Horellou & Koribalski 2003; 2007) wavebands. The stellar bridge pointing from the northern tidal arm of NGC 6872 to its less massive companion IC 4970 indicates the tidal interactions between these two galaxies are ongoing. The km s-1 radial velocity difference111Line-of-sight velocities and redshifts are taken from the CfA Redshift Survey by Martimbeau & Huchra. Online versions of the catalog, supporting software, and documentation are available at http://cfa-www.harvard.edu/huchra/zcat. between NGC 6872 and IC 4970 suggest that these galaxies form a spiral dominated subgroup. XMM-Newton X-ray observations revealed a kpc long X-ray trail of hot ( keV) gas linking, in projection, NGC 6872/IC 4970 to NGC 6876, the dominant Pavo group elliptical galaxy. The properties of the X-ray gas in the trail, coupled with the large km s-1 radial velocity difference between NGC 6872 and NGC 6876, provide dramatic evidence for the highly supersonic passage of the NGC 6872/IC 4970 subgroup through the dense keV IGM gas in the Pavo group core (Machacek et al. 2005b). Although difficult to identify today, such interactions would likely have been frequent at high redshift, when galaxy groups and clusters were forming at the intersections of large scale filaments.
The dominant elliptical galaxy, NGC 6876, also shows evidence for recent interactions. Hubble Space Telescope observations of the inner of NGC 6876 show a depressed central surface brightness distribution surrounded by a stellar torus, suggesting the presence of a binary black hole from a previous merger (Lauer et al. 2002). The companion elliptical galaxy, NGC 6877, ( to the east with radial velocity difference of km s-1 ) may be in an early premerger phase with NGC 6876.
Important questions concerning the evolution of galaxies in the galaxy group environment remain poorly understood. Among these are :
-
1.
How do galaxy interactions influence nuclear activity and black hole growth in interacting galaxies in galaxy groups?
-
2.
What are the patterns of star formation in interacting galaxies?
-
3.
How do we observationally constrain the kinematics of galaxy-group interactions, such as the high velocity passage of NGC 6872 past NGC 6876 in the Pavo group core, and how do these interactions influence the hydrodynamical state of both the group IGM and the hot X-ray emitting gas in the galaxies?
In a series of three papers we address these questions for the dominant interacting galaxies in the Pavo group. In a previous paper, we used Spitzer mid-infrared and Chandra X-ray images to analyze the role of the IC 4970/NGC 6872 collision on the nuclear activity in the less massive galaxy, IC 4970, arguing that it hosts a highly-obscured active galactic nucleus (AGN) fueled by cold gas driven into the nucleus by the interaction (Machacek et al. 2008a). In the current paper, we analyze Spitzer mid-infrared observations of the dominant Pavo group galaxies, NGC 6876 and NGC 6872, and Chandra observations of bright X-ray point sources found associated with the spiral galaxy NGC 6872, to investigate the impact of galaxy interactions on star formation in these systems. The detailed analysis of our Chandra observations of diffuse gas in and around these galaxies, that probes the impact of high velocity group-galaxy interactions on the hydrodynamical state and evolution of the Pavo group IGM, will be reported in a forthcoming paper (Machacek et al. 2008b, in preparation).
This paper is organized as follows: In §2 we briefly review the observations and our data reduction and processing procedures. In §3 we present our IRAC mid-infrared results, constructing flux density and nonstellar emission images of the NGC 6876/NGC 6877 and NGC 6872/IC 4970 galaxy pairs in the Pavo group, along with IRAC band color maps of the more strongly interacting galaxy pair, NGC 6872/IC 4970. In §4 we compare the properties of the X-ray point source population with the distribution of star forming regions identified in §3 and with existing optical observations of young star clusters and radio observations of the distribution of HI gas. We also comment on the relationship of extended X-ray emission, observed with Chandra in NGC 6872, with these star formation tracers in other wavebands. We briefly summarize our findings in §5.
Unless otherwise indicated, uncertainties correspond to confidence levels on spectral parameters and uncertainties on X-ray counts and count rates. WCS coordinates are J2000. Adopting a CDM cosmology with km s-1 Mpc-1 and from the three year WMAP results (Spergel et al. 2006) and taking the redshift of the central group elliptical galaxy NGC 6876 () as representative of the redshift of the Pavo group, we find a luminosity distance of Mpc for galaxies in the Pavo group core. One arc second corresponds to a distance of kpc.
2. Observations and Data Reduction
Our mid-infrared results are based on the analysis of a s observation of NGC 6876 and NGC 6872 (Spitzer PID 20440) taken on 2005 September 18 in the , , , and wavebands using the IRAC camera on board the Spitzer Space Telescope. We used two IRAC pointings, one with aim point centered on the dominant Pavo group elliptical galaxy NGC 6876 (, , NED) and the other centered on the spiral galaxy NGC 6872 (, , NED). For a detailed discussion of our mid-infrared data reduction and mosaicing procedures, please see Machacek et al. (2008a). We obtained good coverage with Basic Calibrated Data (BCD) frames in all IRAC wavebands in and near the bright galaxies, NGC 6876 and NGC 6872. However, coverage of the region midway between NGC 6876 and NGC 6872 was sparse ( BCD frames). The BCD frames were super-boresight corrected and registered on the same sky grid, such that astrometric uncertainties were .
Our X-ray data are from a ks observation, taken in two segments on 2005 December 14-15 (OBSID 7248) and 2005 December 16-17 (OBSID 7059) with the Advanced CCD Imaging Spectrometer Imaging Array (ACIS-I; Garmire et al. 1992; Bautz et al. 1998) on board the Chandra X-ray Observatory. A detailed discussion of these Chandra X-ray observations, X-ray backgrounds and our data cleaning procedures, that resulted in useful exposure times of s and s for OBSID 7248 and OBSID 7059, respectively, are also reported in Machacek et al. (2008a).
Point sources were identified in four X-ray energy bands, i.e. soft ( keV), medium ( keV), hard ( keV), and broad keV energy bands, using both CIAO tool wavdetect with a significance threshold of and a multiscale wavelet decomposition algorithm (wvdecomp) with detection threshold. We found no significant differences between the two methods. In addition to X-ray emission from the central regions of the galaxies NGC 6876, NGC 6877, NGC 6872, IC 4970, and PGC 06443 (shown in Fig. 1), we find X-ray point sources to a keV flux limit of erg s-1 cm-2 in a field of view. We further checked our X-ray source identification algorithms by comparing the number of sources we detect to this flux limit with that expected from the Cosmic X-ray Background. We detect X-ray sources in a radius circle chosen on the ACIS-I field of view to exclude known galactic sources, in excellent agreement with the Cosmic X-ray Background sources expected in this region to this flux limit (Brandt et al. 2001).
Both segments of our Chandra observation (OBSID 7248 and OBSID 7059) placed the ACIS-I aimpoint near the spiral galaxy NGC 6872 to achieve optimal angular resolution close to the spiral galaxy, where effects of NGC 6872’s interactions are expected to be most prominent. However, this placed both the elliptical galaxies NGC 6876 and NGC 6877 off axis, close to the edge of the I3 CCD, where the mirror point spread function broadens and encircled energy radii become azimuthally asymmetric. Thus X-ray point sources, such as low-mass X-ray binaries that may be associated with NGC 6876 or NGC 6877 are difficult to distinguish from the elliptical galaxies’ hot diffuse X-ray gas halos. We found no additional X-ray point sources associated with either NGC 6877 or NGC 6868. Therefore, in this paper (§4), we discuss only the properties of the point sources likely associated with the spiral galaxy NGC 6872. The properties of the active nucleus and near-nuclear point source in IC 4970 (NGC 6872’s companion galaxy) are the subject of Machacek et al. (2008a).
We compare our Spitzer mid-infrared and Chandra X-ray results with existing HI (Horellou & Koribalski 2007), VLT B-band (Bastian et al. 2005), and H (Mihos et al. 1993) observations from the literature.
3. Pavo Galaxies Viewed in the Mid-Infrared
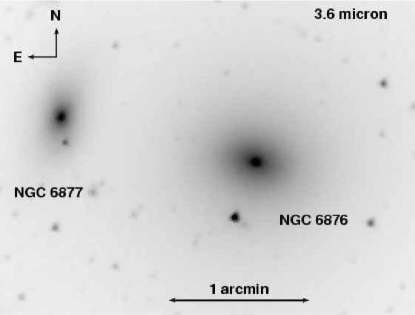
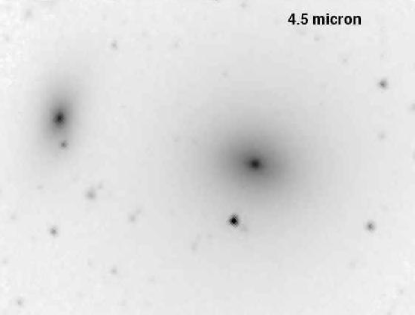
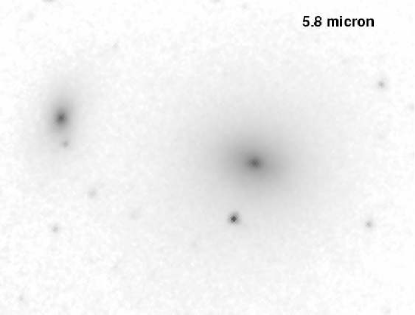
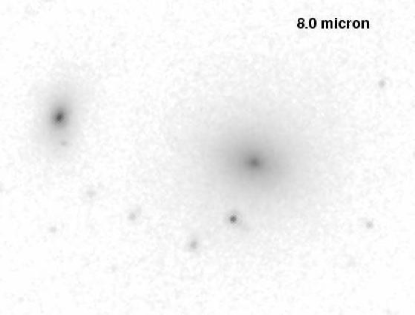
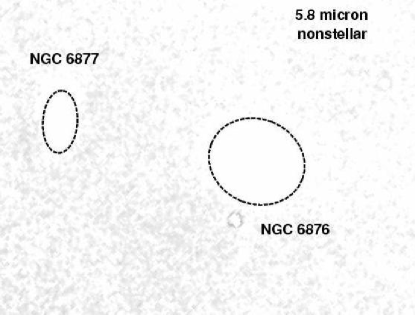
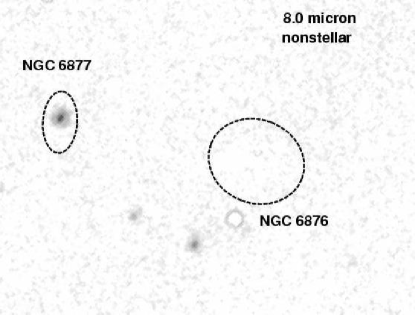
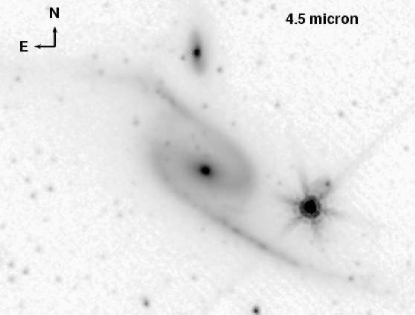
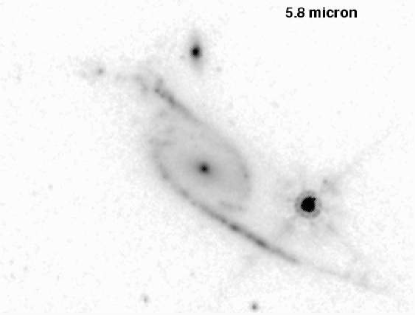
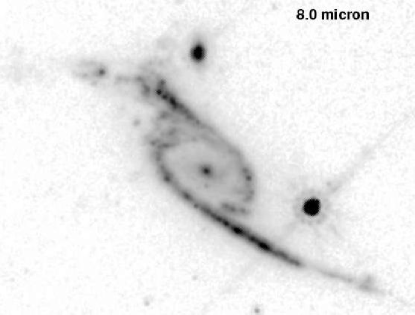
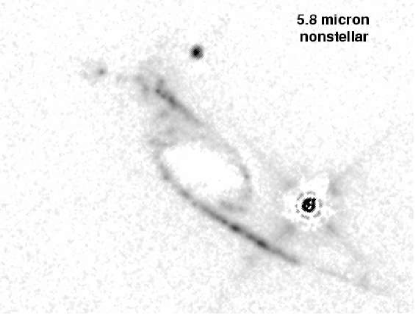
In Figures 2 and 3 we present background-subtracted mosaics of the dominant Pavo group galaxy pairs NGC 6876/NGC 6877 and NGC 6872/IC 4970, respectively, in the four IRAC wavebands. The and wavebands (upper panels) are dominated by light from an old population of stars. Emission in the and bands is more complicated, containing possible contributions from PAHs and dust in young star-forming regions, silicates ejected from the outer atmospheres of AGB stars, or AGN accretion disks, as well as starlight. We separate the nonstellar from the stellar components at these wavelengths following the method of Pahre et al. (2004). Specifically, a model for the and stellar emission is constructed by averaging background-subtracted and flux density mosaics that have first been aperture corrected, using the IRAC extended (infinite) aperture corrections provided by the Spitzer Science Center 222 http://ssc.spitzer.caltech.edu/irac/calib/extcal/, and then scaled to the appropriate waveband ( or ) using the approximate mid-infrared colors of an M0 III star (, , ). This stellar model is then subtracted from the background-subtracted, aperture-corrected, observed and mosaics to produce the nonstellar emission maps, shown in the lower panels of Figures 2 and 3. Below we discuss our mid-infrared results for elliptical galaxies NGC 6876 and NGC 6877 (§3.1) and spiral galaxy NGC 6872 (§3.2). The mid-infrared results for NGC 6872’s companion galaxy IC 4970 were presented in Machacek et al. (2008a) and will not be repeated here.
3.1. Dust in Elliptical Galaxies NGC 6876 and NGC 6877
3.1.1 Mid-infrared Morphology
Figure 2 shows that the surface brightness distributions in all four IRAC wavebands are similar for NGC 6876 and for NGC 6877. For NGC 6876, we find no evidence in the and surface brightness maps for dust features that deviate from the stellar light distribution in the elliptical galaxy. We present the nonstellar emission maps for NGC 6876 and NGC 6877 in the lower panels of Figure 2. Nonstellar emission is seen in the central region of the nearby elliptical galaxy NGC 6877, but the apparent lack of nonstellar emission in NGC 6876 is striking. However, this result should be interpreted with care, because IRAC aperture corrections for the and wavebands are strongly dependent on the size of the emission region and use of the limiting (large scale) aperture correction may underestimate the true flux by as much as in these wavebands, if the emission is concentrated in smaller regions. Conservatively, the nonstellar emission maps for NGC 6876 (lower panels of Fig. 2) suggest that dust emission, if present in the dominant group galaxy, is weak and likely follows the galaxy’s distribution of highly evolved stars.
3.1.2 Mid-infrared Photometry
We used fixed-aperture photometry in each IRAC waveband to investigate the possibility of dust emission in the elliptical galaxies NGC 6876 and NGC 6877 more quantitatively. Our results and a complete description of the source and background apertures used in the analysis are summarized in Table 1 for NGC 6876 and Table 2 for its companion elliptical galaxy NGC 6877. The mid-infrared colors for both galaxies are listed in Table 3. We define apertures for each galaxy as a whole (labeled ‘Full’ in Tables 1 and 2), based on the respective MJy sr-1 surface brightness contours in the emission map (upper left panel of Fig. 2). The background regions were taken to be concentric elliptical annuli immediately outside the source regions. Contaminating point sources, identified in the map, were excised from both the source and background maps for each waveband.
The measured integrated flux densities for the ‘Full’ regions were aperture corrected using correction factors for each aperture’s effective circular radius ( and for NGC 6876 and NGC 6877, respectively) calculated from fits to the IRAC extended source calibration curves supplied by the Spitzer Science Center333http://ssc.spitzer.caltech.edu/irac/calib/extcal/. Nonstellar emission, when present in elliptical galaxies, is often centrally concentrated (Pahre et al. 2004), and may be masked by the more dominant stellar emission when averaged over the whole galaxy. For example, when averaged over the full galaxy, neither the nor the nonstellar flux densities, listed in Table 1 for NGC 6876 are greater than the uncertainties. We thus use circular apertures with radii of and (labeled ‘Center’ in Tables 1 and 2) to measure the mid-infrared flux densities in the central regions of NGC 6876 and NGC 6877, respectively. For such small apertures (i.e. radii ), point source aperture corrections appropriate for the chosen aperture size (IRAC Data Handbook version 3.0)444http://ssc.spitzer.caltech.edu/irac/dh/ were applied to the background-subtracted integrated flux densities to compute the ‘true’ flux densities. Corresponding magnitudes for all cases were calculated using the Vega relative zeropoint magnitudes from Reach et al. (2005).
The mid-infrared colors for NGC 6876, as a whole, are broadly consistent with the mid-infrared colors for an old (M0-K0) population of stars, as expected. However, our results for the and integrated flux densitites from the ‘Full’ aperture are lower than those previously reported for NGC 6876 in nearby wavebands by Ferrari et al. (2002) using observations from the Infrared Space Observatory (ISO). To check whether this discrepancy is due to differences in the chosen apertures and/or the presence of point sources, excluded from our analysis, that were unresolved in the ISO data, we measured the total integrated and fluxes in a square aperture centered on NGC 6876 (based on the ISO field of view), without excising point sources, and with aperture corrections appropriate for the aperture effective radius. At we find an integrated flux for this larger region of mJy, in good agreement with the mJy observed at by Ferrari et al. , given the calibration uncertainties in the ISO data. However, for we find an integrated flux in this larger aperture of mJy, still a factor below the mJy measured by Ferrari and collaborators in the waveband. This may be further evidence, as suggested by Ferrari et al. (2002), that the excess emission at is due to warm silicate grains from the atmospheres of old AGB stars, and not PAH emission from young star forming regions. Such an interpretation would be consistent with results for elliptical galaxies in richer environments, such as the Virgo cluster, where of the early type galaxies studied by Bressan et al. (2006; 2008) with ISO mid-infrared spectroscopy showed silicate emission.
While the and colors for the central region of NGC 6876 (labeled ‘Center’ in Table 3) are again broadly consistent with an old population of stars, the color is redder than expected. However, after subtracting our stellar model to isolate the nonstellar contribution to these central flux densities, we do not find a statistically significant () contribution to the flux from nonstellar emission in the band, and find only a weak () contribution from nonstellar emission in the band. This is again consistent with the interpretation that the excess flux is due to leakage from the broad emission feature expected for warm silicate dust grains into the bandpass. In normal star-forming galaxies the star formation rate is correlated with the emission from warm dust by the expression (Wu et al. 2005)
| (1) |
Using Equation 1, we find an upper limit on star formation in NGC 6876 of .
Figure 2 does show nonstellar emission in the central region of NGC 6877, the companion galaxy to NGC 6876. In particular, the color for NGC 6877 (expected to be close to zero for old stars) is , too red to be caused by any stellar population (Pahre et al. 2004). After subtracting the contribution from our stellar model, we find that nonstellar emission contributes () of the () flux densities, respectively, in the central region of NGC 6877. The nonstellar color of in the central region is similar to the nonstellar colors () found in star-forming regions in M81 (Willner et al. 2004) and in dusty E/S0 galaxies (Pahre et al. 2004) and is consistent with that expected from PAH molecules and dust in star-forming regions (Li & Draine 2001). However, the observed (stellar plus nonstellar) and colors for the central region of NGC 6877 place the galaxy close to normal S0/Sa galaxies in the color-color diagram of Stern et al. (2005), such as for NGC 4429 in which star formation rates are low. Using the nonstellar flux density for NGC 6877 in Equation 1, we estimate a star formation rate of . Thus, as in NGC 4429, star formation in the central region of NGC 6877, while likely present, is weak.
3.2. Star Formation in Spiral Galaxy NGC 6872
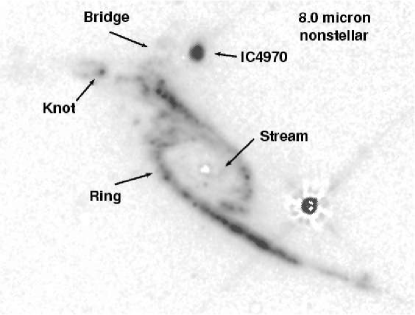
From Figure 3 we see that the surface brightness distribution in the and wavebands, that trace the distribution of starlight in NGC 6872, are very different from the and surface brightness maps of the large spiral galaxy. The and maps (upper panels) show a bright nucleus, clear bar and two tidally distorted spiral arms, similar to the Bj-band image shown in Figure 1. In contrast, the and emission in the spiral galaxy NGC 6872 (middle panels) is concentrated in an outer ring and along both tidal tails. As shown in the lower panels of Figure 3, these longer wavelength bands are dominated by nonstellar emission. This nonstellar emission tends to be clumpy, with clump sizes ranging from those unresolved by IRAC, i.e kpc in diameter, to complexes kpc across. Along the northern tidal arm, bright nonstellar emission is found concentrated between the ring and the break in the arm, along the bridge connecting the break to the companion galaxy IC 4970, in a bright two-tailed knot east of the break, and in faint patches extending out to the full extent of the northern tidally distorted stellar tail (see also Fig. 7). Nonstellar emission is found in the southern tidal arm in bright kpc long beads west of the ring and again in fainter patches out to the end of the southern tidal tail. Since the same emission features that are seen in the nonstellar map of NGC 6872 also appear in the corresponding map (albeit with lower signal to noise), the observed flux is likely the result of PAH and dust emission from young, dust-enshrouded star-forming regions in the spiral galaxy.
3.2.1 Mid-infrared Colors of the Spiral Arms and Tidal Features
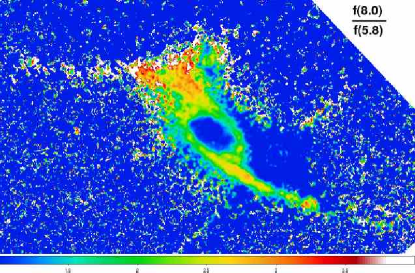
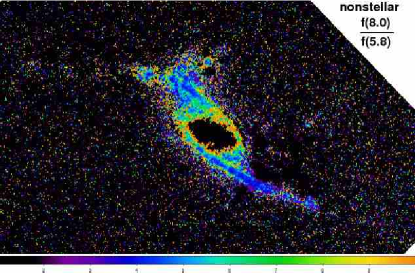
We test the hypothesis that the observed nonstellar emission is from PAH molecules and warm dust by using mid-infrared color maps to study the properties of the mid-infrared emission throughout the spiral galaxy and its tidal features. We show three representative color maps in Figure 4. The background-subtracted mosaics in each waveband were cross-convolved with a Gaussian representation of the IRAC point spread function in the other waveband before division to mitigate light scattering effects. We estimated the uncertainties in the color maps by comparing the colors of NGC 6872’s nucleus obtained directly from the color maps to those calculated from the flux densities measured by fixed aperture photometry in §3.2.2 and find that the flux ratios (colors) obtained from Figure 4 differ from those obtained from fixed aperture photometry by ( mag), comparable to the calibration uncertainties () for these wavebands.
In the central region and along the bar of the spiral galaxy, the to flux density ratio is to , corresponding to colors of to , respectively. These colors are consistent with that expected for an old population of stars. The bright nonstellar emission regions, that are particularly visible in the southern arm of NGC 6872 in the lower right panel of Figure 3 and in Figure 4, have , lower than elsewhere in the galaxy. The corresponding color () is in agreement with the colors of star-forming clumps in the spiral and tidal bridge of NGC 2536 (Hancock et al. 2007). Depressed flux ratios were also found by Elmegreen et al. (2006) in star-forming clumps in the NGC 2207/IC 2163 interacting galaxy pair. They suggested that the low ratio may be due to an excess of H Br emission at caused by the ionization of gas by hot, bright stars inside the star-forming clumps, such as found in RCW 49, one of the most luminous HII regions in the Milky Way (Whitney et al. 2004).
The flux ratio ( color) for NGC 6872 provides a measure of the relative number of young to old stars in the region (Smith et al. 2005a). This flux ratio (color) increases (reddens) from ( mag) in the central region of the galaxy, consistent with an old population of stars, to ( mag) in the outer ring, indicating a younger stellar population and/or more interstellar dust. The bright nonstellar emission regions are redder still, with () for clumps embedded in the tidal arms and bridge, and () in the bright knot east of the break in the northern arm. These colors are consistent with those found in star-forming regions in other interacting galaxies (Smith et al. 2005; Hancock et al. 2007; Elmegreen et al. 2006).
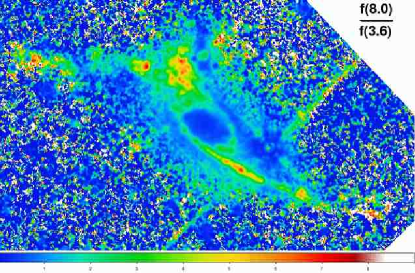
The flux ratio ( color), shown in the upper panel of Figure 4, provides a measure of the star formation rate per unit stellar mass throughout the galaxy. The flux ratios in the southern tidal arm and bridge () and in the bright nonstellar emission knot in the northern tidal arm east of the bridge () are a factor higher than that found at the center of NGC 6872 (see Table 5). These flux density ratios correspond to colors of , and , respectively, approaching the theoretical prediction of for interstellar dust (Li & Draine 2001), and lie at the upper end of the distribution for colors in tidal features and M51-like disks observed in the SSB&T sample (Smith et al. 2007).
The flux ratio ( color), shown in the middle panel of Figure 4, probes the properties of the emitting dust. In the southern tidal arm, in the northern tidal arm near the break and in the bridge, where there is good signal-to-noise, we find () similar to that observed in other interacting systems (see, e.g., the Antennae galaxies NGC 4038/NGC 4039, Wang et al. 2004; NGC 2536, Hancock et al. 2007; NGC 2207/IC 2163, Elmegreen et al. 2006; Arp 107, Smith et al. 2005a; and M51-like disks and tidal features in the SSB&T sample, Smith et al. 2007). Once the stellar component is removed (see the lower panel of Fig. 4), the color of the nonstellar emission in these regions is , in excellent agreement with the theoretical prediction of for pure PAH emission (Li & Draine 2001).
Taken together these maps show a consistent picture of PAH and warm dust emission from interaction induced star formation occuring in clumps or knots extending out to kpc from the nucleus to the northeast and southwest along the tidal tails, but avoiding the nucleus and central kpc of NGC 6872. Regions of intense star formation, with mid-infrared colors similar to those observed in other interacting galaxies, are found both in the northern arm and bridge, near the ongoing interaction with IC 4970, and in the southern tidal arm, on the side of NGC 6872 farthest from the present interaction. These features are strongly correlated with H emission in NGC 6872 and, like the H emission, are bright where the stellar velocity dispersion is high, further evidence that star formation in this system is collisionally induced (Mihos 1993). We see no strong differences in the mid-infrared colors of the star-forming regions in NGC 6872 as a function of their position relative to the companion galaxy IC 4970.
3.2.2 No Star Formation in NGC 6872’s Nuclear Region?
Although strong nonstellar emission is found in the nuclear region of the companion galaxy, IC 4970, consistent with the presence of a highly obscured AGN (Machacek et al. 2008a), nonstellar emission from the nucleus of the primary galaxy in the collision, NGC 6872, is weak. From the color maps in Figure 4 we see that, in the central region of NGC 6872, the flux ratio () and corresponding color () are modestly higher than expected for a population of old stars. As in §3.1 we use fixed aperture point source photometry of NGC 6872’s nucleus using a circular source aperture centered at the peak of the emission (, , J2000) with a concentric background annulus with inner (outer) radii of (), respectively, to measure the fluxes and colors of NGC 6872’s nucleus and isolate any possible contribution from dust. Our results for the fluxes are presented in Table 4. In Table 5 we list our photometric results for the mid-infrared flux ratios and colors of NGC 6872’s nuclear region and compare them to the flux ratios and colors obtained from the color maps in Figure 4. We find excellent agreement between the colors determined by the two methods. The mid-infrared colors fall in the region of the color-color diagrams of Lacy et al. (2004) and Stern et al. (2005) populated by normal (nonactive) galaxies that are dominated by starlight. The and colors for the nuclear region of NGC 6872 are consistent with those expected for an old population of stars. The color () is modestly higher suggesting the presence of dust. Subtracting a stellar model (as in §3.1), we find that the remaining nonstellar component contributes ( mJy) of the total emission in the band, i.e. consistent with zero within calibration uncertainties, and ( mJy) of the total emission in the band. If, instead, we model the distribution of stars using the data alone, the nonstellar contribution at increases modestly to , while the nonstellar contribution at is not significantly changed. From Equation 1, we find an upper limit to the star formation rate in the central kpc of NGC 6872 of .
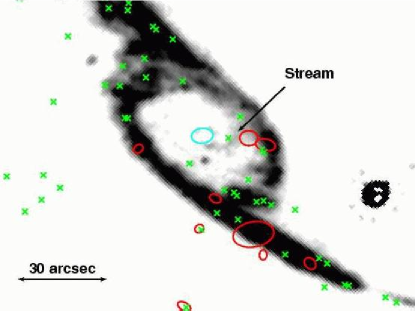
In both the total and nonstellar emission maps of Figure 3, we find a faint stream of mid-infrared emission winding kpc () from the northwest edge of NGC 6872’s ring south to the spiral galaxy’s central bar and along the bar to NGC 6872’s nucleus (see also Fig. 6). In the nonstellar emission map, the surface brightness of the stream is a factor larger than that found elsewhere in NGC 6872’s central region. There is no statistically significant evidence for the stream feature in either the total emission or nonstellar emission maps, where emission instead follows the stellar bar. The stream may be interstellar gas and dust that is being funneled into NGC 6872’s nuclear region by the bar.
Numerical simulations of interacting galaxies often predict that gas and/or dust will be driven into the inner disk of the more massive galaxy, possibly inducing a circumnuclear starburst (see, e.g. Noguchi 1988, Hernquist & Mihos 1995, Mihos & Hernquist 1996). Simulations of the NGC 6872/IC 4970 interaction, in isolation from its group environment, predict a central concentration of dense gas in the spiral galaxy (Mihos et al. 1993; Horellou & Koribalski 2007) and of molecular gas is observed in CO observations of the central of the galaxy (Horellou & Booth 1997). Our Spitzer observations show that, despite the concentration of molecular hydrogen at the center and the stream of interstellar matter observed in leading from the ring to the nucleus, there is little photometric evidence for PAH or warm dust emission from recent star formation in the nuclear region of NGC 6872. This is in agreement with the H intensity maps of the central region of NGC 6872 by Mihos et al. (1993), that also indicated little evidence for recent nuclear or circumnuclear star formation. However, the stream may signal the transport of interstellar matter into the nuclear region, as predicted by simulations, and may be a prelude to a future episode of nuclear star formation or AGN activity in the primary galaxy.
4. X-ray Comparisons to Mid-Infrared, Optical and HI in NGC 6872
4.1. X-ray Point Sources
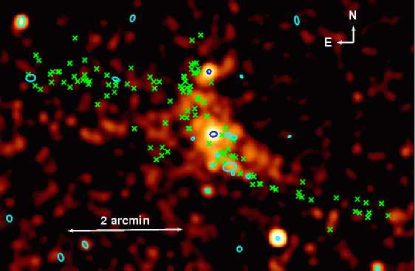
Detailed studies of nearby normal spiral galaxies, e.g. the Milky Way (Sazonov et al. 2006; Revnivtsev et al. 2006) and M31 (Li & Wang 2007; Bogdan & Gilfanov 2008), indicate that the X-ray emission from spiral galaxies is strongly correlated with their stellar populations, and is dominated by the integrated emission from resolved and unresolved point sources. In the upper left panel of Figure 5, we superpose contours from a background-subtracted, exposure-corrected keV Chandra X-ray image of the NGC 6872/IC 4970 interacting pair, after smoothing with a Gaussian kernel, on the IRAC mosaic tracing the population of old stars. In addition to emission from the nucleus, X-ray emission is found correlated with the stellar map along the central stellar bar, in the southern spiral arm, and in the northern spiral arm before the break. In the central region of the galaxy, the X-ray emission is most likely the integrated emission from old stars, including coronally active low mass binaries, cataclysmic variable stars, and white dwarf accretors at the faint end of the X-ray luminosity function, as well as the more luminous neutron star and black hole binaries (LMXB’s). X-ray emission from regions in the spiral arms may also have contributions from young stellar objects, young stars, and high mass X-ray binaries (HMXB’s) associated with ongoing star formation.
In Table 6 we list the positions, observed X-ray source counts from the combined ks Chandra observation, and intrinsic k̇eV luminosities for NGC 6872’s nucleus (N) and X-ray point sources, in and near the spiral galaxy. We expect only cosmic X-ray background source in a rectangular region containing the main portion of NGC 6872 (Brandt et al. 2001), confirming that the X-ray sources listed in Table 6 are most likely associated with the spiral galaxy. X-ray colors for these sources using the keV (S), keV (M), and keV energy bands are also listed in Table 6 for completeness. However, since the uncertainties in these colors are large due to the low count rates in each band, we adopt a standard power law spectral model with photon index , representative for luminous X-ray point sources in galaxies (Colbert et al. 2004; Swartz et al. 2004), and Galactic hydrogen absorption ( cm-2 ) to calculate the intrinsic luminosities for these sources. Guided by the X-ray evidence for NGC 6872’s recent passage through the Pavo group core (Machacek et al. 2005), we adopt Mpc, the luminosity distance to the central Pavo group galaxy NGC 6876, as the luminosity distance to NGC 6872. The keV luminosities of these sources, other than the nucleus of NGC 6872, range from erg s-1 to erg s-1 , spanning the luminosities characteristic of the bright end of the HMXB luminosity function to those associated with ultra-luminous X-ray sources (ULXs). These X-ray sources are typical of bright X-ray sources in other systems, where the number and luminosity of ultra-luminous X-ray sources are found to be correlated with galaxy interactions, mergers, and recent star formation (Swartz et al. 2004).
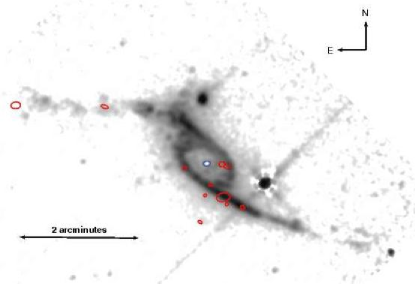
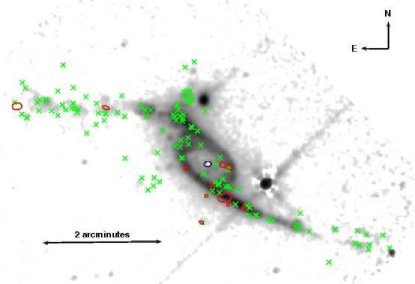
In the upper right panel of Figure 5, we overlay the wavdetect elliptical source regions (Detect Reference Manual)555 http://cxc.harvard.edu/ciao4.0/download/doc/detect_manual/wav_ref.html for these X-ray sources on the IRAC nonstellar emission map of NGC 6872/IC 4970. The image has been smoothed with a kernel to highlight the faint nonstellar emission extending to the ends of NGC 6872’s tidal tails. X-ray sources other than the nucleus are found in or near star-forming regions mapped by the nonstellar (PAH and dust) emission. Since we have neglected intrinsic absorption, which may be significant in dusty star-forming regions, the X-ray luminosities, given in Table 6, should be considered lower limits on the true intrinsic X-ray luminosities of these sources. In the lower left panel of Figure 5 we add the locations of young star clusters (green X’s) in NGC 6872 (Bastian et al. 2005) to the nonstellar image. Throughout the following discussion, all star cluster identification numbers, ages and masses are from Bastian et al. (2005). Please see Bastian et al. (2005) for the full U, B, V, and I photometric results for these clusters and a complete discussion of the star cluster age and mass modeling. In the lower right panel of Figure 5, we add cm emission contours from Horellou & Koribalski (2007), that map the distribution of atomic hydrogen in the galaxy. The star clusters follow closely the distribution of nonstellar emission. This correspondence with nonstellar emission extends to the very ends of both the northern and southern tidal tails. For example, a very young star cluster (no. ), with an age of only Myr and mass of coincides with the bright emission knot found kpc from the nucleus of NGC 6872 just east of the break in the northern tidal tail (see the lower right panel of Fig. 3), and three young ( Myr) clusters (no. , , and ) coincide with the nonstellar emission double knot, kpc from the center of the spiral galaxy in the southern tidal tail. Star clusters are also found in faint nonstellar emission clumps trailing the galaxy to the southeast. The concentration of five star clusters (nos. , , , , and ) located kpc southeast from NGC 6872’s center, as shown in the lower left panel of Figure 5, have low to moderate masses () and are also very young, with ages between to Myr. These latter star clusters may have formed from cooled gas, stripped from NGC 6872 by tidal and turbulent-viscous forces caused by the collision of IC 4970 with the spiral galaxy coupled with the high velocity passage of the NGC 6872/IC 4970 galaxy pair through the Pavo group core, and may ultimately contribute to the Pavo intragroup stellar light. Young star clusters are also highly concentrated along the bridge of nonstellar emission extending from the break in the northern arm to the companion galaxy IC 4970. All but a handful of young star clusters, as well as the bright X-ray sources and nonstellar emission, coincide with regions rich in cold HI gas. This spatial distribution of star-forming regions and young clusters along NGC 6872’s tidal tails and bridge connecting IC 4970 to NGC 6872 strongly suggests that star formation has been influenced, if not triggered, by the galaxies’ interactions, and that the star clusters have only recently emerged from their dusty stellar nurseries.
It is interesting to note, however, that, unlike the young star clusters, the bright X-ray sources do not uniformly follow the nonstellar distribution. While two X-ray sources are found in the northern tidal arm east of the break (X-ray source at the eastern tip of the arm and X-ray source in the middle), most of the bright X-ray sources are clustered to the south in NGC 6872, and are seen to avoid the highly disrupted bridge region close to the interacting companion IC 4970, despite the high concentration of young star clusters and strong nonstellar emission there. As shown in Figure 6, five X-ray sources (no. , , , , and ) are found in the southern spiral arm and tidal tail. Three of these X-ray sources (no. , and ) are coincident or nearly coincident with the brightest nonstellar emission clumps in the southern arm, and may be multiple X-ray sources associated with these compact star-forming regions.
X-ray sources and trail the southern arm of NGC 6872 by kpc () and kpc (), respectively, and are the only two X-ray sources coincident with optically identified sources (star clusters and , respectively) from Bastian et al. (2005). If these optical sources are star clusters associated with the galaxy, and not foreground stars or background AGN, the X-ray luminosities ( erg s-1 and erg s-1 , respectively) of their associated X-ray sources are high, characteristic of ultra-luminous X-ray sources. In Table 7, we list the V and B band absolute magnitudes, internal extinction factors, cluster masses and ages from Bastian et al. (2005) for the two star clusters coincident with the bright X-ray sources and . These two young, moderately massive star clusters , i.e. with ages Myr, and masses , are similar in age and mass to star clusters found throughout the tidal tails and outer parts of NGC 6872, and in the interaction region between NGC 6872 and IC 4970 (Bastian et al. 2005).
X-ray-to-optical flux ratios have long been used to gain insight into the nature of X-ray emitting sources that have possible optical counterparts. (see, e.g. Bradt & McClintock 1983; Maccacaro et al. 1988; Stocke et al. 1991; Hornschemeier et al. 2001 ). In Table 8 we present three measures of the relative X-ray to optical emission between the two ultra-luminous X-ray sources ( and ) and their optical hosts (star clusters and , respectively). They are as follows:
-
1.
the V-band X-ray-to-optical flux ratio (Maccacaro et al. 1982), given by
(2) where is the keV X-ray flux (in erg s-1 cm-2 ) and is the extinction-corrected V-band magnitude,
-
2.
the B-band X-ray-to-optical flux ratio (van Paradisj & McClintock 1995), defined as
(3) where is the extinction corrected B magnitude and is the keV X-ray flux averaged over the keV energy band (in Jy), and
-
3.
the V-band to keV two point spectral index, assuming a flux density of the form .
We use a power law spectral model with photon index and Galactic absorption to convert the observed X-ray count rates to X-ray flux in the appropriate energy bands. From Table 8 we see that the V-band X-ray-to-optical ratio (XOR ) for X-ray source is larger than expected () for any population of foreground stars, and, although XOR for X-ray source is compatible with the upper end of the M star range for this ratio, the extinction corrected (B-V)0 color of for that source is too blue to be an M star (Stocke et al. 1991) . Thus neither source is a foreground star. The V-band X-ray-to-optical ratios for the optical counterparts of X-ray sources and lie in the range ( to ) observed for luminous young star clusters hosting ULXs in NGC 4038/NGC 4039 (Zezas et al. 2002) and NGC 7714/NGC 7715 (Smith et al. 2005b). Similarly, the V-band absolute magnitude () of star cluster (associated with X-ray source ) is similar to the absolute V magnitude () of the near-nuclear young star cluster hosting a bright X-ray source in interacting galaxy NGC 7714 (Smith et al. 2005b), and the absolute V magnitude () of star cluster (associated with X-ray source ) is comparable to absolute V magnitudes ( to ) of star clusters associated with ULXs in NGC 4038/NGC 4039 (Zezas et al. 2002). Also the V-I colors for star clusters and are blue, and , respectively (Bastian et al. 2005), similar to colors of star-forming dwarf galaxies in other nearby loose groups (Carrasco, de Oliveira & Infante 2006). The B-band X-ray-to-optical ratios ( and for sources and , respectively) are similar to those observed for HMXBs (van Paradijs & McClintock 1995). However, since stars or accreting binaries are optically too faint to be individually detected at the luminosity distance of NGC 6872, these B-band X-ray to optical ratios likely reflect the presence of HMXBs in and the young age of the X-ray sources’ star cluster hosts. Taken together, these properties suggest that X-ray sources and reside in young star-forming clusters associated with the interacting galaxy NGC 6872 in the Pavo group (Bastian et al. 2005). However, since the V-band X-ray-to-optical ratios and the two-point V-band to keV spectral indices are also consistent with those observed from AGN (Stocke et al. 1991, Landt et al. 2001), we can not rule out the possibility that one or both of these sources may be background AGN. Optical spectra and redshifts are needed to determine whether these X-ray sources are, indeed, ULXs associated with the NGC 6872/IC 4970 interacting galaxies in the Pavo group.
Two X-ray sources (sources and ) are found west of NGC 6872’s nucleus on the western edge of the ring just north of the stellar bar (see upper panel of Fig. 6). In the lower panel of Figure 6, we see that the two western X-ray sources lie at the base of the stream of interstellar matter, seen in nonstellar emission, that may be feeding the nucleus. Four star clusters (green X’s ) also are observed in this region: star cluster to the northwest at the inner edge of the ring, star clusters and displaced kpc from X-ray source , and star cluster in the bulge. The northwest and bulge star clusters trace the northern edge of the stream, while X-ray sources and and nearby star clusters lie at the stream’s southern base. The two star clusters close to X-ray source , as well as the star cluster located to the northwest just inside the emission ring, are more massive () and older ( Gyr) than most of the star clusters in the tidal features. However, the inner star cluster near the bulge on the northern edge of the stream is young ( Myr). Stellar winds and supernovae from these clusters, along with existing interstellar material and dust funneled to the center by the bar, may contribute to the warm dust and gas found in the stream.
4.2. Relationship of Diffuse X-ray Emission to Star Formation
The upper left panel of Figure 5 shows X-ray emission that deviates strongly from the underlying distribution of stars in NGC 6872. Diffuse X-rays in normal, non-interacting spiral galaxies are expected to arise from two principal sources: a soft ( keV) thermal component from winds of ionized gas ejected from evolved stars and Type Ia supernovae and a hard component from core collapse supernovae, associated with star-forming regions (Bogdan & Gilfanov 2008). Since these components are associated with outflows, they need not be correlated with the stellar distribution. For interacting spiral galaxies, gas may be stripped and/or heated by the interaction itself, and, especially when the interacting partner is an early type galaxy such as IC 4970, hot gas may be stripped from the hot halo of the interacting companion into the space between the galaxies and/or transferred onto the massive spiral galaxy. Thus the presence of diffuse hot gas with disturbed morphologies in the NGC 6872/IC 4970 interacting pair is not a surprise.
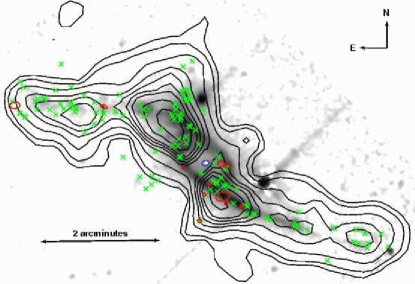
In the lower panel of Figure 7 we show the background subtracted, exposure corrected keV Chandra image of X-ray emission in the NGC 6872/IC 4970 interacting galaxy pair, after smoothing with a Gaussian kernel. As in Fig. 5 we overlay the positions of young star clusters as green X’s and X-ray point sources as ellipses. We see bright X-ray emission and a sharp surface brightness edge leading the stellar distribution and young star clusters in NGC 6872’s southern spiral arm. X-ray emission is truncated just west of the stellar tidal bridge leading from NGC 6872’s northern spiral arm to IC 4970, and then turns sharply in a bright kpc long filament to the southeast in the direction of NGC 6876. Faint diffuse emission is also seen extending kpc behind the galaxy to the southeast of NGC 6872’s nucleus. While young star clusters are strongly correlated with the nonstellar emission in NGC 6872 and trace the tidally distorted spiral arms and bridge to IC 4970 (see Fig. 5), they avoid the bright regions of hot diffuse X-ray gas, and are found instead bordering the diffuse X-ray emission in the X-ray filaments and the fainter patches of X-ray emission in the tidal arms and trailing NGC 6872 to the southeast. This suggests that star clusters formed in the tidal debris from gas, previously stripped by the interactions of the spiral galaxy with IC 4970 and the Pavo group, that has since cooled. These clusters may ultimately contribute to the Pavo group’s intergalactic stellar light.
In this paper we have limited our discussion of the diffuse X-ray gas to comparisons with star formation tracers in NGC 6872. However, the hot gas to the east in NGC 6872, is highly disturbed, bending sharply to the south, away from the eastern tidal tail, and extending to the southeast of NGC 6872’s stellar distribution until it merges into the X-ray trail (see Fig. 7 and Machacek et al. 2005). This disturbed morphology signals the importance of hydrodynamical forces, such as ram pressure or turbulent viscosity, that are caused by high velocity interactions between the galaxies and the ambient group IGM. These interactions act strongly on the diffuse hot galaxy gas, but are ineffective at disturbing the stars. We discuss the detailed thermodynamic properties of the hot gas in and around the dominant Pavo galaxies (NGC 6876 and NGC 6872), the signatures of the supersonic passage of NGC 6872 through the core of the Pavo group that are imprinted on that gas, and the impact of these galaxy-group interactions on the hydrodynamical state of the Pavo IGM in a forthcoming paper (Machacek et al. 2008b, in preparation).
5. Conclusions
The dominant galaxies in the Pavo galaxy group core, i.e. the large spiral galaxy NGC 6872, central group elliptical NGC 6876, and their companion galaxies IC 4970 and NGC 6877, provide an ideal nearby laboratory to study the combined effects of galaxy-galaxy tidal interactions and high velocity galaxy-IGM interactions on star formation and galaxy evolution. In this paper we present results from Spitzer mid-infrared observations of these galaxies in the , , , and IRAC bands, and Chandra X-ray observations of the X-ray point source population and hot gas in the spiral galaxy NGC 6872. We combined these results with archival optical and HI data to study the properties of interaction-induced star formation in and near the large spiral galaxy. We find the following:
-
•
Excess emission in NGC 6876, the central Pavo group elliptical galaxy, is weak and follows the distribution of starlight. In the central kpc () of NGC 6876, of the emission is ‘nonstellar’ (as defined in §3 and Pahre et al. 2004), while we find no statistically significant nonstellar emission at . This suggests that the nonstellar flux may reflect leakage of the broad emission feature, produced by warm silicate dust grains ejected from the atmospheres of evolved AGB stars, into the bandpass.
-
•
Nonstellar emission, with mid-infrared colors consistent with emission from PAH molecules and a warm dust continuum, contributes () of the total () emission in the central kpc of NGC 6877, the elliptical companion galaxy to NGC 6876, and suggests the presence of warm dust irradiated by recent star formation in NGC 6877’s nuclear region.
-
•
In the spiral galaxy NGC 6872, and nonstellar emission, with mid-infrared colors consistent with emission from PAH molecules and warm dust, is found concentrated in clumps in a kpc radius outer ring about the center of the spiral galaxy, in a bridge of emission connecting NGC 6872’s northern spiral arm to IC 4970, and kpc northeast and southwest of the nucleus along the full extent of NGC 6872’s tidal arms.
-
•
The mid-infrared colors in NGC 6872 are consistent with those found in star-forming regions in other interacting galaxies. The flux ratio () in the bright nonstellar emission regions is depressed relative to elsewhere in the galaxy. The color reddens from in the inner kpc of the galaxy, where there is little nonstellar emission, to in the ring and in the bright nonstellar emission clumps in the bridge and the tidal arms, indicating a younger stellar population and/or more interstellar dust in these features. The flux ratio, a measure of the star formation rate per unit mass, is as much as a factor higher in the bright nonstellar emission clumps in the tidal features in NGC 6872 than in the spiral galaxy’s center. The color of the nonstellar emission in the bright clumps is , in excellent agreement with the theoretical prediction for emission from PAH emission and warm dust.
-
•
We find no strong differences in the mid-infrared colors of the star-forming regions in the spiral galaxy NGC 6872 as a function of their position relative to the tidally interacting companion galaxy IC 4970.
-
•
Young star clusters are strongly correlated with the regions of intense nonstellar emission in the bridge and tidal arms. The brightest nonstellar emission clumps and most of the star clusters also correspond to regions rich in HI gas.
-
•
Eleven X-ray sources with luminosities erg s-1 are found strongly correlated with non-stellar emission and young star clusters in NGC 6872, suggesting that these sources, while near ULX luminosities, may be bright HMXB’s. Most of these bright sources are clustered to the south in NGC 6872, and avoid the highly disrupted bridge region close to the tidally interacting companion IC 4970, despite a high concentration of young star clusters and strong nonstellar emission in that region.
-
•
The nucleus of NGC 6872 is a weak X-ray point source with keV luminosity of erg s-1 . Mid-infrared colors of the nuclear region of NGC 6872 are consistent with normal (nonactive) galaxies dominated by starlight. Statistically significant ( or mJy) nonstellar emission is observed at , but not in the () bandpass. Thus, while dust is present, there is little evidence in the inner kpc () of NGC 6872 for PAH emission from recent star formation or nuclear activity.
-
•
We observe a kpc () stream of interstellar matter at micron, that extends from NGC 6872’s ring to the galaxy’s nuclear region and is bordered by three young star clusters and two X-ray sources. The nonstellar surface brightness in the stream is a factor greater than in the surrounding central region of NGC 6872. This stream may signal the transport of matter along NGC 6872’s central bar into the nucleus, as predicted by simulations, and may be a prelude to a future nuclear starburst or episode of strong AGN activity in the primary galaxy.
-
•
Mid-infrared nonstellar (PAH and dust) emission clumps and young star clusters are found in NGC 6872’s bridge, tidal arms and trailing the spiral galaxy to the southeast, bordering regions of diffuse X-ray gas. This may suggest that stars form as gas stripped by the interaction cools.
References
- Arp (1966) Arp, H. 1966, ApJS, 14, 1
- Athey et al. (2002) Athey, A., Bregman, B., Bregman, J., Temi, P. & Sauvage, M. 2002, ApJ, 571, 272
- Bradt & McClintock (1983) Bradt, H.V.D.& McClintock, J. E. 1983, ARA&A, 21, 13
- Barton et al. (2000) Barton, E.J., Geller, M.J., & Kenyon, S.J. 2000, ApJ, 530, 660
- Bastian et al. (2005) Bastian, N., Hempel, M., Kissler-Patig, M., Homeier, N. & Trancho, G. (2005), A&A, 435, 65
- Bautz et al. (1998) Bautz, M.W., et al. 1998, in Proceedings of the SPIE, 3444, X-ray Optics, Instruments and Missions, ed. R.B. Hoover & A.B. Walker, 210
- Bogdan & Gilfanov (2008) Bogdan, A. & Gilfanov, M. 2008, MNRAS, submitted, eprint arXiv:0803.0063
- Brandt et al. (2001) Brandt, W.R. et al. 2001, AJ, 122, 2810
- Bressan et al. (2006) Bressan, A. et al. 2006, ApJ, 632, L55
- Bressan et al. (2008) Bressan, A. et al. 2008, ASPC, 381, 12
- Buckalew et al. (2006) Buckalew, B.A. et al. 2006, ApJS, 162, 329
- Calzetti et al. (2005) Calzetti, D. et al. 2005, ApJ, 633, 871
- Carrasco et al. (2006) Carrasco, E., de Oliveira, C.M. & Infante, L. 2006, AJ, 132, 1796
- Colbert et al. (2004) Colbert, E., Heckman, T.M., Ptak, A. & Strickland, D.K. 2004,
- Cooper et al. (2006) Cooper, M.C. et al. 2006, MNRAS, 370, 198
- Davis (2001) Davis, J.E. 2001, ApJ, 562, 575
- Elmegreen et al. (2006) Elmegreen, D.M., Elmegreen, B.G., Kaufman, M., Sheth, K., Struck, C., Thomasson, M., & Brinks, E. 2006, ApJ, 642, 158
- Elmegreen & Efremov (1996) Elmegreen, B.G. & Efremov, Y.N. 1996, ApJ, 466, 802
- Fazio et al. (2004) Fazio, G. et al. 2004, ApJS, 154, 10
- Ferrari et al. (2002) Ferrari, F., Pastoriza, M.G., Macchetto, F.D., Conatto, C., Panagia, N. & Sparks, W.B. 2002, A&A, 389, 355
- Garmire et al. (1992) Garmire, G.P. et al. 1992, AIAA, Space Programs and Technologies Conference, March 24-27, 1992 (Paper 92-1473; New York: AIAA)
- Gerke, B.F. et al. (2005) Gerke, B.F. et al. 2005, ApJ, 625, 6
- Gerke et al. (2007) Gerke, B.F. et al. 2007, MNRAS, 376, 1425
- Hancock et al. (2007) Hancock, M., Smith, B.J., Struck, C., Giroux, M.L., Appleton, P.N., Charmandaris, V. & Reach, W. T. 2007, AJ, 133, 693
- Hernquist & Mihos (1995) Hernquist, L. & Mihos, C. 1995, ApJ, 448, 41
- Horellou & Booth (1997) Horellou, C. & Booth, R. 1997, A&AS, 126, 3
- Horellou & Koribalski (2007) Horellou, C. & Koribalski, B. 2007, A&A, 464, 155
- Hornschemeier et al. (2001) Hornschemeier, A. et al. 2001, ApJ, 554, 742
- Kennicutt et al. (1987) Kennicutt, R.C., Jr.,Roetigger, K.A., van der Hulst, J.M., & Hummel, E. 1987, AJ, 93, 101
- Kennicutt et al. (2003) Kennicutt et al. 2003, PASP, 115, 928
- Lauer et al. (2002) Lauer, T. et al. 2002, AJ, 124, 1975
- Lacy et al. (2004) Lacy, M. et al. 2004, ApJS, 154, 166
- Lambas et al. (2003) Lambas, D.G., Tissera, P.B., Alonso, M.S., Coldwell, G. 2003, MNRAS, 346, 1189
- Landt et al. (2001) Landt, H., Padovani, P., Perlman, E., Giommi, P., Bignall, H., & Tzioumis, A. 2001, MNRAS, 323, 757
- Li & Draine (2001) Li, A. & Draine, B.T. 2001, ApJ, 554, 778
- Li & Wang (2007) Li, Z. & Wang, Q.D. 2007, ApJ, 668, 826
- Maccacaro et al. (1982) Maccacaro, T. et al. 1982, ApJ, 253, 504
- Maccacaro et al. (1988) Maccacaro, T., Gioia, I.M., Wolter, A., Zamorani, G. & Stocke, J.T. 1988, ApJ, 326, 680
- Machacek et al. (2005a) Machacek, M., Dosaj, A., Forman, W., Jones, C., Markevitch, M., Vikhlinin, A., Warmflash, A. & Kraft, R. 2005a, ApJ, 621, 663
- Machacek et al. (2005b) Machacek, M.E., Nulsen, P.E.J., Stirbat, L., Jones, C. & Forman, W.R. 2005b, ApJ, 630, 280
- Machacek et al. (2008a) Machacek, M.E., Kraft, R.P., Ashby, M.L.N., Evans, D., Jones, C. & Forman, W.R. 2008a, ApJ, 674, 142
- Machacek et al. (2008a) Machacek, M.E., Kraft, R.P., Jones, C. & Forman, W.R. 2008b, in prep.
- Mihos et al. (1993) Mihos, C., Bothun, G. & Richstone, D. 1993, ApJ, 418, 82
- Mihos & Hernquist (1996) Mihos, C. & Hernquist, L. 1996, ApJ, 464, 641
- Merrifield (1998) Merrifield, M.R. 1998, MNRAS,294, 347
- Nikolic et al. (2004) Nikolic, B., Cullen, H. & Alexamder, P. 2004, MNRAS, 355, 874
- Noguchi (1988) Noguchi, M. 1988, A & A, 203, 259
- Pahre et al. (2004) Pahre, M., Ashby, M.L.N, Fazio, G.G., & Willner, S.P. 2004, ApJS, 154, 229
- Reach et al. (2005) Reach, W.T. et al. 2005, PASP, 117, 978
- Revnivtsev et al. (2006) Revnivtsev, M., Sazonov, S., Gilfanov, M., Churazov, E. & Synyaev, R. 2006, A&A 452, 169
- Sazonov et al. (2006) Sazonov, S., Revnivtsev, M., Gilfanov, M., Churazov, E., & Sunyaev, R. 2006, A&A 450, 117
- Smith et al. (2005a) Smith, B.J., Struck, C., Appleton, P.N., Charmandaris, V., Reach, W. & Eitter, J.J. 2005, AJ, 130, 2117
- Smith et al. (2005b) Smith, B.J., Struck, C. & Nowak, M.A. 2005b, AJ, 129, 1350
- Smith et al. (2007) Smith, B.J., Struck, C., Hancock, M., Appleton, P.N., Charmandaris, V. & Reach, W.T. 2007 AJ, 133, 791
- Spergel et al. (2006) Spergel, D.N. et al. 2006, astro-ph/0603449
- Stern et al. (2005) Stern, D. et al. 2005, ApJ, 631, L163
- Stocke et al. (1991) Stocke, J.T. et al. 1991, ApJS, 76, 813
- Swartz et al. (2006) Swartz, D., Ghosh, K.K., Tennant, A.F. & Wu, K. 2004, ApJS, 154, 519
- Trancho et al. (2007) Trancho, G., Bastian, N., Schweizer, F. & Miller, B.W. 2007, ApJ, 658, 993
- Vorontsov-Velyaminov (1959) Vorontsov-Velyaminov, B. 1959, Atlas and Catalog of Interacting Galaxies, Sternberg Institute, Moscow: Moscow University
- Wang et al. (2004) Wang, Z. et al. 2004, ApJS, 154, 193
- Werk et al. (2008) Werk, J.K., Putman, M.E., Meurer, G.R., Oey, M.D., Ryan-Weber, E.V., Kennicutt Jr, R.C., & Freeman, K.C. 2008, ApJ, 678, 888
- van Paradijs & McClintock (1995) van Paradijs, J. & McClintock, J.E. 1995 in X-ray Binaries, ed. W.H.G. Lewin, J. van Paradijs, & E.P.J. van den Heuvel (Cambridge: Cambridge Univ. Press), 58
- Werner et al. (2004) Werner, M.W. et al. 2004, ApJS, 154, 1
- Whitney et al. (2004) Whitney, B.A. et al. 2004, ApJS, 154, 315
- Willner et al. (2004) Willner, S.P. et al. 2004, ApJS, 154, 222
- Wu et al. (2005) Wu, H., Cao, C., Hao, C.-N., Liu, F.-S., Wang, J.-L., Xia, X.-Y., Deng, Z.-G., & Young, C. K.-S. 2005, ApJ, 632, L79
- Zezas et al. (2002) Zezas, A., Fabbiano, G., Rots, A. & Murray, S.S. 2002, ApJS, 142, 239
| Region | Waveband | Flux density | Magnitude |
|---|---|---|---|
| () | (mJy) | ||
| Full | |||
| Full NS | |||
| … | |||
| … | |||
| Center | |||
| Center NS | |||
| … | |||
Note. — Apertures used are (1) Full: an ellipse with semi-major(minor) axes of () and position angle with a concentric elliptical background annulus with outer and inner semi-major (minor) axes of () and (), respectively; (2) Center: a circular aperture with a concentric circular background annulus with (inner, outer) radii of (,); (3) Full NS and Center NS: the same aperture as (1) and (2), respectively, with stellar model subtracted. All apertures are centered on the nucleus of NGC 6876 (, ) determined from the peak in the emission. Uncertainties in the flux density measurement are
| Region | Waveband | Flux density | Magnitude |
|---|---|---|---|
| () | (mJy) | ||
| Full | |||
| Full NS | |||
| Center | |||
| Center NS | |||
Note. — Apertures used are (1) Full: an ellipse with semi-major(minor) axes of () and position angle with a concentric elliptical background annulus with outer and inner semi-major (minor) axes of () and (), respectively; (2) Center: a circular aperture with a concentric circular background annulus with (inner, outer) radii of (,); (3) Full NS and Center NS: the same aperture as (1) and (2), respectively, with stellar model subtracted. All apertures are centered on the nucleus of NGC 6877 (, ) determined from the peak in the emission. Uncertainties in the flux density measurements are
| Component | Waveband | Flux density | Magnitude |
|---|---|---|---|
| () | (mJy) | ||
| All | |||
| Nonstellar | |||
| … | |||
Note. — Mid-infrared fluxes for the nucleus of NGC 6872 measured in a circular aperture with a concentric circular background annulus whose (inner, outer) radii are (,). ‘All’ denotes the total flux (stellar + nonstellar), while nonstellar denotes the flux with the stellar model subtracted. The apertures were centered on the nucleus of NGC 6872 (, , J2000) determined from the peak in the emission. Uncertainties in the flux density measurements are
| Flux Ratio | Photometry | Map |
|---|---|---|
| Color | ||
Note. — Mid-infrared flux ratios and colors for the nuclear region of the spiral galaxy NGC 6872 determined from a fixed circular aperture with , inner, outer radius background annulus (Photometry) and from the color maps shown in Fig. 4 (Map). Colors are given in magnitudes.
| Label | J2000.0 Coordinates | Total Countsa | H | M | S | |||
|---|---|---|---|---|---|---|---|---|
| (RA, DEC) | ( erg s-1 ) | |||||||
| N | ||||||||
Note. — X-ray counts, luminosities, and colors for X-ray sources associated with NGC 6872. N denotes NGC 6872’s nucleus. Columns are (1) source label; (2) J2000.0 WCS coordinates; (3) keV source counts (4) keV intrinsic X-ray luminosities assuming a power law model with Galactic absorption cm-2 ; (5, 6, 7) source counts in the keV (H), keV (M), keV (S) bands; (8 and 9) X-ray colors defined as and . uncertainties in the number of counts are calculated using the Gehrels approximation for low count rate data.
| Source | MB | MV | AB | AV | Mass | Age |
|---|---|---|---|---|---|---|
| () | (Myr) | |||||
| (X) | ||||||
| (X) |
Note. — Col(1): star cluster label from Bastian et al. (2005) (coincident X-ray source from Table 6); Col 2 (3): absolute B (V) magnitude, corrected for Galactic and internal extinction; Col 4 (5): internal B (V) extinction in magnitudes; Col 6: star cluster mass; Col 7: star cluster age. a All optical properties are from Bastian et al. (2005) assuming a luminosity distance of Mpc (distance modulus ).