Fluidization of granular media wetted by liquid 4He
Abstract
We explore experimentally the fluidization of vertically agitated PMMA spheres wetted by liquid 4He. By controlling the temperature around the point we change the properties of the wetting liquid from a normal fluid (helium I) to a superfluid (helium II). For wetting by helium I, the critical acceleration for fluidization () shows a steep increase close to the saturation of the vapor pressure in the sample cell. For helium II wetting, starts to increase at about 75% saturation, indicating that capillary bridges are enhanced by the superflow of unsaturated helium film. Above saturation, enters a plateau regime where the capillary force between particles is independent of the bridge volume. The plateau value is found to vary with temperature and shows a peak at 2.1 K, which we attribute to the influence of the specific heat of liquid helium.
pacs:
45.70.-n, 68.08.Bc, 67.25.dmIt is a well known experience that the addition of a certain amount of wetting liquid to a pile of sand increases its mechanical stability dramatically Duran00 ; Nagel92 ; Hornbach97 ; Schiffer05 ; Nowak05 , leading to a material stiff enough for sculpting sand castles. The increased mechanical stability of wet granulates is due to the formation of liquid bridges between adjacent grains which exert attractive forces by virtue of their surface tension Herminghaus05 ; Bocquet98 ; Bocquet02 ; Levine98 ; Pietsch68 . As it has recently been shown, the presence of liquid changes as well the acoustic properties of the granulate Brunet08 Wet granular media exist in many chemical, pharmaceutical or food production processes where the question how to handle them appropriately is of great economic significance Rumpf62 ; Iveson01 ; Groeger03 . Moreover, wet granular media are also also model systems to study phase transitions far from equilibrium Fingerle08 . A detailed understanding of the interaction between the liquid and the grains is therefore of major importance.
In both basic research and many industrial processes, vertical vibration is a widely used fluidization scheme Gutman68 . For wet granulates, an extra force must be exerted in wet grains to overcome the cohesive capillary forces, in contrast to the fluidization of a dry granular pile Shapori99 ; Andreas06 ; Mujica98 ; Urbach05 . These forces increase the critical shaking acceleration needed for fluidization, which makes a good parameter to study the influence of a wetting liquid Scheel04 ; Scheel07 ; Fournier05 .
Here we measure for PMMA spheres wetted by liquid helium. Helium wets most substrates perfectly Cheng91 ; Wyatt95 ; Bigelow92 so that a zero contact angle can be assumed. When its temperature is below the point (of 2.17 Kelvin for bulk helium), liquid helium will undergo a phase transition into a superfluid (helium II) where many interesting phenomena such as the ‘fountain effect’ arise, owing to its two-fluid properties WilkBook ; Allen38 ; London39 ; Meyer52 ; Meyer70 ; Atkins59 . In this paper we study how the difference between a superfluid and a normal fluid changes the mechanical properties of a granular medium wetted by this liquid.
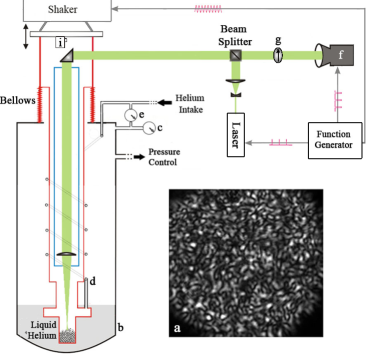
A sketch of the experimental setup is shown in Fig. 1. The granular sample consists of 0.6 g PolyMethylMethAcrylate (PMMA) spheres (Bangs Labs) with an average diameter of m and width of the size distribution. This prevents the formation of a crystalline packing which would result in unwanted side effects. The sample is fluidized by sinusoidal vertical vibrations with a driving frequency = 110 Hz and a non-dimensional acceleration , where is the gravitational acceleration and is the shaking amplitude. The sample is contained in a cylindrical cell made of 99.95% oxygen-free copper which ensures good thermal contact with the surrounding helium bath. The temperature in the cryostat is controlled by adjusting the pressure above the liquid helium.
The amount of helium in the sample cell is controlled by adding room temperature helium gas, which was passed through a cold trap for purification. Well defined amount of helium gas was admitted to the cell using a gauged cylinder volume. All measurements are taken after the pressure in the cell becomes stable.
The sample was illuminated with laser pulses with 532 nm wavelength and a repetition rate of 22 Hz, phase locked to the vibration of the sample. The speckle pattern from the back-scattered light is captured with a Charge Coupled Device (CCD) camera (Hamamatsu C9300) with a quantum efficiency 58% at this wavelength. A polarizer in front of the camera suppresses directly reflected light. The camera and laser are synchronized so that the images are taken at a fixed phase of every fifth vibration cycle. The power injected by the laser pulses is on the order of W. This is at least one order of magnitude less than the energy injected by vibrations which we estimate to be W from the inelastic collisions between the sample and the bottom plate at .
To create a reproducible initial packing, we first fully fluidize the sample by shaking it for a few seconds with a of 61. Then we ramp down to below 1 during approximately one minute. The critical acceleration for fluidization is then measured by slowly increasing and decreasing . differs by maximally 15% for fluidization and solidification Fournier05 , the values reported here are averages, between both values. The transition between solid and fluid states of the sample is determined by visual inspection of the variation of speckle pattern in real time. As soon as the sample fluidize, the speckle pattern no longer stays stable and starts to vary with time. This method was found to agree with measurements based on the correlation of subsequent images.
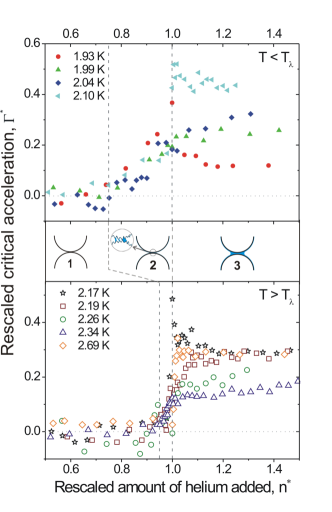
Fig. 2 shows the dependence of the critical acceleration for fluidization on the amount of helium gas added at different temperatures around the point. For clearer display we use a scaled critical acceleration for fluidization . , the fluidization acceleration for a dry sample, is an average of before it increases due to wetting.
Moreover we scale the amount of helium added, , by the amount of helium gas needed for the pressure in the cell to reach saturation by defining . For , can be treated as the fractional saturation of helium, , in the cell, where is the pressure in the cell and the saturated vapor pressure, because most of the helium added stays in the vapor phase. For , grows linearly with liquid content W, by which we denote the ratio of the volume of the wetting liquid and the total volume occupied by the sample. The data with largest shown below correspond to a liquid content varying from 10 % to 38 % at different temperature.
Fig. 2 shows that the behavior of can be divided in three distinct regimes. In regime the sample behaves the same as a dry granular medium; the scaled critical acceleration stays around zero. Adding helium gas in this regime leads to the increase of pressure in the cell and the formation of the first atomic layer of helium on the particles. This layer is, however, not mobile enough to form liquid bridges WilkBook .
Regime corresponds to the asperity wetting regime, where increases monotonically with the amount of added helium. In this regime the helium film condensed on the particle surface is thick enough to form small liquid bridges between the asperities of adjacent particles. With the increase of helium adsorbed, the number of small capillary bridges at asperity level increases, which leads to higher cohesive force between adjacent particles.
In regime , the amount of adsorbed helium is enough to fill the roughness on the grains, such that they appear as completely wet, perfect spheres to all further added liquid. shown in Fig. 2, within experimental scattering, stays constant, in agreement with earlier experiments with other liquids at room temperature Scheel04 . This independence from comes from the fact that the capillary force is dominated by the curvature of the spheres instead of the volume of the liquid bridges. With the increase of capillary bridges will coalesce and form bigger liquid clusters, but will not change due to the constant Laplace pressure imposed by the packing geometryScheel07 .
It is regime 2 where the difference between superfluid and normal fluid wetting is significant. For superfluid wetting the sample enters regime 2 already at a fractional saturation of about 0.75, which is far below the 0.95 observed for normal fluid wetting. We interpret the increase of to be due to the formation of bridges between asperities of neighboring spheres by the condensed unsaturated helium film. The amount of helium adsorbed can be described by the Frenkel-Hasley-Hill equation Bowers53 ; WettingReview ; it is proportional to and therefore as shown above to .
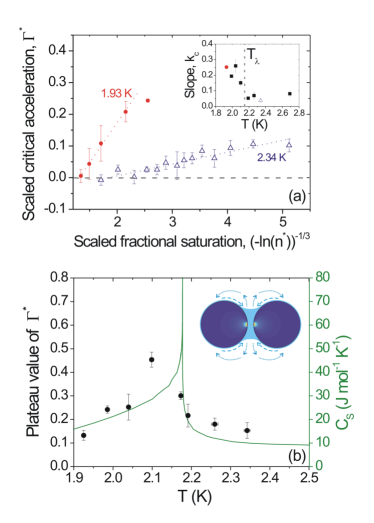
Fig. 3(a) shows that increases linearly in regime 2 with the unsaturated helium film thickness; both above and below the point. This can be understood in the following way. To fluidize wet granular media, the driving force has to overcome the capillary forces between the grains or between container walls and the particles. The gravitational force can be neglected here because it is two orders of magnitude smaller than the capillary force. In the asperity regime , the capillary force is given by Herminghaus05 :
| (1) |
where
| (2) |
is the capillary force in the complete wetting regime, R is the radius of the particle, is the bridge volume, which depends linearly on the amount of helium adsorbed, is the amplitude of the roughness of the particles and is the contact angle. The linear growth of the cohesive force with the bridge volume in this regime explains the linear dependence of on the amount of helium adsorbed (eq. (1)). Therefore we fit in Fig. 3(a) the values of with
| (3) |
with the slope coefficient and as fitting parameters.
The temperature dependence of shown in the inset of Fig. 3(a) depicts the enhancement of the cohesive force by adsorbed superfluid film below the point. This is readily explained from the strongly different transport mechanisms in the superfluid state. First, the superflow enables the forming capillary bridge to acquire more liquid from its surrounding during bridge formation. Second, the impact of the spheres radiates quantum excitations into the superfluid at the point of contact, dragging extra superfluid towards the contact region by osmosis (fountain effect) Allen38 ; London39 . This is in contrast to normal fluid wetting, where only liquid very close to the contact point is sucked into the bridge by the negative Laplace pressure.
As it is clearly seen in Fig. 2, the critical acceleration shows a plateau in regime 3 both above and below , as it is observed as well with standard liquids Scheel04 ; Fournier05 ; Herminghaus05 . The constancy of reflects the weak dependence of the capillary force upon liquid volume for fully developed capillary bridges Herminghaus05 ; Scheel07 . However, since the surface tension depends only weakly on temperature close to , we would expect to observe roughly the same plateau value for all temperatures, which is clearly not the case.
Fig. 3(b) shows the temperature dependence of the plateau value of in regime 3. It shows a peak at about 2.1 K, close to the superfluid transition. This can be qualitatively understood as a combination of two effects. In the normal fluid regime, capillary bridges will acquire their full volume only close to , where the specific heat of the liquid (shown for comparison) is large and prevents strong heating of the bridge from dissipated energy. Farther away from , the bridges heat up and evaporate back into the asperity regime. In the superfluid regime, temperature is effectively equalized by the superflow. The heat intake due to bridge rupture and grain impact thus gives rise to a strong superflow towards the contact points. However, it is well known that the presence of a superflow in an adsorbed liquid film leads to a strongly increased contact angle Herminghaus98 . This is due to the Kontorovich pressure term Kontorovich56 adding to the disjoining pressure, and leads to dynamical incomplete wetting in liquid helium, as observed experimentally Rolley02 . This effect is weak close to , but increases further into the superfluid regime. As a consequence, the capillary force (and thus the plateau value of ) is reduced according to eq. (2).
Need to mention that no clear signature of viscous effect can be found. This can be understood by calculating the ratio between the energy dissipation by viscosity and by rupture of capillary bridges Herminghaus05 . At temperature 2.1 K, it yields 0.0046, indicating that the system is still in the capillary region where viscosity can be ignored.
To conclude, we demonstrate with liquid helium, a liquid that has a surface tension only 1/200 of pure water, that the increase of mechanical stability of granular materials by wetting is prominent. Beyond that, our main findings can still be explained on the basis of a simple capillary model Herminghaus05 by taking superfluid properties of liquid helium, such as ‘fountain effect’, into account.
Inspiring discussions with Mario Scheel, Axel Fingerle, Martin Brinkmann, Jürgen Vollmer, and Isaac Goldhirsch are gratefully acknowledged. We thank Udo Krafft and Günter von Roden for their indispensable technical support.
References
- (1) J. Duran, Sands, Powders, and Grains (Springer, New York, 2000).
- (2) S. R. Nagel, Rev. Mod. Phys. 64, 321 (1992).
- (3) D. J. Hornbaker, R. Albert, I. Albert, A.-L. Barabasi & P. Schiffer, Nature 387, 765 (1997).
- (4) P. Schiffer, Nature Physics, 1, 21 (2005).
- (5) S. Nowak, A. Samadani & A. Kudrolli, Nature Physics, 1, 50 (2005).
- (6) S. Herminghaus, Adv. Phys. 54, 221 (2005), and references therein.
- (7) L. Bocquet, E. Charlaix, S. Ciliberto & J. Crassous, Nature, 396, 735 (1998).
- (8) L. Bocquet, É. Charlaix, & F. Restagno, C. R. Physique 3, 207 (2002).
- (9) T. C. Halsey and A. J. Levine, Phys. Rev. Lett. 80, 3141 (1998).
- (10) W. B. Pietsch, Nature 217, 736 (1968).
- (11) Th. Brunet, X. Jia, P. Mills, Phys. Rev. Lett. 101 (2008) 138001
- (12) H. Rumpf, Agglomeration (AIME, Interscience, New York, 1962).
- (13) S. M. Iveson, J. D. Litster, K. Hapgood & B. J. Ennis, Powder Technol. 117, 3 (2001).
- (14) T. Gröger, U. Tüzün & D. M. Heyes, Powder Tech. 133, 203 (2003).
- (15) A. Fingerle, K. Roeller, K. Huang & S. Herminghaus, New J. Phys. 10 053020 (2008).
- (16) I. Gutman, Industrial uses of mechanical vibrations. (Business Books, London, 1968).
- (17) A. Alexeev, V. Royzen, V. Dudko, A. Goldshtein & M. Shapiro, Phys. Rev. E 59, 3231 (1999).
- (18) A. Götzendorfer, C.-H. Tai, C. A. Kruelle, I. Rehberg & S.-S. Hsiau, Phys. Rev. E 74, 011304 (2006).
- (19) N. Mujica and F. Melo, Phys. Rev. Lett. 80, 5121 (1998).
- (20) J. S. Olafsen and J. S. Urbach, Phys. Rev. Lett. 95, 098002 (2005).
- (21) M. Scheel, D. Geromichalos & S. Herminghaus, J. Phys.: Condens. Matter 16, S4213 (2004).
- (22) M. Scheel, R. Seemann, M. Brinkmann, M. Di Michiel, A. Sheppard, B. Breidenbach & S. Herminghaus, Nature Materials 7, 189 (2008).
- (23) Z. Fournier et al., J. Phys. Cond. Mat. 17, S477 (2005).
- (24) E. Cheng, M. W. Cole, W. F. Saam & J. Treiner, Phys. Rev. Lett. 67, 1007 (1991).
- (25) J. Klier, P. Stefanyi & A. F. G. Wyatt, Phys. Rev. Lett. 75, 3709 (1995).
- (26) N. Bigelow, P. J. Nacher and J. Dupont-Roc, J. Low. Temp. Phys. 89, 135 (1992).
- (27) J. Wilks, The properties of liquid and solid helium, (Clarendon Press, Oxford, 1967).
- (28) J. F. Allen & H. Jones, Nature 141, 243 (1938).
- (29) H. London, Proceedings of the Royal Society of London. Series A. Mathematical and Physical Science 171, 484(1939).
- (30) E. Long & L. Meyer, Phys. Rev. 85, 1030 (1952).
- (31) L. Meyer, J. Low. Temp. Phys. 3, 199 (1970).
- (32) K. R. Atkins, B. Rosenbaum & H. Seki, Phys. Rev. 113, 751 (1959).
- (33) R. Bowers, Phil. Mag. 44, 485 (1953).
- (34) J. Israelachvili, Intermolecular and Surface Forces, (Academic Press, San Diego, USA, 1992).
- (35) S. Herminghaus, Europhys. Lett. 42, 443 (1998).
- (36) V. M. Kontorovich, Sov. Phys. JETP, 3, 770 (1956).
- (37) M. Poujade, C. Guthmann & E. Rolley, Europhys. Lett. 58, 837 (2002).
- (38) R. J. Donnelly & C. F. Barenghi, J. Phys. Chem. Ref. Data 27, 1217 (1998).