11email: mutschke@astro.uni-jena.de, sz@astro.uni-jena.de 22institutetext: Institut für Astronomie, Türkenschanzstraße 17, A-1180 Wien, Austria
22email: posch@astro.univie.ac.at 33institutetext: Max-Planck-Institut für Astronomie (MPIA), Königstuhl 17, D-69117 Heidelberg, Germany
33email: henning@mpia.de
Far-infrared spectra of hydrous silicates at low temperatures††thanks: Based on observations with ISO, an ESA project with instruments funded by ESA Member States (especially the PI countries: France, Germany, the Netherlands, and the United Kingdom) and with the participation of ISAS and NASA.
Abstract
Context. Hydrous silicates occur in various cosmic environments, and are among the minerals with the most pronounced bands in the far infrared (FIR) spectral region. Given that Herschel and ALMA will open up new possibilities for astronomical FIR and sub-mm spectroscopy, data characterizing the dielectric properties of these materials at long wavelengths are desirable.
Aims. We aimed at examining the FIR spectra of talc, picrolite, montmorillonite, and chamosite, which belong to four different groups of phyllosilicates. We tabulated positions and band widths of the FIR bands of these minerals depending on the dust temperature.
Methods. By means of powder transmission spectroscopy, spectra of the examined materials were measured in the wavelength range 25–500 m at temperatures of 300, 200, 100, and 10 K.
Results. Room-temperature measurements yield the following results. For talc, a previously unknown band, centered at 98.5 m, was found, in addition to bands at 56.5 and 59.5 m. For montmorillonite, several bands at wavelengths 110 m were detected, including a band at 105 m with an FWHM of about 10 m. Picrolite shows a sharp 77 m FIR band. Chamosite is characterized by bands in the 72–92 m range, and a prominent band at 277 m. At decreasing temperature, most of the bands shift to shorter wavelengths.
Conclusions. Examining a potential counterpart of the 105m band in the spectra of HD 142527 and HD 100546, we find that the broad band in the spectra of these young stars – extending from 85 to 125 m – cannot be due to montmorillonite or any of the hydrous silicates we studied, since these materials have sharper bands in the FIR wavelength range than previously assumed, especially at low temperatures.
Key Words.:
stars: circumstellar matter — stars: planetary systems: protoplanetary disks — infrared: stars — methods: laboratory1 Introduction
Phyllosilicates, which are partly called hydrous silicates due to the inclusion of OH groups in their lattice structures, are an important constituent of primitive meteorites, such as the carbonaceous chondrites of the CM and CI classes (e.g. Nagy 1975), and of a corresponding class of interplanetary dust particles, the chondritic smooth IDPs (e.g. Smith et al. 2005, Sandford & Walker 1985). They are probably formed by aqueous alteration of pyroxene and olivine minerals in the parent bodies of these meteorites, also an important weathering mechanism for terrestrial rocks. For example, terrestrial enstatite (MgSiO3) is often converted to talc Mg3[Si4O(OH)2] by weathering (see, e.g. Jäger et al. 1998). Also, forsterite (MgSiO4) and tremolite Ca2Mg5Si8O22(OH)2 can easily be transformed into talc. Terrestrial talc is often associated with serpentine, tremolite, forsterite, and almost always with carbonates. It is transformed to enstatite at temperatures above 1000K (Krönert et al. 1964).
In a number of cases, infrared spectroscopy has provided hints to the presence of phyllosilicates in astrophysical objects. Zaikowski, Knacke, & Porco (1975), Dorschner et al. (1978), and Knacke & Krätschmer (1980) were among the first to measure phyllosilicate mid-infrared spectra, because the phyllosilicate bands roughly corresponded to the absorption properties of interstellar silicate dust. They found, however, that all the phyllosilicates had much too narrow bands as to account for the observational data. Later it became clear that amorphous silicates instead of crystalline phyllosilicates can account for most of the 10 m spectra of oxygen-rich cosmic dust.
Nevertheless, after the “crystalline silicate revolution” with the increasing quality and wavelength coverage of the observational data, new indications for phyllosilicate bands have been found in the infrared spectra of cometary dust (e.g. Lisse et al. 2007), young stellar objects such as HD 142527 (Malfait et al. M99 (1999)), and planetary nebulae (Hofmeister & Bowey 2006). Even if these identifications are based on either extremely complex fits or on the assignment of a small number of individual IR bands and may therefore be a matter of debate, the inclusion of phyllosilicates into dust models may be a natural step for various circumstellar environments.
For protostellar or protoplanetary systems, the above-mentioned capacity of phyllosilicates to integrate OH-groups, or even H2O molecules, into their structure makes them a unique potential water reservoir. In our own solar system, hydrosilicates may have even been the main source for liquid water on Earth. According to present knowledge, fragments of asteroids contained even enough crystal water to create the oceans when colliding with the young planet.
Phyllosilicates show infrared bands over a very wide wavelength range. This is due to their internal structure which enables different kinds of vibrations from O–H stretching modes in the near infrared to lattice modes in the far infrared (FIR). Koike & Shibai (1990), e.g., have published optical constants and extinction efficiencies for chlorite (among other hydrous silicates), including a peak even at 268 m. Most of the characteristic phyllosilicate bands that distinguish these minerals from structurally less complex silicates are, however, located in the 25–100 m wavelength domain.
Upcoming astronomical facilities like Herschel will probe the FIR domain in unpreceded detail with a spectral resolution ideally suited for mineralogical studies. The spectrometers in Herschel-PACS and -Spire will cover ranges from 55–210 m and 200–670 m, respectively. Posch at al. (2005) gave an overview of some FIR solid-state features and pointed out the need for laboratory work. ALMA will extend these ranges to even longer wavelengths. Thus it is highly desirable to enlarge the laboratory data sets of cosmic dust species to the FIR.
The spectroscopic work presented in this paper aims at an extension and specification of previous FIR data including systematic low temperature measurements for a sequence of cryogenic temperatures. Before discussing our data, we briefly summarize the results of previous papers – mostly from the astrophysical literature – on FIR data for the same group of minerals.
Koike, Hasegawa, & Hattori (1982) measured infrared absorption spectra of chlorite, montmorillonite, and serpentine at wavelengths up to 115 m including spectra measured at a temperature of 2 K. Furthermore, they investigated the thermo-metamorphism of these minerals by means of mid-infrared spectroscopy. Koike & Shibai (1990) extended these data to 400 m for room temperature and derived optical constants of the three minerals from the transmission spectra. Thus, pre-existing sets of optical constants, published by Toon et al. (1977) and by Mooney & Knacke (1985), could be extended far beyond 50 m, to which wavelength the latter data were limited.
Based on these data, Malfait et al. (M99 (1999)) assigned a very broad emission shoulder in the ISO-LWS spectrum of the Herbig Ae/Be star HD 142527 to cold montmorillonite dust. Apart from montmorillonite, crystalline water ice, FeO, and amorphous silicates are assumed to be present in the dusty disk surrounding HD 142527. Whether or not the assignment of the broad 105 m shoulder highlighted by Malfait et al. (M99 (1999)) to phyllosilicate dust is also consistent with our laboratory data will be discussed in Sect. 4 below. Analyzing UKIRT spectra of circumstellar shells and star forming regions, Bowey & Adamson (2002) conclude the presence of up to 10 percent talc and clays in these dusty environments. However, Bowey & Adamson referred exclusively to the fine structure of the 10 m silicate band in their study.
Hofmeister & Bowey (2006) present detailed results of quantitative IR spectroscopy of brucite (Mg(OH)2), chain silicates, and phyllosilicates. Among the last, they examined chrysotile, lizardite, talc, saponite, and montmorillonite. Their measurements cover a large wavelength range (from 2.5 to beyond 100 m) and were performed at room temperature. An extensive discussion of the assignment of the phyllosilicate bands to individual stretching, bending, and lattice modes is included in their paper, such that we can be very brief on this point.
Zhang et al. (2006) studied the behavior of talc bands upon heating to 1373 K in steps of 100–200 K from a mineralogical point of view. Their spectra nicely illustrate the transformation of talc into amorphous SiO2, orthoenstatite (MgSiO3, space group Pbca), and clinoenstatite (MgSiO3, space group P21/c) at temperatures close to 1273 K, thus adding to the similar study by Koike et al. (1982) for serpentine, montmorillonite, and chlorite.
This cursory literature overview may suffice to illustrate both the relevance of phyllosilicates to cosmic dust research and the need for detailed spectroscopic studies in the FIR range, especially at the low temperatures at which these minerals presumably exist in space.
The present paper is structured as follows: In Sect. 2, we mainly describe the experimental methods we used (including the cryogenic measurements). The subsequent Sect. 3 contains the FIR spectra of talc, picrolite, chamosite, and montmorillonite. Finally, in Sect. 4, we discuss the implications of our study for astromineralogical investigations.
2 Experimental methods
| mineral name | ideal sum formula | actual sample composition | sample origin |
|---|---|---|---|
| picrolite | Mg6[Si4O(OH)8] | Mg5.84Fe0.17[Si4O(OH)8] | Black Lake Mine, Canada |
| talc | Mg3[Si4O(OH)2] | Mg3.33Fe0.1[Si4O(OH)2] | Murcia, Spain |
| chamosite | (Fe,Al)6[(Si3Al)O(OH)8] | Fe3.55Al1.88[Si3AlO(OH)8] | St.Brigitte, France |
| montmorillonite | (Mg,Al)2[Si4O(OH)2] | Al1.5Mg0.25Fe0.18[Si4O(OH)2] | Wyoming (USA) |
| (Na,K,Ca)x . nH2O | (Na,K)0.06 . 1.2H2O |
The basic building blocks of phyllosilicates are continuous two-dimensional sheets with the sum formula Si4O10, with SiO4 tetrahedra arranged in a hexagonal network. The oxygen at the ‘top’ or ‘bottom’ of the individual tetrahedra (i.e., the one directed perpendicular to the sheet) forms part of an adjacent octahedral sheet where the octahedra are linked to each other via common edges. The octahedral sheets typically consist of hydroxides, such as brucite Mg(OH)2 or gibbsite Al(OH)3.
In terms of idealized stereometric arrangements, two- and three-layer-structures can be distinguished. In the former, the octahedral sheets simply alternate with the tetrahedral ones. In the latter, the cations of the hydroxide layers (e.g. Mg++) are linked both up- and downwards to the SiO4-based sheets; the tetrahedral sheets that are ‘sandwiching’ a given octahedral sheet are thus oriented in opposite directions.
The minerals studied in this paper represent different subtypes of the basic phyllosilicate structure described above. Picrolite, a member of the serpentine group, represents the two-layer (or 1:1 layer) type. Talc is a three-layer (or 2:1 layer) phyllosilicate. Montmorillonite, too, has a three-layered structure, but it has the particularity that H2O (as well as other polar molecules, among them organic ones) can enter between the unit layers, thereby leading to a strong volume increase of the mineral. Chamosite, of the chlorite group, has a rather complex structure. It is composed of talc-type- and hydroxide-layers; sometimes, the chlorite structure is therefore referred to as a ‘2:2’ layer structure (e.g., Nagy 1975). Both in the talc and in the brucite sublayers, Mg is replaced by Fe and Al cations in chamosite. The general sum formulae of the four different minerals that we studied are given in Table 1, together with actually measured chemical compositions.
Natural minerals usually contain impurities. Therefore, we carefully selected parts of the samples without inclusions and checked their crystal structure by X-ray diffraction. The mid-infrared spectra, as well, were examined for signatures of well-known impurities, such as quartz or carbonates, but with negative results (see also Fig. LABEL:cha_mir).
The ratios of the metal ions and silicon atoms indicated in Table 1 were determined by energy-dispersive X-ray (EDX) analysis. Oxygen and OH are not accessible by this method, so only the theoretical numbers are given. The apparent nonstoichiometry in the formulae is due to the measurement uncertainty or may be partly due to replacement of silicon by metal ions. The water content of montmorillonite was estimated by measuring the mass loss upon annealing for 30 min at 1050 ∘C. This mass loss was 9.6%0.5%. Since we know from thermogravimetric measurements on related samples (“bentonite” with montmorillonite the major constituent) that around 4% of the mass are released during the structural changes occurring around 700 ∘C, we can estimate that the inter-layer water released typically below 150 ∘C amounts to a difference of about 5.5% of the total mass. This corresponds to about 1.2 H2O molecules per structural unit.
2.1 Sample preparation
The spectroscopic measurements were performed on fine-grained particulates produced by grinding the minerals in a silicon nitride ball mill or in an agate mortar (when the amount of sample was much less than 0.5 g as in the case of montmorillonite), followed by sedimentation in acetone. The powder fraction not sedimented down after a certain time, as calculated (according to Stokes law) from the desired upper grain size limit of d=2m, was dried at 80 ∘C and embedded into polyethylene (PE) pellets. Given that the crystal structure facilitates the production of oblate particle shapes by grinding, the sedimentation times may actually be longer than calculated for spherical grains. This may have led to the presence of grains up to diameters of 5m in the samples.
Each mineral sample was mixed with 200 mg of PE in an agate mortar at mass ratios of 1:100 for overview spectra. For more sensitive measurements at longer wavelengths, additional pellets with a mass ratio of 1:10 were prepared. After homogenizing the mixtures for 20–30 min under wet conditions with spectral clean ethanol, the mixture was dried in a compartment drier for 30–40 min at about 80 ∘C to evaporate the ethanol solvent. The dry powder was pressed to a pellet for 5 min under 10 t load. The pellet diameter was 13 mm, resulting in material column densities of = 1.49 mg/cm2 for samples embedded at a ratio of 1:100 and 13.7 mg/cm2 for samples with a ratio of 1:10.
2.2 Measurement procedure
For recording the FIR transmission spectra, we used a Bruker 113v Fourier-transform infrared spectrometer equipped with a continuous flow helium cryostat (Cryo Vac KONTI Spectro B). In this cryostat, samples were cooled by helium gas at a pressure of 10 mbar, providing thermal contact with the liquid-helium cooled sample chamber walls. The temperatures of sample and wall were controlled by two silicon diode temperature detectors. Heating of the sample mount allowed for stabilization of the sample temperature to less than 1 K variation during the 20–30 min measuring time at each temperature. The measurements were performed at 300 K, 200 K, 100 K, and 10 K.
The sample mount of the cryostat provides two sample positions, which can be alternately placed into the transmission beam. One of these sample positions, which was either kept empty or filled with a blank PE pellet, was used for reference measurements that were taken at each temperature. In the former case (empty reference) separate measurements of the blank PE pellet were performed to correct for losses due to PE reflection, absorption, and scattering. This approach allowed for an easier correction of fringes by avoiding superposition of sample and reference pellet fringes.
For our measurements we used a globar as radiation source and mylar beam splitters of 3.5 m and 12 thickness for the wavenumber ranges 1/ = 660–150 cm-1 and 220–50 cm-1, respectively. A mercury lamp and a 23 thick mylar beamsplitter have been used for the wavenumber range 120–30 cm-1. The transmitted IR beam was recorded by a DTGS-Detector (deuterated triglycine sulfate) with a PE window. The spectral resolution was chosen to amount to 2 cm-1 in the higher wavenumber ranges and 0.5 cm-1 in the lower wavenumber range.
3 Results
3.1 Spectra at lower column density and experimental limits


| Talc | Picrolite | ||||||||||
| (m) | (%) | (cm2g-1) | (m) | (%) | (cm2g-1) | ||||||
| 300 K | 200 K | 100 K | 10 K | 300/10 K | 10 K | 300 K | 200 K | 100 K | 10 K | 300/10 K | 10 K |
| – | – | 26.5 | 26.5 | – | 1000 (400) | 25.6 | 25.5 | 25.4 | 25.5 | 0.4 | 1700 (600) |
| 28.9 | 28.9 | 28.8 | 28.8 | 0.3 | 450 (340) | 26.8 | 26.8 | 26.8 | 26.7 | 0.4 | 1300 (800) |
| 32.0 | 32.0 | 31.9 | 31.9 | 0.3 | 110 (60) | 31.4 | 31.4 | 31.4 | 31.3 | 0.3 | 190 (140) |
| – | 34.2 | 34.0 | 34.0 | – | 62 (30) | 32.7 | 32.7 | 32.6 | 32.6 | 0.3 | 2300 |
| 38.7 | 38.4 | 38.4 | 38.3 | 1.1 | 140 (110) | 42.9 | 42.6 | 42.5 | 42.4 | 1.2 | 530 |
| 43.2 | 43.2 | 43.0 | 42.9 | 0.7 | 51 (30) | 49.3 | 49.3 | 49.2 | 49.1 | 0.4 | 34 (25) |
| 56.5 | 56.5 | 56.0 | 56.0 | 0.9 | 130 (60) | 77.0 | 76.5 | 76.0 | 76.0 | 1.3 | 130 |
| 59.5 | 59.5 | 59.0 | 59.0 | 0.8 | 150 (90) | ||||||
| 98.5111This value corresponds to 255 K (compare Fig. LABEL:talc10). | 98.0 | 97.0 | 95.5 | 3.1 | 45 (20) | ||||||
| Montmorillonite | Chamosite | ||||||||||
| (m) | (%) | (cm2g-1) | (m) | (%) | (cm2g-1) | ||||||
| 300 K | 200 K | 100 K | 10 K | 300/10 K | 10 K | 300 K | 200 K | 100 K | 10 K | 300/10 K | 10 K |
| 26.8 | 27.0 | 27.1 | 27.2 | -1.5 | 470 (100) | 29.4 | 29.4 | 29.2 | 29.1 | 1.0 | 1400 (550) |
| 29.0 | 29.0 | 29.0 | 29.0 | – | 760 (440) | 35.2 | 35.2 | 35.0 | 34.6 | 1.7 | 940 (430) |
| 33.0 | 32.9 | 32.9 | 32.8 | 0.6 | 280 (45) | 41.0 | 40.5 | 40.0 | 40.0 | 2.5 | 440 (60) |
| 49.7 | 49.7 | 49.6 | 49.5 | 0.4 | 190 (55) | – | 42.5 | 42.5 | 42.5 | – | 400 (80) |
| 60.0 | 60.0 | 60.0 | 60.0 | – | 134 (8) | 49.5 | 49.5 | 49.0 | 49.0 | 1.0 | 310 (80) |
| – | – | 66.0 | 66.0 | – | 129 (3) | 72.5 | 72.0 | 72.0 | 71.5 | 1.4 | 220 (90) |
| – | 72 | 72 | 72 | – | 134 (15) | 77.0 | 76.5 | 76.5 | 76.5 | 0.6 | 190 (80) |
| 86 | 84 | 82 | 80 | 7.0 | 129 (15) | 91.5 | 90.5 | 89.0 | 89.0 | 2.8 | 220 (120) |
| 105 | 104 | 103 | 103 | 1.9 | 110 (25) | – | – | 108 | 108 | – | 65 (10) |
| 277 | 274 | 273 | 272 | 0.7 | 31 (19) | ||||||
Figure 1 a–d displays the transmission spectra in the 25–110 m wavelength range, which were measured using the samples with the lower column densities (1.51 mg/cm2). For clarity, only the spectra measured at room temperature and at 10 K are shown (the latter were shifted vertically). The spectra in this range reveal significant differences between the spectroscopic properties of the four minerals. The picrolite spectrum, e.g., is characterized by comparably few but very strong and distinct FIR bands, while those of the other minerals are considerably weaker. The bands of the talc spectrum appear very sharp, while those of chamosite are much broader, and montmorillonite has a spectrum that is rather poor in structure beyond 30 m. The transmission plots allow a distinct delineation of the spectra with their bands of very different strengths, even without being able to constrain the continuum absorption, and they also illustrate the experimental limitations (see below). Therefore we prefer the transmission scale here and give the peak mass absorption coefficients of the bands at 10 K and their difference to the estimated continuum absorption in tabular form (Table 2). The precision of the latter values is lower because of the uncertainty of the baseline.
The noise level of the spectra is typically 1% in transmission, but is higher in the range around 50 m, where the spectra measured with the two beamsplitters were merged and either of the two beamsplitters only provide low beam intensity. In general, the signal-to-noise ratio at this column density is too poor to reveal the weaker bands with sufficient clarity. Especially, the band expected for montmorillonite at 90 m is not detected in the room temperature spectrum and becomes only weakly visible at 10 K. Instead, we see a continuously lowered transmission (to about T=0.85) at wavelengths 55 m. Additionally, most of the spectra show fringes in this wavelength range originating from multiple reflections at the pellet surfaces, which complicate the detection of weaker bands. For the continuum absorption behind the bands, i.e. the absolute transmission, the precision is even lower than the noise limit (e.g. caused by scattering and reflection compensation errors, see also Sect. 3.4). Therefore, it cannot be determined precisely from these spectra, especially at the longer wavelengths, although some continuum absorption is detected for montmorillonite and chamosite.
The temperature dependence of the band positions does on average not appear to be very strong, as has already been noted by Koike et al. (Koike82 (1982)). The expected broadening and the shift to longer wavelengths of the bands with increasing temperature (compare e.g. Henning & Mutschke hemu97 (1995), Koike et al. koimu06 (2006), Suto et al. suto06 (2006)) is still quite clearly seen for some of the picrolite and chamosite bands, but is hardly detectable for most of the spectral features. Table 2 presents the detailed peak wavelengths at all the temperatures measured. Peak wavelengths longer than 50 m are given with 0.5 m accuracy and values higher than 100 m, as well as those of heavily blended bands with 1 m accuracy. These data demonstrate that most peak wavelengths shift by less than 1 % over the whole temperature range covered (the relative shifts are also given in the table). For some bands, no shift could be detected within the accuracy limits, which are between 0.1 m and 1 m depending on the strength of the band and the wavelength. Only for a few features is the shift considerably stronger. This is especially true for some bands in the 100 m range. In some cases of weak and strongly shifting peaks, such as the montmorillonite 80 m band and perhaps the chamosite 40 m feature, the shift may be attributable to unresolved blending.
We now discuss the spectra for each of the minerals separately, showing in addition the measurements at higher sample concentrations for ranges of weaker absorption.
3.2 Talc
Comparing the spectra for talc displayed in Fig. 1 (a) with the studies by Zhang et al. (2006) and Hofmeister & Bowey (2006), we note that (1) their results are consistent and (2) all of the bands reported at wavelengths beyond 25 m are present in our spectra as well, although the weak ones at 34 m and 43 m are hardly seen behind the noise especially in the room-temperature spectra. In addition, we see a weak band at about 95–100 m, which has not been noticed by the other authors although there are indications of its presence in their spectra (Zhang, priv. comm.).
For a closer look at this band and others at wavelengths beyond 50 m, we show in Fig. LABEL:talc10 additional spectra measured at ten times higher talc column density. For an easier quantitative comparison, these spectra are displayed in terms of the mass absorption coefficient calculated from the transmission T measured at temperatures between 255 K and 10 K. The newly discovered band is clearly resolved in these spectra. Its position is 98.5 m at 255 K and 95.5 m at 10 K with an FWHM decreasing from about 9 m to 4.5 m. In contrast to this rather strong temperature effect, the double feature at 56.5 m and 59.5 m changes much less with temperature. The positions of the latter features coincide well with the positions reported by Hofmeister & Bowey (HB06 (2006)).
3.3 Picrolite
The FIR data of minerals belonging to the serpentine group have been measured by both Hofmeister & Bowey (HB06 (2006)) and Koike & Shibai (KS90 (1990)). The former authors used lizardite and chrysotile, mentioning that their infrared spectra are similar. The latter measured a serpentine without further characterization. Picrolite (antigorite) is chemically identical to lizardite and chrysotile apart from the iron content, which for our sample is, however, very low and comparable to the minerals used by Hofmeister & Bowey (HB06 (2006)). The crystal structure of picrolite and lizardite is in both cases monoclinic, as in most serpentines. Thus, we can expect that the IR spectrum displayed in Fig. 1 (b) will not show strong differences from the literature spectra.
Indeed we find band positions more or less identical to those of the lizardite measured by Hofmeister & Bowey (HB06 (2006)) with one possible exception. The shoulder at 28.7 m (348 cm-1) is not confirmed at 10 K (at room temperature there is a weak uncertain structure), whereas other shoulders tend to be better-resolved at lower temperatures. See for instance the shoulder at about 27 m, which evolves into a distinct band at 10 K. In the oscillator data of serpentine given by Koike & Shibai (KS90 (1990)), all stronger bands are also present, most importantly the long-wavelength bands at 43, 48, and 79 m (43, 49, and 77 m in our data). Some shoulders are not represented by the oscillator data. However, the one at 28.7 m not seen in our spectra is again reported, and there are additional features at 37.5 m and 105 m not seen in any other reported spectra of this mineral class. Apart from these differences, we can confirm that the general features of the spectra are consistent for the minerals belonging to the serpentine group.
Figure LABEL:picsmoothed displays the FIR part of the spectrum with the band at about 77-76 m. In the two lower spectra, the fringes were removed by simple smoothing (sliding average of 5 data points). This method works well for bands that are broad compared to the fringe spacing. For narrower bands we instead have either subtracted periodic functions, or we fitted the profile with Lorentzian profiles.
3.4 Montmorillonite
Both the montmorillonite spectra published by Hofmeister & Bowey (HB06 (2006)) and Koike & Shibai (KS90 (1990)) have similarly shallow bands to ours. The band at 29 m is the most prominent longward of 25 m. The published data are in accordance with ours for features at 29 m, 33 m (only Hofmeister & Bowey HB06 (2006)), and about 50 m. However, our spectrum has an additional band at 26.8 m, which shifts to longer wavelengths at lower temperatures. On the other hand, we do not see the shoulders at 23.6 m and 39.4 m reported by the two previous papers at approximately identical positions.
To look in more detail at the long-wavelength bands, we again measured spectra for a pellet with increased column density. Figure LABEL:mont10 displays the mass absorption coefficient calculated from these spectra for 300 K and 10 K. At the higher signal-to-noise ratio resulting from these measurements and especially by looking onto the 10 K spectrum, it becomes clear that the montmorillonite spectrum is composed of a number of absorption bands that cover the whole wavelength range between 50 and 110 m. At room temperature, some of these bands merge into the very broad absorption structure peaking at about 86 m (consistent with both literature papers), whereas several additional peaks are seen at 10 K. Especially a band at 72 m strengthens continuously when cooling the sample, and the band at 105 m separates from the shorter-wavelength ones, becoming more clearly visible and shifting to 103 m. Note that an indication of the latter band might also be present in Fig. 5 of Hofmeister & Bowey (HB06 (2006)).
Because of these broad bands, the mass absorption coefficient at 120 m is, e.g., about four times higher than for talc (see also Fig. LABEL:comp), which allowed the decline of the absorption to be measured up to wavelengths of about 350 m. In contrast, this was not possible for talc and picrolite due to the small absorption signal. The uncertainty of the values is about 5 cm2g-1 resulting from (1) influences of the cryostat setup, which caused slight differences between measurements with and without cryostat, which could not be clarified, (2) the uncertainty in smoothing of the fringes that may have been influenced by noise in the spectra, and (3) by the uncertain correction for pellet reflection losses. Embedding of 10% of a silicate into a PE pellet can increase the reflectivity significantly, which is difficult to correct for quantitatively.
For montmorillonite, the absorption even at these large wavelengths is still above the uncertainty level. Therefore, for room temperature we can confirm the finding of Koike & Shibai (KS90 (1990)) of an approximate behavior of the FIR continuum absorption. At 10 K, however, the continuum decline is clearly seen to steepen and seems to approach an ordinary slope (compare e.g. Mennella et al. 1998). The upturn of the 10 K spectrum beyond 250 m is very uncertain, although Koike & Shibai (KS90 (1990)) have reported such an upturn as well.
The average absorption coefficient (, g cm-3 being the density) that we derive for the 70–110 m spectral region is more than twice as high as the value given by Hofmeister & Bowey (HB06 (2006)) (0.013 m-1) but lower than the one given by Koike & Shibai (KS90 (1990)) (3/4 Qext/a 0.045 m-1). The latter difference is even greater at longer wavelengths. We tried to find out whether the inter-layer water present in montmorillonite may be responsible for these deviations and may generally have an influence on the FIR behavior. However, heating of the sample to 350∘C did not change the spectrum significantly. An alternative explanation for deviations between the experimental data could be provided by differences in grain size or shape, although simple calculations based on the optical constants by Koike & Shibai (KS90 (1990)) would instead tend to predict absorption enhancement for both larger flake-like grains and also the compacted film used by Hofmeister and Bowey (2006) compared to the 1 m sized grains measured by Koike & Shibai (KS90 (1990)). This needs to be clarified by future investigations.
3.5 Chamosite
The case for chamosite differs from those of the other minerals because this mineral has not been measured yet at FIR wavelengths. The mid-infrared spectra have been investigated by Zaikowski, Knacke, & Porco (Zai75 (1975)), Dorschner et al. (Dor78 (1978)), and Knacke & Krätschmer (Kna80 (1980)). While Dorschner et al. (Dor78 (1978)) show only a 10 m profile, the chamosite spectra displayed in the other two papers indicate a mixture of the samples used with a carbonate (identified by strong bands at 7, 11, 14, and 30 m). We show for comparison the mid-infrared absorption spectrum of our chamosite powder embedded at a column density of 0.3 mg/cm2 into KBr and PE pellets (Fig. LABEL:cha_mir). The bands at wavelengths of 3 and 6 m are O–H stretching and bending vibrations. The FIR bands (at 50 m) appear very weak at this column density. The baseline slightly falling towards short wavelengths (near infrared) indicates scattering losses caused by chamosite grains of 1 m size.
We compared our FIR spectra (Fig. 1d) with those obtained for chlorite by Koike et al. (Koike82 (1982)) and Koike & Shibai (KS90 (1990)), because chamosite and other chlorites are isostructural and there are many similarities in their spectra. For the shorter-wavelength bands (50 m), we find that the 29 m band of chlorite and the three minor bands between 40 and 50 m are also present for our chamosite, whereas chamosite’s additional stronger band at 35 m is not seen in the chlorite spectra. The longer-wavelength bands are more clearly visible in Fig. LABEL:cha10, where the fringes have been smoothed out and the spectra have been extended to 350 m using again a pellet of higher column density. At the signal-to-noise level of these data, we can still not confirm the chlorite bands at 53 and 58 m to have counterparts in the chamosite spectrum. On the other hand, chamosite has a strong band at 77 m that becomes clearly separated from the 72 m band at 10 K and is not known from chlorite. The 91 m band does not strengthen at 10 K as much as seen for chlorite by Koike et al. (Koike82 (1982)), but shifts to 89 m. This may be influenced by a significant decrease in the continuum absorption with lowering temperature, which is however not as strong as for montmorillonite. Also the long-wavelength continuum absorption level is lower in the case of chamosite (compare Fig. LABEL:comp), making the measured wavelength dependence uncertain. An exciting feature in the chamosite spectrum is the band at about 277 m, which certainly does correspond to the already mentioned 268 m feature of chlorite discovered by Koike & Shibai (1990). These are the silicate lattice vibration with by far the lowest frequency known to us.
| Talc | Picrolite | Montmorillonite | Chamosite | ||||||||
|---|---|---|---|---|---|---|---|---|---|---|---|
| FWHM | FWHM/ | FWHM | FWHM/ | FWHM | FWHM/ | FWHM | FWHM/ | ||||
| (m) | (m) | (m) | (m) | (m) | (m) | (m) | (m) | ||||
| 56.0 | 1.4 | 0.025 | 76.0 | 2.7 | 0.035 | 103 | 10.2 | 0.099 | 71.5 | 4.7 | 0.066 |
| 59.0 | 1.8 | 0.031 | 76.5 | 3.7 | 0.048 | ||||||
| 95.5 | 4.5 | 0.047 | 89.0 | 6.6 | 0.074 | ||||||
| 272 | 17 | 0.062 | |||||||||
4 Comparison with astronomical spectra
4.1 A broad montmorillonite band around 100 m in the young stars HD 142527 and HD 100546?
Malfait et al. (1999) present quite convincing evidence of montmorillonite grains in the dust disk of the Herbig Ae/Be star HD 142527. They modeled the ISO SWS and LWS spectra of this object by means of a radiative transfer calculation, assuming the following dust components: amorphous and crystalline silicates, H2O-ice, montmorillonite, and a small fraction of FeO. The dust temperature in the disk was found to be in the range 30 – 60 K.
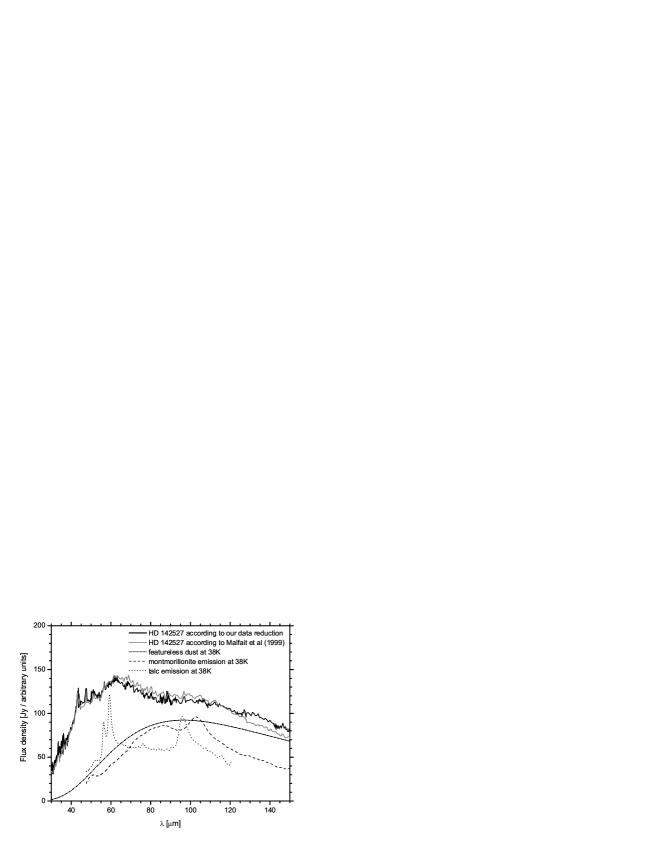
In Fig. 8 we present an independent comparison between the ISO spectrum of HD 142527 and montmorillonite dust. A temperature of 38 K was found to allow the best fit to the observed spectrum, although the band profile in the 100 m range depends much more strongly on the material’s optical properties than on the chosen temperature. We would like to point out the absence of a narrow 105 m band in the ISO spectrum.
The ISO spectrum was reduced with the ISO spectral analysis package ISAP, version OLP 10.1. The differences between the two versions of the ISO spectra are negligible in the MIR range. In the 60-160 m region, the spectrum published by Malfait et al. has a steeper overall gradient. It can be seen from Fig. 8 that the presence or absence of a band in the 100m region does not depend on the version of the spectrum to which our laboratory data are compared. However, the details of the profile of the excess emission around 100 m do depend on the preconditioned data reduction procedure. Observations of HD 142527 with an entirely different instrument (e.g. Herschel-PACS) will help to clarify the real shape of the spectral energy distribution of this object.
The montmorillonite spectrum clearly differs from the one shown by Malfait et al. This is mainly due to the narrow 103 m band of montmorillonite, emerging as an increasingly sharp structure at low temperatures as shown in Fig. 4. At 10 K, the FWHM of this band is 10.2 m. We conclude from this comparison that cold montmorillonite dust cannot be the carrier of the broad 100 m shoulder in the spectrum of HD 142527. Figures LABEL:comp and 8 demonstrate that the same conclusion holds for talc and chamosite as well. Both of these hydrous silicates have at least similarly strong and sharp bands in the 100 m wavelength range (at 89 and 95.5 m with FWHM values of 6.6 and 4.5 m, respectively, see also Table 3).
The finding that all of the three-layer phyllosilicates investigated here (picrolite is of the two-layer type, see Sect. 2.1) have sharp bands in the 100 m wavelength range makes us confident that the montmorillonite 103 m feature is not a peculiarity of our montmorillonite sample, but indeed characteristic of montmorillonite. As noted before, an indication of the band is present in the room temperature spectrum presented by Hofmeister & Bowey (HB06 (2006)), and may even be present in the 2 K spectrum of Koike et al. (Koike82 (1982)). In addition, this band is also seen in spectra of the already mentioned “bentonite”.
Only a material that has a much smoother FIR spectrum than the phyllosilicate spectra presented here, even at low temperatures, can account for the observed FIR spectral energy distributions of HD 142527. This fact has already prompted Verhoeff et al. (2005) to fit the FIR part of the spectrum with iron sulfide (FeS). In contrast to montmorillonite, iron sulfide is essentially featureless in the wavelength region beyond 60 m; it is characterized by an almost constant real part and a monotonically rising imaginary part of the complex index of refraction in this wavelength range, according to Henning & Mutschke (hemu97 (1995)). However, we want to stress that any kind of dust with a 1/ dependence of its absorption coefficient in the FIR could provide a good match of the 100 m shoulder (see Fig. 8) if it were characterized by a narrow range of dust temperatures (about 35–40 K), corresponding to a region in the outer disk where this temperature is prevailing. Alternatively, dust with a ‘steeper’ absorption coefficient in the FIR (e.g. 1/), in combination with a wider range of dust temperatures (hence a broader spectral energy distribution of underlying blackbodies), may account for the FIR spectrum of HD 142527.
The same arguments apply to the dust around the Herbig Ae/Be star HD 100546. Bouwman et al. (2003) point out that there is a broad shoulder, extending from 85–125 m, in the ISO-LWS spectrum of this object, although they note that a change in the supposed underlying continuum ‘may change both the strength and width of the feature or may even cause it to disappear’. In Fig. 7 of their paper, they compare this emission feature to the structure in HD 142527 discussed above and find widths and positions to be similar for both bands, hence too wide to be ascribed to the phyllosilicates studied here.
4.2 Other objects with broad bands around 100 m
Chiavassa et al. (2005) studied a sample of 32 low and intermediate mass protostars (mostly class 0 and Herbig Ae/Be objects). Out of this sample, the spectra of 17 sources show a broad band feature between 90 and 110 m. The dust temperature in these objects is below 50 K, except for emission from the innermost regions. Calcite is suggested as a possible carrier of this feature, which seems to be supported by the laboratory measurements of Kemper et al. (2002), which show a peak at 93 m with a width (FWHM) of 16 m.
A part of the above-mentioned sources, mainly the class 0 protostars, show a broad band peaking beyond 100 m. According to Posch et al. (2007), calcite cannot account for that emission band since its lowest frequency band peaks at too short a wavelength. Chiavassa et al. ponder the possibility that hydrous silicates could account for the 100 m bands/shoulders of their class 0 protostars, but conclude – on the basis of the optical constants published by Koike & Shibai (1990) – that the bands of these hydrous silicates are much too broad. On the contrary, our data – revealing sharp phyllosilicate features in the FIR – lead us to the opposite conclusion: the width of the phyllosilicate emission bands so far known to result for dust temperatures of 10–100 K is definitely smaller than required by the observations. If any of the phyllosilicates discussed in the present paper were present in significant amounts in protostars, rather narrow FIR bands would reveal their presence.
Acknowledgements.
We thank Gabriele Born and Walter Teuschel, Jena, for the sample preparation and for help with the cryogenic measurements. HM acknowledges support by DFG grant Mu 1164/6. TP, FK, and AB acknowledge support by the Austrian ‘Fonds zur Förderung der wissenschaftlichen Forschung’ (FWF; project number P18939-N16).References
- (1) Bowey, J.E. & Adamson, A.J., 2002, MNRAS, 334, 94
- (2) Bouwman, J., de Koter, A., Dominik, C., Waters, L.B.F.M., 2003, A&A, 401, 577
- (3) Chiavassa, A., Ceccarelli, C., Tielens, A.G.G.M., Caux, E., & Maret, S., 2005, A&A, 432, 547
- (4) Dorschner, J., Friedemann, C., & Gürtler, J., 1978, AN, 299, 269
- (5) Henning, Th. & Mutschke, H., 1997, A&A, 327, 743
- (6) Hofmeister, A.M. & Bowey, J.E., 2006, MNRAS, 367, 577
- (7) Jäger, C., Molster, F.J., Dorschner, J., Henning, Th., Mutschke, H., & Waters, L.B.F.M., 1998, A&A, 339, 904
- (8) Kemper, F., Molster, F.J., Jäger, C., Waters, L.B.F.M., 2002a, A&A 394, 679
- (9) Knacke, R.F. & Kraetschmer, W., 1980, A&A, 92, 281
- (10) Koike, Ch., Hasegawa, H., & Hattori, T., 1982, ApSS, 88, 89
- (11) Koike, Ch. & Shibai, H., 1990, MNRAS, 246, 332
- (12) Koike, Ch., Mutschke, H., Suto, H., Naoi, T., Chihara, H., et al., 2006, A&A, 449, 683
- (13) Krönert, W., Schwiete, H.E., & Suckow, A., 1964, Naturwiss., 51, 4, 85
- (14) Lisse, C.M., Kraemer, K.E., Nuth, J.A., Li, A., & Joswiak, D., 2007, Icarus, 191, 223
- (15) Malfait, K., Waelkens, C., Bouwman, J., de Koter, A., Waters, L.B.F.M., 1999, A&A, 345, 181
- (16) Mennella, V., Brucato, J.R., Colangeli, L., Palumbo, P., Rotundi, A., Bussoletti, E., 1998, ApJ, 496, 1058
- (17) Mooney, T. & Knacke, R.F., 1985, Icarus, 64, 493
- (18) Nagy, B., 1975, Carbonaceous Meteorites, Elsevier, Amsterdam
- (19) Posch, Th., Kerschbaum, F., Richter, H., Mutschke, H., 2005, ESA-SP-577, 257
- (20) Posch, Th., Baier, A., Mutschke, H., Henning, Th., 2007, ApJ, 668, 993
- (21) Sandford, S.A. & Walker, R.M., 1985, ApJ, 291, 838
- (22) Smith, J.B., Dai, Z.R., Weber, P.K., et al., 2005, LPI conf. abstr., 36, 1003
- (23) Suto, H., Sogawa, H., Tachibana, S., Koike, C., Karoji, H., et al., 2006, MNRAS, 370, 1599
- (24) Toon, O.B., Pollack, J.B., & Sagan, C., 1977, Icarus, 30, 663
- (25) Verhoeff, A.P., Min, M., de Koter, A., et al., 2005, Protostars and Planets V, 8465
- (26) Zaikowski, A., Knacke, R.F., & Porco, C.C., 1975, Ap&SS, 35, 97
- (27) Zhang, M., Hui, Q., Lou, X.-J., et al., 2006, Amer. Min. 91, 816