Two bright submillimeter galaxies in a proto-cluster in GOODS-North, and accurate radio-infrared photometric redshifts
Abstract
We present the serendipitous discovery of molecular gas CO emission lines with the IRAM Plateau de Bure interferometer coincident with two luminous submillimeter galaxies (SMGs) in the Great Observatories Origins Deep Survey North field (GOODS-N). The identification of the millimeter emission lines as CO[4-3] at is based on the optical and near-IR photometric redshifts, radio-infrared photometric redshifts and Keck+DEIMOS optical spectroscopy. These two galaxies include the brightest submillimeter source in the field (GN20; mJy, ) and its companion (GN20.2; mJy, ). These are among the most distant submillimeter-selected galaxies reliably identified through CO emission and also some of the most luminous known. GN20.2 has a possible additional counterpart and a luminous AGN inside its primary counterpart revealed in the radio. Continuum emission of 0.3mJy at 3.3mm (0.65mm in the rest frame) is detected at for GN20, the first dust continuum detection in an SMG at such long wavelength, unveiling a spectral energy distribution that is similar to local ultra luminous infrared galaxies. In terms of CO to bolometric luminosities, stellar mass and star formation rates (SFRs), these newly discovered SMGs are similar to SMGs studied to date. These SMGs have much higher specific SFRs than typical B-band dropout Lyman break galaxies at the same redshift. The stellar mass-SFR correlation for normal galaxies does not seem to evolve much further, between and . A significant spectroscopic redshift spike is observed in GOODS-N, and a strong spatial overdensity of -band dropouts and IRAC selected galaxies appears to be centered on the GN20 and GN20.2 galaxies. This suggests a proto-cluster structure with total mass . Using photometry at mid-IR (24m), submm (850m) and radio (20cm) wavelengths, we show that reliable photometric redshifts () can be derived for SMGs over . This new photometric redshift technique has been used to provide a first estimate of the space density of hyper-luminous starburst galaxies, and to show that they both contribute substantially to the SFR density at early epochs and that they can account for the presence of old galaxies at . Many of these high-redshift starbursts will be within reach of Herschel. We find that the criterion , coupled to optical, near-IR and mid-IR photometry, can be used to select starbursts, regardless of their submm/mm emission.
Subject headings:
galaxies: formation — cosmology: observations — infrared: galaxies — galaxies: starbursts — galaxies: high-redshift — submillimeter — galaxies: individual (GN20, GN20.2a, GN20.2b)1. Introduction
Submillimeter and millimeter observations of galaxies are subject to strong negative K-corrections over a very broad range of redshifts, and can reach nearly constant bolometric luminosity limits (for a given flux density limit) at (Blain et al. 1993). This provides a powerful method for detecting and studying starburst galaxies in the distant universe. Efforts to identify counterparts of bright ( mJy) submm-selected galaxies (SMGs; see Blain et al. 2002 for a review) based on radio detections have recently suggested that the typical redshift of these sources is (Chapman et al. 2003; 2005), with few objects at and virtually none at . This result suggests a very strong decline in the space density of the highest luminosity, most highly star forming galaxies, in the distant universe.
SMGs are outliers in the stellar mass-star formation rate relation in the universe (Daddi et al. 2007a; Takagi et al. 2008), have gas kinematic signatures suggesting ongoing mergers (Tacconi et al. 2006; 2008), have very compact sizes reminiscent of massive, evolved galaxies at (Daddi et al. 2005a; Trujillo et al. 2006; Zirm et al. 2007; Tacconi et al. 2006; 2008; Cimatti et al. 2008) and have high star formation efficiencies compared to typical galaxies of similar mass (; Daddi et al. 2008; see also Bouche et al. 2007). Their space density evolution is a crucial issue for understanding the formation of massive galaxies, as the SMGs are thought to represent massive galaxy mergers which will rapidly evolve into passive systems (Daddi et al. 2007ab; Tacconi et al. 2008; Cimatti et al. 2008). Therefore, searching for the very high redshift tail of SMGs holds clues into understanding early type galaxy formation and characterizing the distribution of their formation redshifts, both crucial issues for galaxy formation models in a CDM universe.
The strong decline of SMG counts at redshifts higher than might signal that is indeed the main formation epoch of massive early-type galaxy systems (Daddi et al. 2004ab), but it can be affected by selection biases, primarily the requirement of a detection in the radio, which suffers from positive K-correction. On the other hand, the existence of a population of passive systems at (Spinrad et al. 1997; Cimatti et al. 2004; McCarthy et al. 2004; Daddi et al. 2005a; Saracco et al. 2005; Kriek et al. 2008) with large masses (), a space density of order of Mpc-3 (% of the correspondent one at ; Daddi et al. 2005a; Labbé et al. 2005; Kong et al. 2006) and estimated formation redshifts for their stars of or even much higher (Daddi et al. 2005a; Labbè et al. 2005; Maraston et al. 2006; Longhetti et al. 2007; Cimatti et al. 2008), seems to require in turn the existence of a substantial population of vigorous starburst galaxies at , which should be detectable from their strong far-infrared (FIR) emission. For example, if this population of early type galaxies were mainly formed during 100 Myr long bursts within , one would expect to find Mpc-3 galaxies with SFR yr-1 in the same redshift range, which would be detectable as SMGs and with a sky density of deg-2.
Evidence has been mounting in the past years that such objects actually exist. For example, a well known case is that of HDF850.1 (Dunlop et al. 2004), an SMG in the Hubble Deep Field that is thought to be at very high redshift, lying behind a bright foreground galaxy. In addition, although largely lacking spectroscopic identifications, the survey of Dannerbauer et al. (2002; 2004) presented evidence that a high fraction of sources selected with the 1.2mm bolometer MAMBO at the IRAM 30 m telescope (Kreysa et al. 1998) are at high redshifts, given their very faint -band and radio detections or upper limits. Similarly, Younger et al. (2007) recently reported on seven sources selected with the AzTEC camera at 1.1mm (Wilson et al. 2008) with flux densities above 5 mJy in the COSMOS field (Scoville et al. 2007), of which five (70%) are found to be very faint at optical and radio wavelengths, suggesting redshifts . More recently, Wang et al. (2007; 2008) and Dannerbauer et al. (2008) presented high resolution submm/mm imaging of a bright SMG from GOODS-N called GN10111Here and in the remaining of the paper we adopt the “GN” nomenclature for GOODS-N SMGs taken from Pope et al. (2006)., suggesting that this source is at a much higher redshift than thought before, probably . Follow-up surveys of high redshift radio galaxies also resulted in submm detections (Archibald et al. 2001; Greve et al. 2007). Knudsen et al. (2006) proposed a identification for SMM J1635966130. However, this source lacks both radio and CO identifications, and to our knowledge the result was never published in a refereed journal. Recently, Capak et al. (2008) also suggest a identification for an SMG discovered with AzTEC and IRAM in the COSMOS field. This high redshift galaxy is away from the radio and IRAC positions. Offsets of up to are indeed sometimes found for SMG counterparts (Chapman et al. 2005). In a few of such cases the identification turned out to be wrong (see, e.g., Pope et al. 2008), however Schinnerer et al. (2008) confirmed the redshift for this galaxy.
Most of the evidence for SMGs comes from survey in the millimeter regime. At first glance, it is not too clear how to reconcile these results with much of the work done on SCUBA surveys follow-up. The slight difference in selection wavelength (850m versus 1.1mm) is likely not sufficient to justify the diverging results. A possible explanation is the trend for brighter SMGs to be systematically at higher redshifts, as claimed by Ivison et al. (2002) and Pope et al. (2006; P06 hereinafter). Difficulties in locating the counterparts within the large submm/mm positional uncertainties, and the fact that the most distant sources could be ultra-faint or completely undetected in the optical, near-IR, mid-IR, and/or radio, imply that it is likely to obtain incorrect identifications by choosing the brightest galaxy within the error circle of the submm position. Given that star formation proceeds through the consumption of the molecular gas reservoirs, the detection of CO emission is still the most secure means to measure the redshift of an SMG.
If SMGs are the progenitors of very massive early type galaxies, signaling perhaps their last and strongest starburst before the onset of passive evolution, they should also be strongly clustered and reside in overdense regions of the universe. Blain et al. (2004) report evidence for significant excess of redshift pairs in SMG samples, suggesting significant clustering in this population. Stevens et al. (2003) find significant excess of SMGs in the close surroundings of high redshift radio galaxy fields, evidence that SMGs might trace proto-cluster environments and be related to the formation of present-day cluster ellipticals. However, this result is not yet spectroscopically confirmed. More recently, Chapman et al. (2008a) discuss a concentration of five SMGs in the GOODS-N field that does not correspond to a similarly strong overdensity of UV selected galaxies. They suggest that concentration of SMGs might correspond to the cosmic structures with the strongest enhancement in the frequency of major mergers.
In this paper, we take advantage of Plateau de Bure Interferometer (PdBI) observations at millimeter wavelengths in the GOODS-N area that serendipitously revealed two strong emission lines, coincident with the positions of GN20, the brightest SMG in the GOODS-N field (mJy), and GN20.2 (mJy). Using multiwavelength photometric imaging data and Keck spectroscopy, we identify the lines as CO[4-3] transitions at and . Thanks to the serendipitous detection of CO lines in the PdBI field of view, this reverses the typical SMG counterpart identification process in which a plausible optical/near-IR counterpart with a measured spectroscopic redshift is only later confirmed through CO observations. In addition, we provide spectroscopic (CO) and photometric evidence for a second plausible counterpart to GN20.2, likely at the same redshift. This concentration of submm galaxies appears to define a proto-cluster structure as traced by -band dropout Lyman break galaxies and massive IRAC selected galaxies. The newly measured CO redshifts for SMGs have been exploited to calibrate and test the use of radio-IR photometric redshifts for the SMG population, and to obtain a new estimate of the abundance of very high redshift SMGs.
The paper is organized as follows. In Sect. 2 we describe the PdBI CO line detections, and determine their redshifts in Sect. 3. The physical properties of the sources, in terms of molecular gas, SFRs and masses, are discussed in Sect. 4. In Sect.5 we show that these objects lie at the center of a proto-cluster environment. We describe a method to obtain accurate photometric redshifts for SMGs in Sect.6, and discuss the properties and present a new selection technique for identifying high redshift starbursts in Sect.7. Throughout the paper magnitudes are expressed in the AB scale unless stated otherwise, and a standard cosmology is adopted with , and (100 km s-1 Mpc-1).
2. PdBI observations
We have used the IRAM PdBI to map the CO[2-1] transition from the galaxy BzK-21000 (J123710.60+622234.6) redshifted to about 91.4 GHz. We obtained 7.5 hours of on-source integration in D-configuration (5.5′′ synthesized beam) during April 2007 and 6.4 hours on source follow-up observations were obtained in January 2008 with a B-configuration (1.3′′ synthesized beam). For both D- and B-configuration observations the PdBI was used with all 6 antennas available (15 independent baselines). The correlator consists of 8 independent units each of which was covering 320 MHz (128 channels each with a width of 2.5 MHz) with a single polarization, covering a total bandwidth of about 1 GHz with both polarizations. Observations were tuned at a central frequency of 91.375 GHz (for a total velocity bandpass of about 3000 km/s). For calibration of the data we observed standard bandpass calibrators (J0418380, 3C273), phase/amplitude calibrators (J1044719, J1150497), and flux calibrators (MWC 349, 3C273) to which we regularly switched during the primary target observations. We reduced the data with the GILDAS software packages CLIC and MAP. The maps of the fields obtained using natural weights and using the full 1 GHz bandpass have noise levels of about 67.9Jy/beam and 51.2Jy/beam for the D- and B-configuration data, respectively.
| ID | RACO(J2000) | DECCO(J2000) | RAVLA(J2000) | DECVLA(J2000) |
|---|---|---|---|---|
| GN20 | 12:37:11.90 | 62:22:12.1 | 12:37:11.89 | 62:22:11.8 |
| GN20.2a | 12:37:08.77 | 62:22:01.7 | 12:37:08.78 | 62:22:01.8 |
| GN20.2b | – | – | 12:37:09.73 | 62:22:02.6 |
Note. — The CO coordinates are from our 1.3′′ beam, B-configuration observations of CO[4-3]. The VLA coordinates are from the 1.4 GHz radio continuum map of Morrison et al. (in preparation) with 1.7′′ beam.
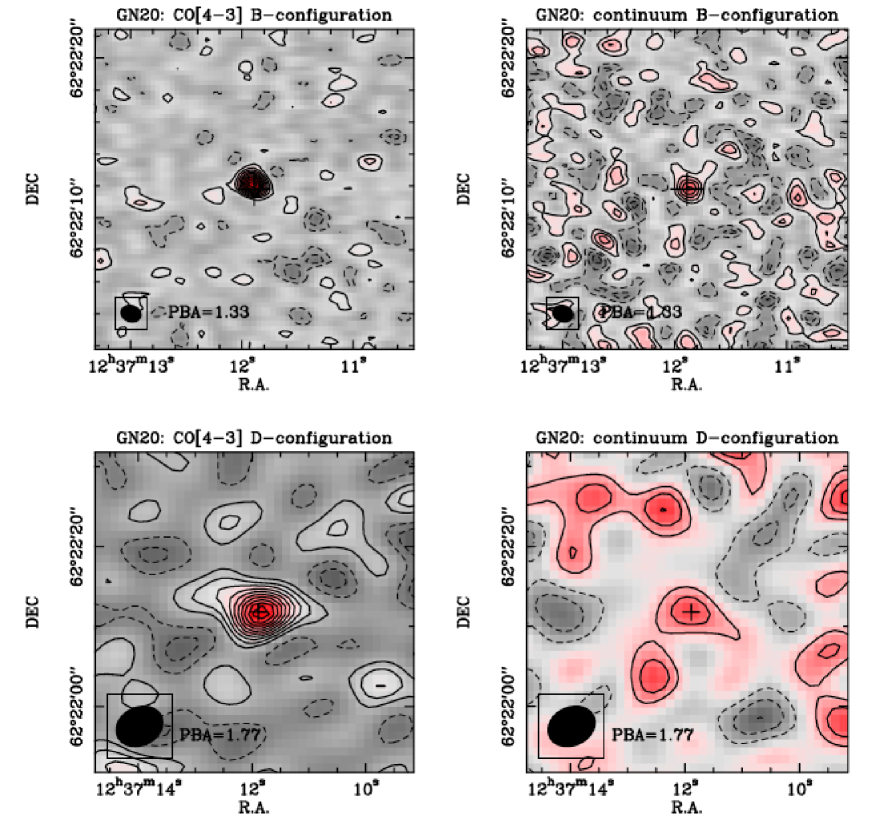
Daddi et al. (2008) presented the CO[2-1] detection of the BzK galaxy with the D-configuration data. In addition to the BzK galaxy, from the initial D-configuration observations we also found a strong, serendipitous source in the field, located 22′′ South and 8′′ East of the primary target (Fig. 1). Even when averaging all available channels over the 3000 km s-1 spectral range observed, and after subtracting from the data the signal from the primary target, the serendipitous source was securely detected, despite the large primary beam attenuation at its distance from phase center (the primary beam results in an approximately Gaussian response with full width at half maximum [FWHM] of at this frequency). For this reason, for the follow-up observations in the more extended B-configuration we offset the pointing by 10′′ from the BzK galaxy in order to reduce the primary beam attenuation at the position of the serendipitous detection without compromising the data quality at the position of the primary target. In addition to confirming this serendipitous source, the new observations also revealed a second source at high significance (Fig. 2 and 3), and a third tentative detection. The two secure detections correspond well to the positions of GN20 and GN20.2 in the sample of SMGs published in P06. In both cases, it is clear that most of the detected signal comes from an emission line, most likely from CO molecular gas222It is unlikely that the emission line is not from CO, given that CO lines are the brightest lines observed at millimeter wavelengths.. Measured quantities are summarized in Tables 1 and 2 and derived quantities (like luminosities and masses) are in Table 3.
2.1. CO detection of GN20
GN20 is very securely detected in both D- and B-configuration observations (Fig. 1 left). Most of the signal appears to be due to a CO emission line. Averaging the signal from 150 km s-1 to 900 km s-1 (here and in the following all velocities are defined with respect to the central frequency of the observations at 91.375 GHz) results in a detection with for the D-configuration data (Fig. 1 left and Fig. 3 top). The B configuration observations within the same velocity range results in a detection with and a position of , (Fig. 1 left). This position is consistent with the submm error box of the SMG GN20 (P06), and is within of the accurate interferometric Iono et al. (2006) Sub-Millimeter-Array (SMA) detection of this source and of the radio counterpart in 20cm VLA data (Morrison et al., in preparation; Fig. 4). The PdBI position coincides well with a faint galaxy that P06 already identified with the optical counterpart of GN20 (Fig.5). GN20 is the brightest SMG in the GOODS-N area. The radio, CO, and SMA submm positions actually appear to be slightly offset to the East of the source seen in the optical (by or so), as also noted by Iono et al. (2006). It is not clear if this is due to some additional galactic structure being present but extremely obscured, or just a random fluctuation across the data sets.
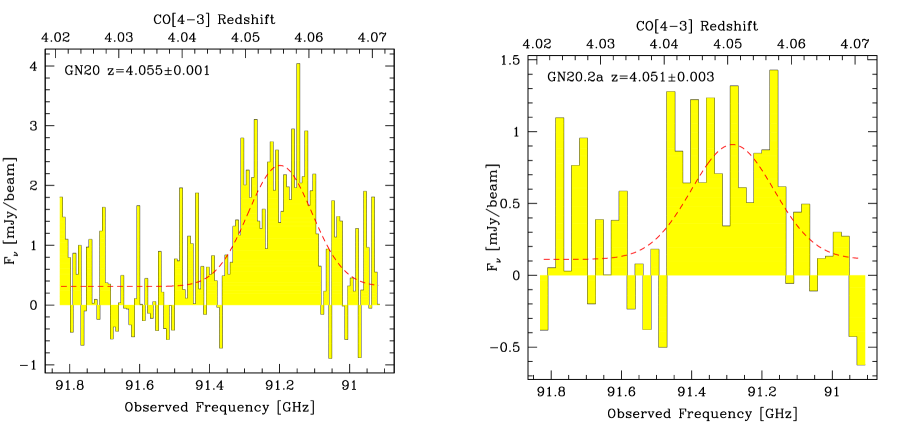
The PdBI D- and B-configuration datasets were independently fitted with a point source and the resulting spectra were corrected for primary beam attenuation (PBA) and coadded with appropriate weighting (the D-configuration observations are noisier on an absolute flux scale, also due to the larger correction for PBA). We performed Gaussian fitting of the resulting spectrum (Fig. 3) to determine the CO line properties, allowing for the presence of a faint underlying continuum. The best fitting Gaussian line is offset by 580 km s-1 relative to the central frequency, and has an velocity integrated flux of I Jy km s-1, with both errors given at the level and following Avni (1976) for the case of two parameters of interest (line velocity and integrated emission line flux). There is evidence for faint 3mm continuum as well, as shown in Fig. 1 (right panels) and Fig. 3. To confirm this result, we averaged the signal in UV space for velocities outside a 1200 km s-1 range centered on the line (about 1.7FWHM), where negligible line contribution should be present. The resulting continuum map has a faint source at a position consistent within the errors with that of the emission line and corresponding to a signal of 0.33 mJy, significant at the 5 level. To our knowledge, this is the first secure dust continuum detection of an SMG in the 3mm band.
2.2. CO detection of GN20.2a
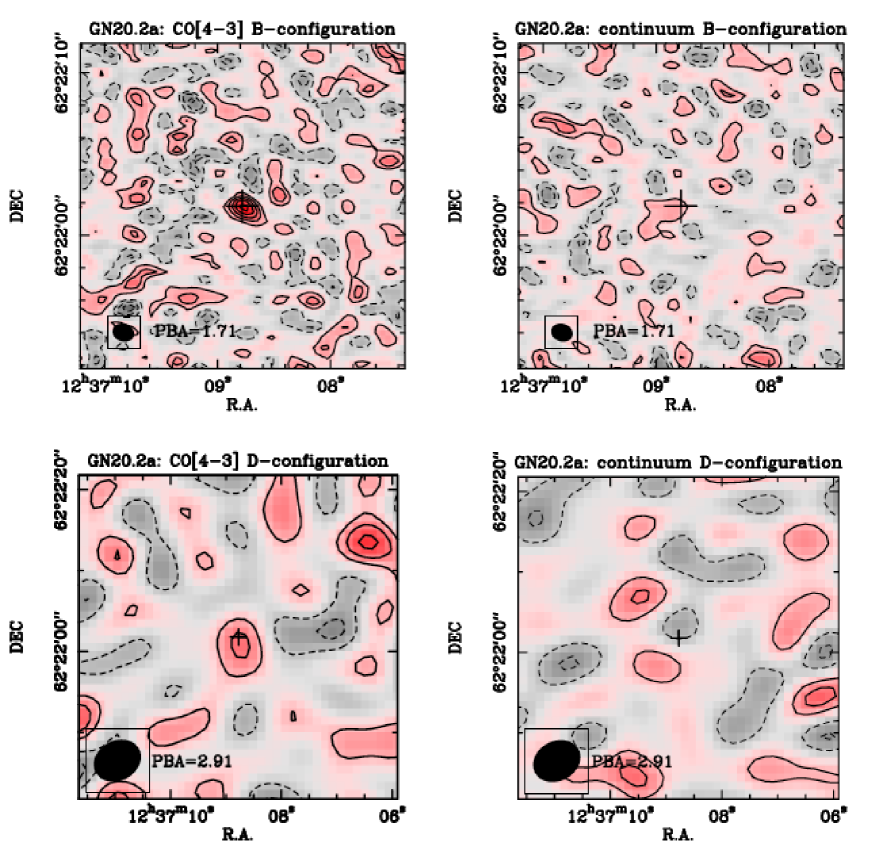
Averaging the velocity channels between -300 km s-1 and 825 km s-1 a source is detected in the PdBI map with at the position of , in the B-configuration observations (Fig. 2 left and Fig. 3 right). Positive flux with just below 3 is observed also in the D-configuration data at this position (Fig. 2 left). We extracted the spectra by fitting point sources in the D- and B-configuration datasets independently and coadded the spectra with weighting after correcting for primary beam attenuation. Averaging the total resulting spectrum within -300 km s-1 and 825 km s-1 we find a positive signal significant at the level.
The position of this source is within 0.2′′ of the relatively bright radio source that P06 identified with the counterpart of the SMG GN20.2, close but well distinguished from GN20 that is to the NE. The position corresponds to a faint galaxy in the deep Hubble Space Telescope (HST) images (Fig. 5). Also in this case the signal appears to be mostly due to an emission line. The best fitting Gaussian line is offset by 330 km s-1 relative to the central frequency, and has a velocity integrated flux of I Jy km s-1. The largest contribution to the flux error is the uncertainty in the continuum level. Some positive continuum appears to be present, although the is not yet sufficient for a reliable measurement (Tab. 2). Accounting for the possible continuum emission and its uncertainty, the CO emission line is still detected at the level.
2.3. GN20.2b: a second counterpart to GN20.2 ?
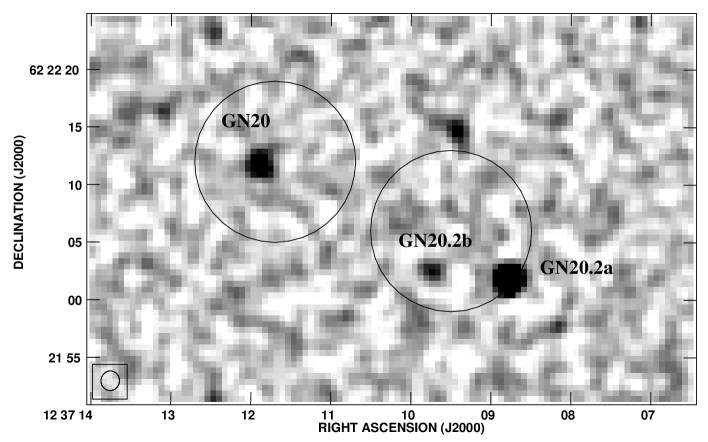
Inspection of the newly reprocessed 1.4 GHz radio map around the position of GN20.2 (Fig. 4; Morrison et al., in preparation) shows an additional faint radio source with a flux density of Jy (5) at , (radio frame), 3.4′′ from the GN20.2 SCUBA position (P06) and 6.8′′ from the CO detected counterpart discussed above. We refer to the primary counterpart of GN20.2 as GN20.2a, and this newly identified faint radio source is referred to as GN20.2b. GN20.2b is a plausible additional counterpart to the submm emission.
Interestingly, positive signal is found in the PdBI map close to the position of GN20.2b. The PdBI D- and B-configuration datasets were independently fit with a point source fixed at the VLA position of GN20.2b (a secure position cannot be derived from the PdBI data alone, due to the low ) and the resulting spectra were corrected for primary beam attenuation (PBA) and coadded weighting according to the noise, similarly to what was done for the other galaxies. Averaging over the whole 1 GHz bandwidth in the coadded spectrum results in a signal. If we average the spectrum between km s-1 and km s-1, we find a signal. Although longer integrations at PdBI would be required for a more reliable conclusion, the data are again consistent with CO emission, quite close in frequency to the other securely detected lines. If real, that would correspond to an integrated flux of I Jy km s-1.
3. Redshift identifications
Depending on which transition we are actually observing, the CO detection fixes the redshift of GN20 and GN20.2a to , where the observed transition is . Possible redshifts are: 0.26, 1.53, 2.80, 4.05, 5.32, 6.58, etc. The most straightforward guess for the redshift would be 1.53, corresponding to companion galaxies to BzK-21000, the primary target of the PdBI observations. However, we show in the following that the correct identification for the lines is CO[4-3] at redshift , making these among the most distant CO detections so far for SMGs. Although it might seem unlikely that we have serendipitously detected CO emission lines from galaxies, we note that the 1 GHz spectral range of our data maps into a twice larger redshift range at versus , which in turn corresponds to a two times larger comoving volume. Also, at higher redshift the density of CO transitions per unit frequency and at fixed observed frequency is higher, hence chance detections are non-negligible once a luminous high redshift target is within the field of view (Fig. 6).
The following section discusses several independent redshift estimates for these galaxies, e.g., based on optical photometric redshifts, radio-IR photometric redshifts, and optical spectroscopy. This comparison is interesting as the problem of unidentified CO line detections will become a typical situation of the coming years with new, wide-band instrumentation rapidly becoming available. Even GHz receivers will often identify single CO lines from single galaxies (Fig. 6). A direct assessment and inter comparison of multiple redshift identification techniques is thus interesting for this first test case of serendipitously detected CO lines.


3.1. GN20
3.1.1 Photometric redshift from stellar emission
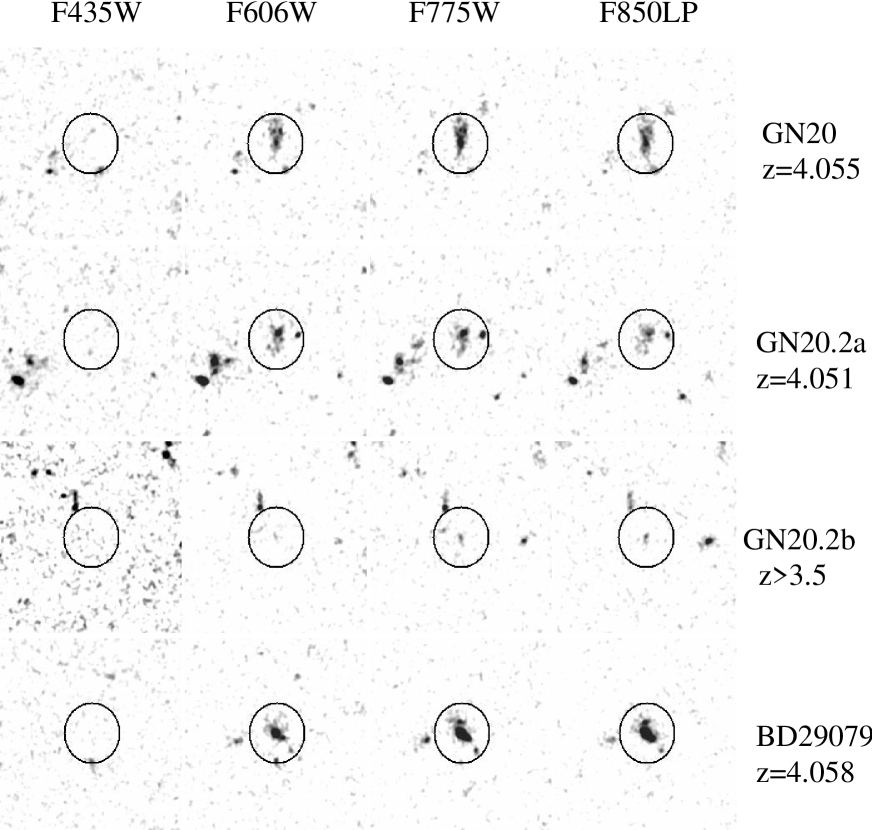
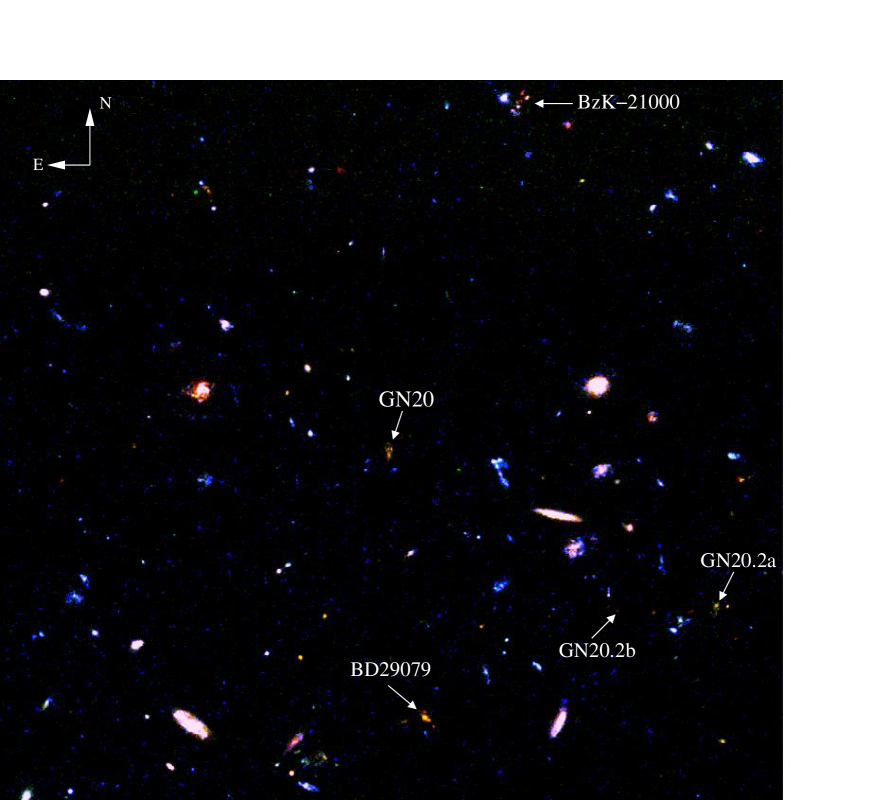
Fig. 5 shows HST+ACS imaging in the four bands available in GOODS (Giavalisco et al. 2004a). As already noted by P06, the optical counterpart of GN20 is a B-dropout Lyman break galaxy according to the definition of Giavalisco et al. (2004b). This definition returns galaxy samples with , favoring the identification of the PdBI line as CO[4-3] at . Circumstantial evidence for the likelihood of a redshift around had been even earlier presumed from the presence of a bright -band dropout galaxy at a 16′′ separation (Fig. 5) with fairly similar colors and a known spectroscopic redshift of measured from Keck spectroscopy (Stern et al., in preparation, we refer to this object as BD29079). The IRAC colors of the GN20 -band dropout counterpart are very red, with the brightest IRAC band being the 8.0m (see, e.g., P06). If due to the emission of stars, this implies that the 1.6m rest frame bump is beyond the 5.8m channel, or . However, the IRAC emission can also be red due to, or affected by, the presence of obscured AGNs (e.g., Stern et al. 2005; Daddi et al. 2007b).
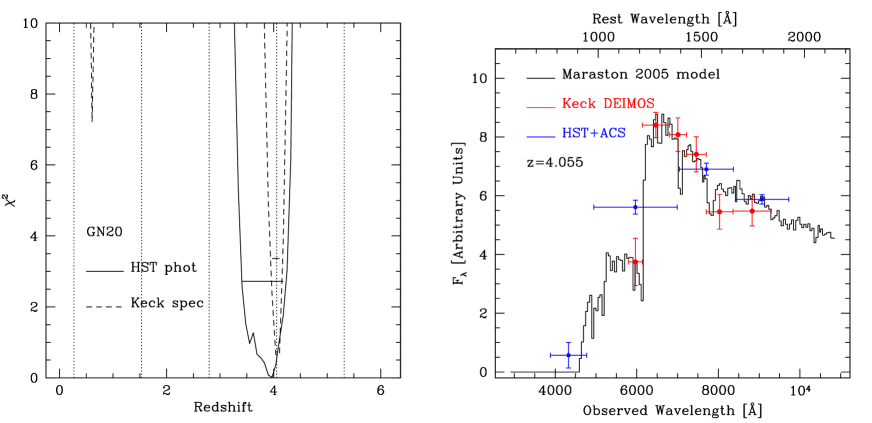
Stellar photometric redshifts were thus estimated using only the four HST bands and running the hyperz code (Bolzonella et al. 2002). The Maraston (2005) models were used, with a variety of star formation histories and allowing for reddening using the Calzetti et al. (2000) law. The near-IR bands are not used because the available datasets, described, e.g., in Daddi et al. (2007a), are not sufficiently deep for placing meaningful constraints on the spectral energy distribution SED of this faint and relatively blue galaxy. The distribution of values versus redshift (Fig.7) is consistent with (95% confidence range). Fig. 7 shows the observed SED and the best fitting model for the case of .
| ID | FWHM | |||||||||
|---|---|---|---|---|---|---|---|---|---|---|
| (mJy) | (mJy) | (Jy) | (Jy) | (Jy) | (Jy) | (Jy km s-1) | (km s-1) | |||
| (1) | (2) | (3) | (4) | (5) | (6) | (7) | (8) | (9) | (10) | (11) |
| GN20 | 4.060.02 | 20.32.1† | 0.330.07 | 75.8 | 65.53.5 | 1.50.2 | ||||
| GN20.2a | 4.059 0.007 | 9.92.3† | 180.78.4† | |||||||
| GN20.2b | – | – | 9.92.3† | 32.26.5 | – | – |
Note. — Col. (1): Name of the object. Col. (2): Redshift derived from the CO[4-3] observations. Col. (3): Redshift derived from the Keck optical spectroscopy. Col. (4): SCUBA 850 m flux density from P06†. Col. (5): Continuum flux density at 3.3mm. We notice that only GN20 is detected in the 3.3mm continuum. For GN20.2a and GN20.2b we list 2-sigma upper limits. The formal 3.3mm continuum measurement are: and , respectively. Col. (6): VLA 1.4 GHz flux density from P06† and our own measurements. Col. (7): Spitzer+MIPS 24 m flux density. Col. (8) and (9): Spitzer+IRAC flux densities. All detections have high significance, errors are dominated by systematics effects at the 10% level. Col. (10): Velocity integrated CO[4-3] flux. Col. (11): Width of CO[4-3] line, estimated through a single Gaussian fitting.
3.1.2 Photometric redshift from the infrared and radio emission
An independent estimate of the redshift of GN20 can be derived from its FIR emission. The ratio between mid-IR, FIR, mm and radio flux densities is redshift dependent. This is due to the fact that the radio luminosity is observed locally to be proportional to the bolometric IR luminosity (Condon et al. 1992; Yun et al. 2001), which seems to hold at high redshift as well (Elbaz et al. 2002; Garrett 2002; Appleton et al. 2004). Originally this idea was exploited by Carilli & Yun (1999; 2000) to estimate photometric redshifts of distant SMGs, also attempted by several other studies (Hughes et al. 2002; Wiklind 2003; Aretxaga et al. 2003; 2005; 2007; Clements et al. 2008). In addition, one can exploit the fact that the mid to FIR emission has a generally well defined peak at m, affecting directly the ratio of mid-IR to submm and mm emission.
For this purpose, we use the available photometry at 24m, 850m, 3mm and 20cm. Some of the Spitzer+MIPS 24m and VLA 20cm measurements are updated from P06 using the most up-to-date GOODS datasets. We measure a 24m flux density of Jy and a 20cm flux density of Jy. We use a 850m flux density of mJy from P06 and a 3.3mm flux density of mJy (Section 2).
The observed flux densities have been compared, as a function of redshift, to the predictions of a suite of 105 template SEDs that were built following the luminosity correlations observed for local galaxies as described in Chary & Elbaz (2001). The template dust temperatures get warmer with increasing luminosity from a minimum template luminosity of up to a maximum luminosity of . Radio continuum emission is added to each template following the radio-IR correlation (Yun et al. 2001). For each template of a given luminosity we compute the expected flux densities in the available bands (24m, 850m, 3mm and 20cm) as a function of redshift and perform a minimization over the template total IR luminosity as a function of redshift, without allowing template normalizations to vary. In order to avoid biasing the fitting to a particular band, we increased the formal uncertainty in the 24m flux density to obtain a ratio of 9 (as opposed to the higher measured value of ), comparable to the radio and submm bands.
Fig.8 shows the results. The best fitting redshift is and at the 99% confidence level is . Therefore, we conclude that the radio-IR SED also independently supports the redshift determination. We notice that this analysis allows us to reject with high confidence any redshift identification with or .
Fig.8 (right panel) also shows the comparison of the observed GN20 SED from UV to radio to the best fitting (and brightest) template in the library of Chary & Elbaz (2001). The SED is remarkably well reproduced in the mid- to FIR and radio, without any rescaling or ad-hoc normalizations. The UV-optical part of the template SED also happens to match the shape of the observed data quite well, although there is a factor of offset over the IRAC bands that implies a different ratio, suggesting a higher specific SFR (SSFR). A similarly good agreement, including the optical/UV part, was seen by Daddi et al. (2005b) when comparing the average SED of BzK selected ULIRGs to Chary & Elbaz (2001) templates. The optical/UV emission was simply added to the models using a synthetic stellar population model matched to the Arp220 SED and scaled to reproduce the local broad correlation between bolometric luminosity and -band rest frame luminosity.
3.1.3 Keck spectroscopy
A solid identification of the CO line, and thus a determination of GN20’s redshift, is finally provided by deep optical spectroscopy. The counterpart of GN20 was observed with the Deep Imaging Multi-Object Spectrograph (DEIMOS; Faber et al. 2003) on the Keck II telescope several times between 2004 and 2007, though only the final observations on UT 2007 April 1415 were in good conditions. The total integration time was 2.5 hr, and a 12 wide slit was oriented along the major axis of the galaxy (PA ). The 600ZD grating ( Å) was used, providing a resolution . The GG455 order-blocking filter was installed. We processed the data using a slightly modified version of the DEEP2 DEIMOS pipeline333See http://astron.berkeley.edu/cooper/deep/spec2d/..
The data show no emission lines while the continuum has a low per pixel, as expected given the faintness of the source () and its spatial extent of about 1.5′′, implying a low surface brightness. The emission is nevertheless clearly seen after smoothing the spectrum. We extracted the galaxy spectrum with apall under IRAF using a wide aperture. We measured the r.m.s. per pixel as a function of wavelength based on the sky spectrum. This information was used to properly weight pixels when binning by wavelength (e.g., to down weight noisy pixels affected by OH sky lines) and to accurately estimate the error of the binned spectrum. Given that for the Ly forest break would fall at 6145Å we included two spectral bins bracketing this wavelength to verify if a break is indeed present as expected. Fig. 7 (right panel) shows the results. Although the Keck spectrum only extends down to 5900Å, and therefore only one binning point is available with decent below the expected Ly forest break, we find that the spectrum strongly supports the redshift and in particular it reveals the presence of the expected Ly forest break. The flux density measurement blueward of the expected break corresponds to a Ly forest decrement of (derived using the stacked bins closer to the break), fully consistent to what is expected for the mean transmission of the intergalactic medium at (Songaila et al. 2004). When running a photometric redshift analysis on the binned Keck+DEIMOS data (Fig. 7, left panel) we see that of the possible CO line transition identifications, the redshift is unambiguously chosen with very high confidence.
3.2. GN20.2a
A nearby ( separation; 169 kpc proper at ) SMG companion to GN20 is GN20.2, first discovered by Chapman et al. (2001a)444Chapman et al. (2001a) used SCUBA to observe (and successfully detect) objects from a sample of optically faint radio sources with 25 mag. GN20.2, alias VLA J123708622201, was part of this survey.. GN20.2 has an 850m flux density of 9.9 mJy as reported by P06, that also identifies the most likely optical counterpart with a relatively bright radio source (Jy). This galaxy is also a B-drop (P06; Fig. 5) with a faint 24m flux density of Jy.
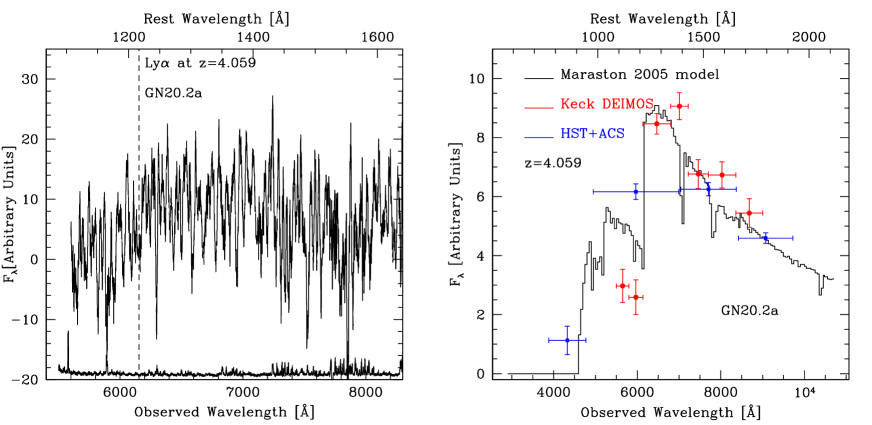
An analysis similar to the one performed in Sect.3.1 results in a photometric redshift of and a 90% confidence range within . Similarly, the analysis of the IR SED suggests a redshift of at the 99% confidence. This confirms that the overall properties of this source are compatible with being at the same redshift of GN20. This is further demonstrated by deep Keck+DEIMOS spectroscopy (2.5 hours) of this galaxy that was obtained in April 2005 during cirrus conditions, and reduced in the same way as for the GN20 observations (see Sect. 3.1.3). Fig. 9 shows that a strong spectral break is detected at about 6150Å, consistent with the location expected for the Ly forest break at a redshift of 4.055. The observed break corresponds to a Ly forest decrement , larger than the average expectations but still within the observed scatter in the intergalactic medium transmission at (Songaila et al. 2004). We constrain the redshift of this source to be (), based on fitting the Keck spectroscopy with the Maraston (2005) model shown in Fig. 9, demonstrating that this source is at a similar redshift of its brighter companion GN20. We conclude that also in this case the detected CO emission is CO[4-3] at , in good agreement with the Keck spectroscopy.
3.3. GN20.2b: redshift and contribution to the submm flux
The GN20.2b radio source is 3.4′′ from the GN20.2 SCUBA position of P06, closer than GN20.2a which is (although, we caution, that the SCUBA position of GN20.2 might be less accurate than for the average SMG, due to the brighter and nearby companion, GN20). The radio position is close (only 0.5′′ to the north) to a very faint galaxy () detected in the HST+ACS imaging (Fig.5). It is possible that this faint radio galaxy could be at the same redshift of GN20 and GN20.2a, and it could be contributing some of the submm flux detected at the position of GN20.2. We will discuss these two issues in turn in the following.
Although undetected in the F435W band, the faint ACS counterpart to GN20.2b is not formally classified as a -band dropout due to the upper limit in the F435W not being stringent enough, but its blue and red colors support the hypothesis that also this object is at . The galaxy is also fairly bright and red at IRAC wavelengths (SED peak at 8.0m with 20.93 mag) and is selected as a massive galaxy candidate in the work of Mancini et al. (2008). Inspecting the highest resolution IRAC imaging at 3.6m and 4.5m it appears that blending with a neighbouring source is somewhat affecting the Spitzer IRAC measurements and biasing the flux densities high (likely by at most a factor of 1.5–2). We used the radio-IR photometric redshift technique to constrain its redshift, in the assumption that the emission is dominated by star formation and not an AGN. We find that by itself, the large radio to 24m flux density ratio for this source strongly constrains its redshift to (99% confidence level), independently of how much it contributes to the 9.9mJy flux density at 850m. This is consistent with this object being an intrinsically very luminous, highly star forming galaxy at high redshift (although, in principle, the high ratio could be also due to radio-loud AGN emission from lower redshift). As discussed in Sect. 2.3, there is possible evidence for CO emission from this source, where a positive signal is found at the level. Although the situation is not secure as for the other two sources, we conclude that there is some supporting evidence for a similar redshift also for GN20.2b. Taking the CO signal at face value, we would assign a redshift of to GN20.2b, where the error corresponds to half the frequency range spanned by the tentative positive emission, if we identify that as CO[4-3]. This is within of the redshift of GN20 and GN20.2a, while our data is sensitive in principle to emission from a , 17 times larger redshift range of . We conclude that it is at least plausible that GN20.2b could be lying at a similar redshift of GN20.2a. In any case, this appear to be a fairly high redshift () galaxy.
Could GN20.2b be contributing some major fraction of the submm flux of GN20.2 ? Finding multi-component systems is not a new situation for SMG identification — e.g., SMMJ094303 (Tacconi et al. 2006) and GN19 (HDF242; Tacconi et al. 2008) are two cases where two-component systems, both radio detected, have been confirmed through CO observations. Dannerbauer et al. (2004), P06, Ivison et al. (2007), and Younger et al. (2008a) report other cases of submm/mm galaxies with two radio counterparts. If this is also happening in the present case of GN20.2 is not easy to assess quantitatively. We present below circumstantial evidences in favor or against this hypothesis.
The main supporting evidence is that its VLA 1.4 GHz radio continuum flux density is % that of GN20, which is similar to the ratio between the submm fluxes of the same two galaxies, suggesting that GN20.2b might be contributing some substantial flux, unless the radio emission is affected by an AGN. We notice though that GN20.2b is 5.5 times fainter in the VLA 1.4 GHz radio continuum than GN20.2a, but this is likely due to the fact that the radio emission of GN20.2a (even more than twice larger than that of GN20) is powered by an AGN, as discussed in the following section.
Evidences disfavoring instead a major submm flux contribution are the following. Comparing the 24m flux density measurements, we find that GN20.2b (only tentatively detected at 24m) is at least 2–3 times fainter at 24m than GN20.2a and at least 5.5 times fainter than GN20. Accounting also for blending, the flux density ratios are at most a factor of 2 for GN20.2b and about factors of 6–7 for GN20 and GN20.2a (Tab. 2). This is evidence for lower specific SFR in GN20.2b, suggesting that this galaxy has already passed its major peak of activity. Similarly, the ratio of the CO fluxes detected for GN20.2 and GN20.2a is roughly a factor of 2, similar to the ratio of submm fluxes between the two galaxies (Tab. 2). Even if the tentative CO emission of GN20.2b is real, this would still be at most half of the CO emission of GN20.2a (but, of course, there could be place for stronger CO emission if the galaxy lies outside of ). Given that the CO and bolometric luminosities of SMGs are known to correlate (Greve et al. 2005; Solomon & van den Bout 2005; see also Section 4), this could suggest that GN20.2a does account for most of the submm emission of GN20 from P06, and that GN20.2b could contribute at most some 30% of it but likely not much more. A final argument is that GN20.2 was originally discovered by Chapman et al (2001a) in photometry mode with SCUBA at JCMT, pointing at the position of the GN20.2a radio galaxy. This resulted in a submm flux density of that is fully consistent with the flux in the P06 map. GN20.2b is 6.8′′ away from GN20.2a and any emission from its position would have been close to the edge of the telescope primary beam, resulting attenuated by a factor of 2. Nevertheless, the Chapman et al (2001a) flux is actually slightly brighter than the flux in P06, although consistent within the errors. Accounting for the errors in the P06 and Chapman et al. (2001a) m flux density measurements, this suggests that GN20.2a does contribute at least half of the flux of GN20.2, and possibly most of it.

For completeness, we notice that an additional faint radio-detected galaxy is present just 1′′ North outside the edge of the SCUBA beam. This galaxy is a hard X-ray source in the castalog of Alexander et al. (2003), for which we derive a photometric redshift of . The radio and mid-IR emission of this object, if entirely due to star formation would correspond to about 100 M⊙ yr-1. This in turn would produce at most a submm flux of order of 1 mJy at 850m. Being at 8′′ from the P06 position and at 14′′ from the Chapman et al. (2001a) pointed observations, any potential submm emission from this galaxy would be negligible for the GN20.2 system 850m photometry.
In conclusion, our results suggest a scenario in which two counterparts might be contributing to the submm emission of GN20.2, GN20.2a and GN20.2b, although GN20.2a is likely accounting for most of the submm emission.
4. The physical properties of SMGs
4.1. Bolometric IR luminosities
Following the analysis described in Sec. 3.1.2, the radio-IR SED of GN20 is best reproduced with a CE01 library template corresponding to a luminosity of , redshifted to . However, the CE01 library implies a correlation between dust temperature and luminosity that is calibrated on observations in the local Universe but that might not necessarily hold at higher redshifts. In order to explore the uncertainties in the determination of GN20’s total IR luminosity due to possible SED temperature variations, we used again the CE01 library, but allowing this time for a free normalization of the templates when comparing to the observed fluxes, thus spanning the full range of dust temperatures in the library. For this exercise, we used the measurements or upper limits at 24m, 850m, 3.3mm and 20cm and included also the 1.1mm and 1.2mm measurements from Perera et al (2008) and Greve et al. (2008) and the 70m upper limit from Frayer et al. (2006). Integrating over the best fitting template yields in this way and a formal uncertainty from the fit at of less than 0.05 dex (the luminosity step in the CE01 library). The best fitting template has an intrinsic and is scaled up in luminosity by a factor of 16. This would correspond to an SED temperature of about 57 K, lower than those of CE01 templates of comparable luminosities . The same effect can be appreciated more directly in Fig. 10 where we show the m to 24m and radio flux density ratios. The GN20 flux density ratios are reasonably in line with CE01 predictions, although the 850m to radio flux density ratio is 80% higher than expected for the galaxy in the CE01 library. The effect is significant at the 2- level only, but indeed its SED is closer to the expected ratio. SMGs have been generally found to be somewhat colder than CE01 models, as a result of the selection at 850m (P06), so this result is not too surprising.
As a third estimate of the IR luminosity of GN20 we might use directly the radio-IR correlation (the other two estimates also used this correlation to fit the radio, although this was weighted together with all the other measurements). For its measured 1.4 GHz flux density of Jy, assuming a radio continuum with , we would derive . It is not obvious to decide which of the 3 estimates is more reliable but fortunately the measurements are very close, all within a range of less than 0.2 dex. In summary, we adopt the average value of for our best estimate and an uncertainty of 0.2 dex.
The 850m to VLA radio flux density ratio for GN20.2a is about lower than that for GN20 (Fig.10), implying a strong radio excess of a factor of . GN20.2a has a radio luminosity of W Hz-1 at 1.4 GHz rest frame, using again a radio continuum index . This demonstrates that a powerful radio-loud AGN is hidden in this source. Therefore, we cannot use the 1.4 GHz flux density to estimate its total IR luminosity. We used the CE01 library templates, with and without allowing for a free normalization, to fit the 24m, 70m, 850m and 3.3mm measurements or upper limits. Similarly to GN20, we find and , the latter being the ’free-normalization’ case that also prefers a lower temperature template. These estimates use the full 850m flux density measurements although some part of this might be due to GN20.2b. This also assumes that the AGN inside GN20.2a is not contributing substantially to the measured 24m and 850m flux densities. Pope et al. 2008 showed that this is generally the case at least for –3 SMGs. Given the uncertainties, we adopt the average of these two estimates and an uncertainty of about 0.3 dex.
This analysis implies that GN20 and GN20.2 are extremely luminous galaxies, with . Besides being among the most distant known SMGs, these are also some of the most luminous galaxies known so far. We use a Kennicutt et al. (1998) conversion of yr, expressed for the Chabrier 2003 IMF adopted in this paper. The IR luminosities correspond to SFRs of yr-1 if the IR emission is dominated by star formation. We note that neither the GN20 nor GN20.2a (or GN20.2b) counterparts are detected in the X-rays in the catalog of Alexander et al. (2003), although the radio emission does suggest the presence of an AGN inside GN20.2a. There is no clear evidence, instead, for the presence of an AGN inside GN20. If a top-heavy IMF is adopted, the implied SFR could also become significantly smaller.
| ID | ||||||
|---|---|---|---|---|---|---|
| K km s-1 pc2 | W Hz-1 | sin | ||||
| (1) | (2) | (3) | (4) | (5) | (6) | (7) |
| GN20 | ||||||
| GN20.2a | – |
Note. — Col. (1): Name of the object. Col. (2): total IR luminosities for GN20 and GN20.2a are derived by fitting the global IR SED using all available flux density measurements from 24 to 1.4 GHz with CE01 models. For GN20.2a, the 1.4 GHz measurement was not used, as it is affected likely by an AGN, and we attributed the whole 850m emission to this source. Typical errors are estimated to be of order of 0.2 dex and 0.3 dex for GN20 and GN20.2a, respectively. Col. (3): luminosity of the CO[4-3] transition. Col. (4): 1.4 GHz rest frame luminosities, estimated using a radio continuum index , ( is the luminosity distance). Col. (5): stellar masses are estimated from SED fitting from HST+ACS to Spitzer+IRAC photometry, using constant star formation rate models from Maraston (2005) and allowing for dust reddening with a Calzetti et al. (2000) law. Typical errors are found to be about 0.2 dex. Col. (6): molecular gas masses assume that the CO[1-0] and CO[4-3] transitions correspond to the same brightness temperature and a conversion factor (K km s-1 pc2)-1. Col. (7): the dynamical mass for GN20 is estimated following Solomon & van den Bout (2005) using (with velocity expressed in km s-1 and half light radius in pc).
4.2. CO luminosities and molecular gas masses
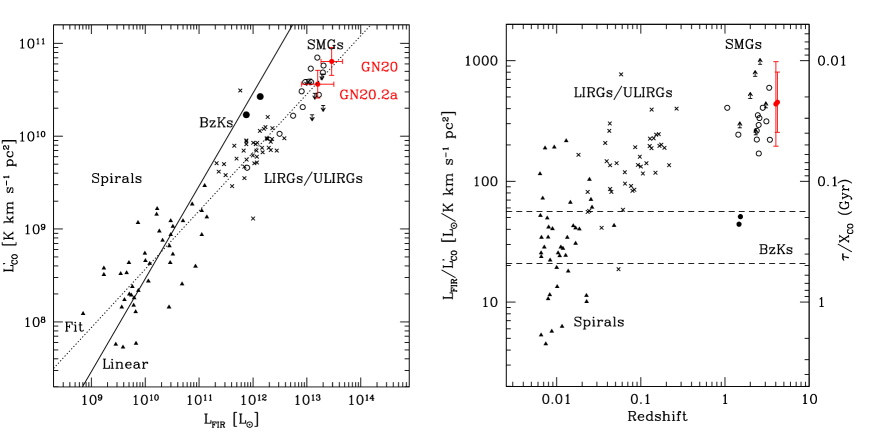
The observed CO[4-3] fluxes convert to luminosities of and , for GN20 and GN20.2, respectively. Fig.11 shows that these galaxies appear to lie close to the (non-linear) correlation between and traced by local ULIRGs and distant SMGs. In the assumption that the CO[1-0] and CO[4-3] transitions correspond to the same brightness temperature and assuming (K km s-1 pc2)-1 (Downes & Solomon 1998; Solomon & van den Bout 2005), the CO luminosities convert to total molecular gas masses of and for GN20 and GN20.2a, respectively. These might be regarded as lower limits as, in the case that the CO[4-3] transitions observed were not thermalized, the total CO luminosities and gas masses would be higher. VLA observations of CO[1-0] will be able to address this point.
At the observed SFR levels, the gas reservoirs would be exhausted in roughly 20–30 Myr (Fig.11). Similar timescales have been derived for –3 SMGs by Greve et al. (2005).
4.3. Dynamical and stellar mass estimates
The CO[4-3] emission from GN20 has a FWHM of 710 km s-1, matching well to the typical value of CO-detected SMGs at lower redshifts (Greve et al. 2005). From the higher resolution B configuration PdBI data alone we find that the CO line is marginally resolved spatially, with a FWHM of from Gaussian fitting of the uv visibilities performed within GILDAS. The possible extension of the source is supported by the fact that for point source extractions, the flux measured with the D-configuration data is higher than the one from the B-configuration data, a effect suggesting that the CO emission is starting to be resolved at the 1.3′′ resolution of our B-configuration data. This size matches well to the typical CO sizes of kpc for SMGs (Tacconi et al. 2006; 2008), and is roughly consistent with its UV extension as well (Fig. 5). Recently, Younger et al. (2008b) measured a size of for GN20 (Gaussian fitting), from the far-IR dust continuum emission at 890m with the Sub Millimeter Array, which is fully consistent with our CO size estimate. The velocity and size correspond to a total dynamical mass of including gas, stars and dark matter.
Given the molecular gas mass estimates, this corresponds to a molecular gas fraction of about 20%, similar to what is typically found for lower redshift SMGs (Greve et al. 2005). The stellar mass derived from SED fitting of the ACS to IRAC photometry is , expressed for a Chabrier (2003) IMF (see, e.g., Maraston et al. 2006 for more details on the range of models and assumptions implied). The combined molecular gas and stellar masses, only roughly half of which presumably fall within , add up to roughly 70-80% of the estimated dynamical mass, close enough within the large uncertainties of such estimates. This implies that the stellar mass is not highly overestimated for the choice of a Chabrier (2003) IMF and the case of a top heavy IMF is disfavored by the data.
For GN20.2a, we infer with a similar method a stellar mass of .
4.4. On the possibility of lensing
The intrinsic SFRs and luminosities of these sources might be lower if there is amplification by gravitational lensing (see Paciga & Scott 2008). Lensing by foreground structure could be an alternative way to interpret the fact that colder SEDs, typical of lower luminosity galaxies in the local Universe, seem to reproduce better the colors of the GN20 and GN20.2 galaxies. In that case, also the luminosity would match well to those of colder galaxies, without the need to advocate evolution in the temperature-luminosity relation of starburst galaxies. Some evidence against lensing is however provided by the FIR to CO properties of GN20 and GN20.2 (Fig. 11). If lensed by a factor of 10 or more, the de-lensed properties would place them in a region of the diagram corresponding to a very high star formation efficiency, not commonly observed for sources at high and low redshifts. Following the analysis discussed in Tacconi et al. (2008), the agreement between the dynamical mass estimate and its stellar and gas mass estimates also disfavors the possibility that GN20 is lensed by a very large factor, given that emission line FWHMs should be independent on magnification. Qualitatively, the same picture also holds for GN20.2a, for which the data suggest a CO[4-3] line FWHM km s-1 (albeit with a large error), not uncommon amongst SMGs (Greve et al. 2005).
4.5. The relation between stellar mass and SFR at
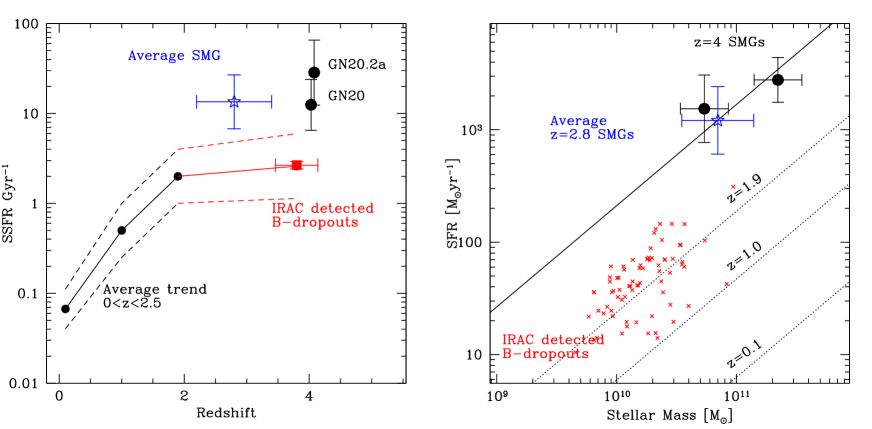
A tight correlation exists between the SFR and stellar mass of star forming galaxies from to , after excluding the locus of quiescent/passive galaxies (Elbaz et al. 2007; Daddi et al. 2007a; Noeske et al. 2007). The implication of this correlation remains subject to debate but suggests that, on average, the processes regulating the star formation activity of a galaxy are the same over a large range of stellar masses. Outliers do exist at both extremes in this correlation. On the low SFR side, the cloud of red-dead galaxies have SFRs lower than expected by several orders of magnitudes. On the high SFR side, ULIRGs and –3 SMGs exhibit approximately one order of magnitude larger SFRs for their stellar mass than the average galaxy of equivalent stellar mass (Daddi et al. 2007a; Elbaz et al. 2007). Here, following Daddi et al 2007a, we use the Tacconi et al. 2008 estimate of SSFR for –3 SMGs that are based on dynamical masses rather than stellar masses which should be a more robust derivation of the total galaxy masses, and we converted the average of the sample into M⊙ yr-1. Takagi et al. (2008) confirm higher SSFRs in SMGs, respect to normal galaxies of the same masses, using stellar mass estimates, although finding SSFRs a factor of 3 higher on average and a few possibly overlapping galaxies (see also Dannerbauer et al. 2006 for overlapping objects between the BzK and SMG samples). Their SFRs are based on the radio and assume a radio-IR correlation with a different normalization respect to the local one by a factor of about 2.
On the low side, the red-dead galaxies appear to fall short of SFR because of a lack of molecular gas fuel, possibly due to negative feedback, the excess SFR of –3 SMGs remains to be understood. A possible explanation is external triggering, e.g. by major mergers (Tacconi et al. 2006; 2008) as it is seen for local ULIRGs.
When compared to their closer –3 siblings, SMGs appear to be forming stars with an equivalently high SSFR. However, the stellar mass-SFR relation shows a continuous increase of SSFR with increasing redshift, which is expected due to the higher gas mass fractions at higher redshifts. The question therefore arises as to whether an SMG could represent the typical star forming galaxy at , contrary to their siblings which are atypical compared to the average galaxy at their cosmic epoch, having much larger SSFR, see Fig. 12.
In order to address this question, one needs to identify the locus of average star forming galaxies at and then compare it to the locus of SMGs. We consider the sub-sample of -band dropout Lyman break galaxies in GOODS-N with IRAC magnitudes at 5.8 and 8.0m brighter than 24. The requirement of an IRAC detection is necessary to reliably estimate the stellar masses. The use of -band dropouts ensures that we are concentrating on star forming galaxies, with a negligible contribution from passive galaxies. Within this limit, about 10% of the -band dropouts to are selected, or 77 sources. We fitted the ACS to IRAC SEDs of these B-band dropouts using Maraston (2005) models with constant star formation, allowing the redshift to vary freely within (the 95% confidence region expected for the redshift distribution of B-band dropouts) and allowing also for dust reddening following a Calzetti (2000) law. In this way, we estimated stellar masses and (basically UV-driven) SFRs for each of the B-band dropout Lyman break galaxy. Typical errors from the fit amount to factors of about 2 for both quantities. From this we derive an average stellar mass of and an average SFR of 40 yr-1. We performed stacking at 850m using the SCUBA super-map of Pope et al. (2005) and a technique identical to what was done in Daddi et al. (2005b; 2007a). We do not detect the galaxies, deriving a flux density limit of 0.54mJy, corresponding to 57 yr-1. From radio stacking, again performed with a similar technique to Daddi et al. (2005b; 2007a), we get a tentative detection with a peak flux of Jy. The radio upper limit corresponds to a SFR of 54 yr-1, consistent with the limit from submm stacking. Overall, the stacking limits appear to be consistent with the SFRs derived from SED fitting in these galaxies. This is similar to what found at where analogous estimates based on the UV luminosity of galaxies appear to agree well on average with mid- and far-IR estimates (Daddi et al. 2007a).
The locus of typical, massive B-band dropouts does not support a continuously increasing SSFR with redshift, suggesting instead a plateau of the SSFR for . The average SFR of 40 yr-1 places these ’typical’ galaxies fairly close to the correlation.
The -band dropout Lyman break galaxies exhibit an average stellar mass lower than the SMGs. This implies that not only do SMGs present similar SSFRs to their siblings, but they are also found to be outliers with respect to the average star-forming galaxy at their epoch. Note that the similarity of –3 and SMGs is also supported by their equivalently large FIR to CO ratios, corresponding to high star formation efficiencies and rapid gas consumption timescales.
We hypothesize that this favors a triggering mechanism for the activity of the SMGs, such as major mergers. Indeed, GN20.2a has a very nearby ( or 3.5 proper kpc at ) -band dropout companion (Fig. 5). GN20 has a clumpy morphology that could be reminiscent of a merger (although, see Bournaud et al. 2008). The 0.5′′ offset between the optical light peak and submm/radio and CO might also point to a complex geometrical situation often found among mergers (e.g., the Antennae; Wang et al. 2004). The high gas densities of a merging event could also explain why, contrary to what is found for typical massive galaxies at (Daddi et al. 2007a; Dannerbauer et al. 2006), the emitting region is completely opaque in the UV, similar to –3 SMGs. Indeed, we find that the radio-IR based SFR estimates of the SMGs are a factor of times larger than the UV-based ones.
5. A proto cluster of galaxies in GOODS-N centered around GN20 and GN20.2
Down to the limits of the GOODS-N observations of P06, the surface density of SMGs is deg-2, and thus the fact that GN20 and GN20.2 are only from each other, with a projected spatial distance of 169 physical kpc, and both are at , implies that these two SMGS are spatially clustered (see also Blain et al. 2004). This suggests that these SMGs might also be part of some type of larger, high redshift structure in GOODS-N.
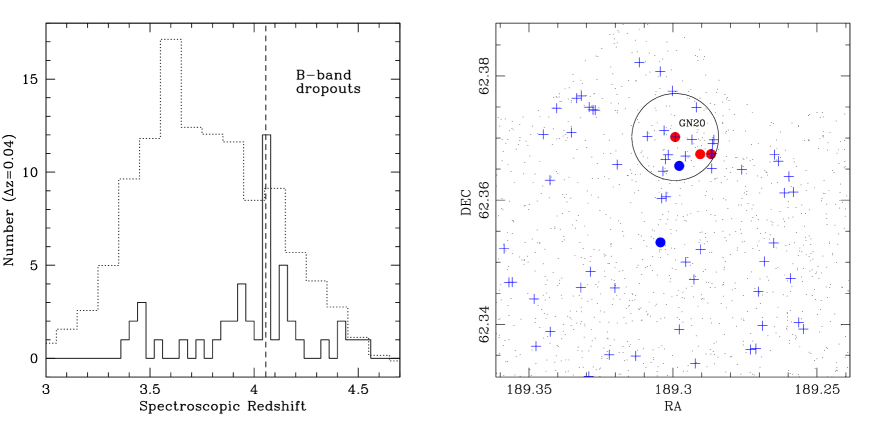
To investigate further this possibility, we have analyzed the distribution of spectroscopically confirmed Lyman-break galaxies at (-band dropouts) in GOODS-N (Fig. 13; Stern et al., in preparation). We compare the observed redshift distribution to the expected distribution function derived from simulations (Giavalisco et al. 2004b; Lee et al. 2006). There are 12 redshifts in the bin that includes GN20 (); these galaxies define a clear spike in the redshift distribution. There currently are 58 high quality spectroscopic redshifts of -band dropouts in the GOODS-N sample distributed over the range , 12 of which belong to the spike. This is a very strong concentration of galaxies, comparable, for example, to that discovered at by Steidel et al. (1998), and it seems unlikely that it can be the result of random (Poisson) sampling. We have generated a large () ensemble of random realizations of GOODS -band dropouts of the same size as the observed one using the expected redshift distribution function, and have counted how often a spike as large as the observed one is realized. In principle, one should also take into account the spatial clustering of -band dropouts in this simulation; in practice, however, the spatial correlation length, comoving Mpc, of these sources (Lee et al. 2006) is smaller than the radial distance covered by the redshift bin that we have adopted, comoving Mpc, implying that over these scales the spatial distribution of the galaxies can be approximated as Poisson.
We found no realization in which the number of galaxies in the redshift bin of GN20 equals or exceeds that of the observed spike, meaning that the probability to get a similar overdensity by chance is less than . The simulations show that the average number of galaxies in the 0.04 redshift bin is , implying that the observed spike corresponds to an overdensity of a factor of 8.4 and significant at the level. These redshift concentrations are frequently found among Lyman-break galaxies at . For example, similar concentrations are found in every survey field for -band dropouts by Steidel et al. (2003). Vanzella et al. (2007) also report evidence of concentrations in the redshift distribution of -band dropouts in the GOODS-South field.
To gain additional information about the nature of the GN20 structure, especially its transverse size, we have studied the distribution of the angular positions of -band dropouts in the field and around the GN20 complex. Of the 765 -band dropouts to in GOODS-N, counting all sources regardless of a spectroscopic identification, 14 are within 25′′ from GN20 (2.5 Mpc2 comoving; see Fig. 14). This is an overdensity of a factor of 5.4, the strongest concentration of -band dropout Lyman break galaxies being present in GOODS-N. Given that at these angular scales the angular correlation function of -band dropouts is non negligible (Lee et al. 2006), we account for the variance due to clustering to derive an expected r.m.s fluctuation in the counts in 25′′ radius apertures of about 1.8 galaxies. Therefore, the excess counts that we see in the 25′′ radius region surrounding GN20 correspond to a 5.8 fluctuation. Taken together with the analysis of the redshift spike, this leads us to conclude that the GN20–GN20.2 SMG pair is part of a very strong overdensity with a size consistent with a cluster of galaxies, most likely a proto-cluster given the redshift.
Additional evidence for the presence of a strong overdensity in this structure comes from Mancini et al. (2008), who use photometric redshifts to identify galaxy candidates at from an IRAC sample limited to . They find a total of 54 candidates in their full GOODS-N IRAC catalogs, which covers 180 arcmin2. Of these massive galaxies, four are within 25′′ from GN20 (GN20 itself, GN20.2a, GN20.2b and BD29079; all are shown in Fig. 5). This corresponds to an overdensity of a factor of 18 for this IRAC-selected sample, with a chance probability of assuming no spatial clustering (Poisson statistics; 0.16 galaxies expected on average and three observed in addition to GN20).
The possibility that we have uncovered a proto-cluster is reinforced by the fact that a number of massive galaxies appear to be part of this structure. With an estimated total baryonic mass of , GN20 is likely one of the most massive galaxies of this structure. The presence of over a dozen additional -band dropouts in this 2 Mpc2 spatial concentration implies a total baryonic mass reaching for the overdensity. If we assume the typical mass-to-light ratio of local massive clusters of (Lin, Mohr & Stanford 2003), this suggests a lower limit to the total (dark) mass of the proto-cluster of about .
These lines of evidence all support the identification of a large structure at redshift . While its transverse size appears to be around 2 Mpc (comoving) in diameter, its radial size remains basically unconstrained given that the errors on the redshift measurements are already comparable to the transverse size, not even considering peculiar motions along the radial direction. In addition, a significant overdensity at seems to be present extending over the whole GOODS-N field. This suggests that we are witnessing a proto-cluster of galaxies which, considering the incompleteness in all the samples we have been discussing, encompasses a total mass of .
It is interesting to compare the GN20 environment with other structures previously discovered at high redshift around powerful steep-spectrum radio galaxies (Kurk et al. 2000; Venemans et al. 2002; 2007; Miley & de Breuck 2008 and references therein). The most direct parallel is with the proto-cluster around TN J1338-1942 (De Breuck et al. 1999; Venemans et al. 2002) at . A study of the overdensity of -band dropout galaxies around this source has been performed by Miley et al. (2004), reporting factors of excess of Lyman break galaxies (significant at the ) level, depending on the spatial scale. This is fairly similar to what is found here for the overdensity around GN20. The field around TN J1338-1942 was also observed at 1.2 mm by de Breuck et al. (2004), finding an overdensity at mm wavelengths as well, although without spectroscopic confirmations so far.
Also, it is interesting to note that, contrary to the structure described by Chapman et al. (2008a) at where 5 SMGs are found but without a strong overdensity of UV selected galaxies, in this case the two SMGs that we have found at (and more SMGs might well be at in the GOODS-N field, see next Sect. 6) do appear to coincide with a strong overdensity of Lyman break galaxies as well.

| ID | zType | |||||
|---|---|---|---|---|---|---|
| GN01 | 2.415 | 2 | 2.45 | 2.05 | 2.65 | 8.43 |
| GN02 | 1.32 | 1 | 1.35 | 0.05 | 2.15 | 13.65 |
| GN03 | 2.2 | 0 | 1.90 | 0.05 | 2.30 | 7.46 |
| GN04a | 2.578 | 2 | 2.45 | 2.00 | 3.80 | 0.01 |
| GN04b | – | -1 | 3.70 | 2.40 | 9.35 | 0.00 |
| GN04.2 | 0.851 | 2 | 3.05 | 2.45 | 4.90 | 0.01 |
| GN05 | 2.21 | 2 | 2.05 | 1.25 | 2.35 | 1.79 |
| GN06 | 2.00 | 2 | 2.30 | 2.10 | 2.40 | 0.48 |
| GN07a | – | -1 | 3.65 | 3.35 | 4.10 | 25.56 |
| GN07b | 1.998 | 2 | 1.95 | 1.35 | 2.20 | 18.75 |
| GN09 | 2.9 | 0 | 13.42 | 2.90 | 15.50 | 18.63 |
| GN10 | 2.2 | 0 | 5.43 | 3.75 | 11.90 | 3.02 |
| GN11 | 2.3 | 0 | 2.45 | 2.20 | 2.60 | 17.89 |
| GN12 | 3.10 | 1 | 3.20 | 2.90 | 3.50 | 0.69 |
| GN13 | 0.475 | 2 | 1.30 | 1.05 | 1.65 | 4.15 |
| GN15 | 2.74 | 1 | 2.15 | 1.90 | 2.35 | 23.27 |
| GN16 | 1.68 | 1 | 2.50 | 2.40 | 2.60 | 12.74 |
| GN17 | 1.73 | 2 | 1.35 | 1.15 | 1.65 | 5.98 |
| GN18 | 2.8 | 0 | 2.50 | 2.25 | 2.70 | 1.43 |
| GN19a | 2.484 | 3 | 3.15 | 2.70 | 6.00 | 0.50 |
| GN19b | 2.484 | 3 | 1.35 | 0.05 | 2.10 | 5.23 |
| GN20 | 4.055 | 3 | 4.20 | 3.45 | 4.80 | 17.59 |
| GN20.2a | 4.051 | 3 | 3.70 | 3.35 | 4.05 | 21.27 |
| GN21 | 2.8 | 0 | 2.95 | 2.60 | 3.60 | 0.25 |
| GN22 | 2.509 | 2 | 2.95 | 2.60 | 3.50 | 1.21 |
| GN23 | 2.6 | 0 | 2.95 | 2.55 | 3.35 | 1.48 |
| GN24 | 2.91 | 1 | 2.15 | 0.10 | 2.70 | 5.16 |
| GN25 | 1.013 | 2 | 1.15 | 0.35 | 1.40 | 1.48 |
| GN26 | 1.223 | 3 | 1.82 | 1.50 | 1.95 | 13.94 |
| GN28 | 1.020 | 2 | 2.95 | 2.55 | 14.60 | 10.38 |
| GN30 | 1.355 | 2 | 2.15 | 1.45 | 2.45 | 0.37 |
| GN31 | 0.935 | 2 | 0.90 | 0.05 | 1.30 | 8.86 |
| GN32 | 1.9 | 0 | 1.75 | 0.05 | 2.35 | 4.84 |
| GN37 | 3.190 | 2 | 2.90 | 0.10 | 15.50 | 1.89 |
| LE850.1 | 2.60 | 1 | 2.30 | 2.10 | 2.80 | 10.65 |
| LE850.4 | 2.60 | 1 | 6.18 | 3.00 | 15.50 | 0.02 |
| LE850.7 | 1.80 | 1 | 2.20 | 1.95 | 2.45 | 1.18 |
| LE850.8b | 3.00 | 1 | 2.10 | 1.35 | 2.55 | 2.96 |
| LE850.8a | 0.974 | 2 | 0.93 | 0.05 | 6.20 | 14.83 |
| LE850.14b | 2.50 | 1 | 2.35 | 2.05 | 3.05 | 0.56 |
| LE850.14a | 2.380 | 2 | 2.55 | 1.45 | 4.35 | 0.01 |
| LE850.18 | 2.690 | 2 | 2.45 | 1.95 | 3.15 | 0.28 |
| LE850.35 | 3.00 | 1 | 2.40 | 1.85 | 2.80 | 1.11 |
| Capak | 4.547 | 3 | 3.97 | 3.00 | 5.20 | 0.22 |
Note. — GN galaxies are from P06. LE850 galaxies are from Egami et al. (2004). The last object is from Capak et al. (2008). ’zType’ indicates the origin of stellar photometric redshifts (): 0 for Spitzer+IRAC/MIPS photometric redshifts (P06), 1 for ordinary photometric redshifts from stellar emission, 2 for spectroscopic redshifts (usually optical/UV redshifts or Spitzer IRS redshifts derived mainly from detection of PAH features), 3 for CO redshifts. The CO redshifts for GN19a and GN19b are from Tacconi et al. (2008), the one for GN26 is from Frayer et al. (2008), those for GN20 and GN20.2a are from this paper. Some of the P06 photometric redshifts listed in P06 were slightly off; here we list the correct values. New spectroscopic redshifts for three P06 galaxies were measured with IRS in Pope et al. (2008). Ranges in are given at the 99% confidence level () following Avni et al. (1976) for a single interesting parameter in the fit (e.g., redshift). For the cases of double components we assigned the total submm flux to each component while computing the photometric redshift. The photometric redshifts listed here for the GN20 and GN20.2a galaxies did not use the 3.3mm continuum measurements, for consistency with the rest of the galaxies.
6. Radio-IR photometric redshifts for SMGs
An important result of this paper is the success in identifying the redshifts for the GN20 and GN20.2 galaxies based only on the flux measurements at 24m, 850m, and 20cm. The ratio of 20cm to 850m flux density is, alone, a powerful redshift indicator for dusty submm galaxies (Carilli & Yun 1999; 2000)555We applied this redshift indicator to the counterparts of the two SMGs presented here. For GN20, we obtain . For GN 20.2a, we obtain and for GN 20.2b we obtain . The low photometric redshift obtained for GN 20.2a indicates that the radio emission must be contaminated by an AGN, which substantially affects the Carilli & Yun indicator., although limited in its application by its strong dependence on SED temperature. Clearly, colder galaxies (P06) are intrinsically brighter at 850m at fixed radio flux density and redshift (e.g., P06). In our approach, however, we have exploited the 24m measurement that lies on the opposite side of the SED peak. It turns out that for the variations in the shape of local SEDs (as codified in the CE01 library) the m to 24m flux density ratio is fairly constant at fixed redshift, compared to the redshift excursion of its value (Fig. 15) — e.g., this ratio changes by factors of at fixed redshift, while changing the bolometric luminosity by a factor of 10. However, at fixed this ratio changes by almost four orders of magnitude when going from to (Fig. 15). Note that we have not re-normalized the CE01 template models when fitting observed data from the GN20 and GN20.2 galaxies (Fig. 15; bottom panel). This information is a powerful complement to the flux density ratios, as it helps pinpoint the correct intrinsic source luminosities, thus helping to solve dust temperature degeneracies, assuming that the local correlations between temperature and luminosity measured by CE01 and the radio-FIR correlation are not severely altered in the distant universe. As a result, the photometric redshift estimates based on IR and radio appear to be robust against SED temperature/shape variations, as shown by the case of GN20 and its possibly colder SED (Fig. 8 and 10).
Encouraged by the apparent success of this technique, we explored in more detail the possibility of deriving accurate radio-IR photometric redshifts using mid-IR, submm, and radio observations. We applied this technique to the sample of well-studied SMGs in GOODS-N (P06) and the Lockman Hole (Scott et al. 2002; Ivison et al. 2002; Egami et al. 2004), considering only the most likely counterparts. Our radio-IR photometric redshifts are determined as described in Sect. 3.1.2 for GN20. In particular, in order to effectively use the 850m information in the fit, we limit the of the 24m and 20cm flux density to a maximum of 10, artificially increasing the relative error bars if the is higher. Table 4 summarizes the radio-IR photometric redshift constraints.
Results of the comparison are in Fig. 16. In the left panel, we show SMGs with counterparts having a measured spectroscopic redshifts. The agreement between radio-IR photometric redshifts and spectroscopic redshifts are in general fairly good, with a semi interquartile range of . This figure includes also the Capak et al. (2008) source (assuming a ratio of 2.8 between the 850m and 1.2mm flux densities), but the result does not change substantially if this one is excluded.

We identify three galaxies as being suspect counterparts to the
submm emission based on their 99% confidence error bars falling
outside the median photometric redshift relationship (Fig. 15).
These three galaxies are from the P06 sample, and they are all
characterized by being at separation or more from the
SCUBA position. Given that P06 finds a median separation of
for secure counterparts, with 80% being at 666Dannerbauer
et al. (2004) also finds a median separation of 3′′ for the radio
counterparts of MAMBO sources, with a similar percentage of radio
counterparts being separated by less than 4.5′′., the large
offsets alone suggest that the counterpart identification might
have actually failed for these objects. Only three out of 43 targets
are identified as such, and two of these were already listed as
tentative counterparts, confirming the high quality of counterpart
identification in the original work. We discuss these three objects
here in some detail:
GN13: the counterpart in P06 is a
galaxy at lying at from the submm position.
The identification was judged to be secure, on the basis of the low
probability of a chance association between a radio and mid-IR
bright source relative to the submm position. Its 850m flux
density of 1.9 mJy, despite being quite faint intrinsically, is
about six times brighter than expected on the basis of both the
24m and 20cm radio flux densities for its redshift, assuming
the CE01 templates. We inspected the other galaxies present in the
submm beam, and found no other convincing counterpart. This SMG
could be at quite high redshift.
GN04.2: the counterpart
listed by P06 is at and from the submm
position. The 24m and radio flux densities are both too faint
to be consistent with the 850m flux density of 2.7 mJy at this
redshift, assuming the CE01 templates. Furthermore, this source
is no longer detected in the latest and deepest 20cm reduction
(Morrison et al., in preparation); the P06 results were based on a
detection at 20cm. No other 24m detected galaxy is
present in the beam, which may imply that the real counterpart is
at fairly high redshift.
GN28: the counterpart listed
by P06 is at and at from the submm
position. There is a strong inconsistency between the faint 24m
flux density of this galaxy (20.5Jy) and its 850m emission
(1.7 mJy). The 850m to 24m ratio is two orders of magnitude
larger than expected for starforming galaxies at
(Fig. 15); and would be even more discrepant for an
AGN SED. The 20cm radio position is close to the radio lobes of a
bright radio galaxy at a similar redshift, and thus may be severely
contaminated. No other 24m detected galaxy is present in the
beam, which may also imply that the real counterpart is at fairly
high redshift.
When excluding these three likely incorrect counterparts, we find and a semi-interquartile range of .
The right panel of Fig. 16 shows the comparison of the
radio-IR photometric redshifts with those counterparts of SMGs from
the same works that have only photometric redshift estimates based
largely on the stellar emission (plus the IRAC to MIPS colors in a
few cases from P06). Again, the agreement is quite good, with a
similar . We find only two cases of
widely discrepant estimates, discussed here in some detail:
GN10: P06 assign a photometric redshift, while
we find at the 99% confidence level, in good agreement
with Wang et al. (2007; 2008) and Dannerbauer et al. (2008). The
discrepancy is likely due to the photometric redshift of P06 being
too low, while the counterpart identification appears correct and
agrees with Wang et al. (2007; 2008) and Dannerbauer et al. (2008).
GN16: The P06 identification appears correct, and the
discrepancy is due to the low photometric redshift () estimate of P06.
| ID | RA(J2000) | DEC(J2000) | ||||
|---|---|---|---|---|---|---|
| (Jy) | (Jy) | (Jy) | (Jy) | |||
| VLA 512 | 12:36:58.49 | 62:09:31.8 | 47.3 11.5 | 36.8 5.0 | ||
| VLA 812 | 12:35:53.24 | 62:13:37.5 | 45.6 5.1 | 33.0 6.2 | ||
| VLA 966 | 12:37:01.52 | 62:20:24.6 | 64.2 5.3 | 49.7 3.6 |
We have also applied the radio-IR photometric redshift technique to the CO-detected SMG galaxy reported by Capak et al. (2008) and Schinnerer et al. (2008) to be at . The resulting photometric redshift is and the 99% confidence range is , supporting the redshift identification of this SMG despite the large offset (; kpc proper) between its Ly emitting optical counterpart and the radio emission.
In conclusion, we find that radio-IR photometric redshifts can be used as a powerful and independent complement to photometric redshifts derived from stellar emission, and could greatly improve the SMG counterpart identification process. Some differences and evolutionary trends are seen when studying the SEDs of SMGs in detail (e.g., Pope et al. 2006; 2008). However, the fact that direct fitting of locally-derived CE01 templates yields reasonable photometric redshifts without any significant bias with respect to redshift suggests that ULIRGs SEDs have not dramatically evolved from to .
7. The selection and space density of the highest redshift starburst galaxies
We emphasize that not all radio faint (e.g., Jy) counterparts to SMGs are likely to be at . For example, four SMGs (GN03, GN11, GN14 (HDF 850-1), GN18) have even fainter radio flux densities than GN10 and have similar properties to GN10 at other wavelengths, e.g. they are undetected in ACS imaging and have red IRAC SEDs. Dannerbauer et al. (2008) suggest they could lie at . In contrast, the radio-IR photometric redshifts suggest that GN03, GN11 and GN18 are at , which is still consistent with their IRAC SEDs. This is because these galaxies have quite bright m flux densities, much larger than the radio ones. Besides GN20, GN20.2a and GN20.2b, only four additional objects from P06 are identified by the photometric redshift technique to possibly be at . With various degrees of confidence, they are GN10, a very solid source also identified by Wang et al. (2007; 2008) and Dannerbauer et al. (2008), and GN13, GN28 and GN04.2 (where reliable counterparts are, however lacking, thus making these less convincing candidates). Another well known candidate from GOODS-N is the galaxy HDF850.1 (Dunlop et al. 2004), listed as GN14 in P06 for which we have not obtained a radio-IR photometric redshift due to the lack of reliable radio and 24m data. This would make a total of eight plausible SMGs in GOODS-N in a total area of roughly arcmin2 covered with SCUBA (with a highly inhomogeneous coverage; see, e.g., Pope et al. 2005), or roughly galaxies deg-2. Using the volume in , this corresponds to a space density of Mpc-3, which compares fairly well with the expectations for the very high redshift formation of the oldest early type galaxies seen at (see Sect. 1). With typical SFRs in excess of thousand yr-1, such a population contributes an SFRD of order of yr-1 Mpc-3, already comparable to the global contribution of Lyman break galaxies at these redshifts (Giavalisco et al. 2004b).
7.1. A radio/24m selection criterion for high- starburst galaxies
For the most reliable starbursts (GN10, GN20, GN20.2a) we notice that all of these have very high 20cm to 24m flux density ratios, greater than about 1 (Fig. 15). GN20.2b itself satisfies such a criterion and might also be at . This suggests that a criterion could be useful at singling out the very high redshift tail of SMGs. Applying this criterion to the P06 sample we recover the SMGs listed above, plus GN12, GN16 and GN19a, all sources at , a distribution clearly skewed to higher redshifts than typical SMGs. The galaxy from Capak et al. (2008) also satisfies this criterion.
In principle, this simple criterion could be applied regardless of a submm detection, and could avoid the inherent bias toward intrinsically cold sources. Of course, care should be taken and a careful analysis of all multiwavelength information should be performed on targets selected in this way, as radio emission from radio-loud AGN would bias the radio to 24m flux density ratio. Mid-IR as well can be boosted by AGNs, which could make genuine objects fail this criterion. More importantly, given the relatively small dynamic range expected over redshift for the 20cm to 24m flux density ratios in galaxies (Fig. 15), scatter due to SED variations can imply a substantial contamination from lower redshift sources.
We have performed a preliminary test of this criterion with a sample
of radio selected galaxies with Jy in GOODS-N
(Morrison et al., in preparation), applying a simple but very
conservative approach. By requiring , 63 radio sources are retained. Only half of these
(34) are undetected in the ACS F435W band (), a necessary
condition for being at . Of these, 16 are also consistent
with a red IRAC SED, with a peak beyond m, as expected for
777The Capak et al. (2008) galaxy does not satisfy
this requirement. The authors suggest that line emission contaminate
the IRAC photometry for this source. A possible alternative is that
the IRAC flux detected is actually from a foreground, lower redshift
galaxy. This would imply that the SMG is very faint even at the
IRAC bands, perhaps similar to GN10.. We further require relatively
blue Spitzer+MIPS to IRAC flux density ratios: and , as observed in the bona-fide sample (GN20,
GN20.2a, GN20.2b, GN10), leaving us with 11 galaxies. This excludes from
the sample the radio source from Waddington et al. (1999),
where the near-IR to mid-IR spectral range is likely dominated by
a powerful AGN. Finally, we exclude all sources detected in the X-ray catalog
of Alexander et al. (2003)
which, if at , must be AGN dominated. This leaves us
with seven sources, including the three reliable galaxies
already known (GN20, GN20.2a, GN10) plus GN20.2b. We consider the
properties of the three new candidates in detail:
VLA 512:
this object is undetected in a relatively shallow region of the
SCUBA supermap. However, some signal is found at its position with
mJy () in an AzTEC map of GOODS-N
(G. Wilson, private communication). This source has no counterpart
at any ACS band, and is a good high redshift starburst candidate.
VLA 812: this galaxy is very close to the edge of the
SCUBA supermap, where the noise is fairly high. However, this source
is listed in Chapman et al. (2005) as a SCUBA detection in photometry
mode (mJy), with a redshift of
(the source is also detected by Perera et al. 2008 and Greve et al. 2008
at 1.1mm and 1.2mm with MAMBO and AzTEC, respectively).
We find that a relatively bright galaxy is present in the
area, but 2′′ away from the IRAC and radio position, which
corresponds instead to a faint galaxy with ACS photometry of and , undetected at - and
-band. We suggest that the Chapman et al. (2005) redshift
identification does not correspond to the actual counterpart of the
radio and submm emission. This radio source is a reliable candidate
for a very high redshift starburst ().
VLA 966:
we place a 3 upper limit of mJy from
the SCUBA supermap at the position of this source. Its optical
counterpart is a -band dropout with and red IRAC SED,
confirming that this is a reliable candidate. The VLA
radio flux density of this source is comparable to that of GN20.
The lack of submm emission could signal a warmer SED (see, e.g., Chapman et al. 2008b).
We notice that, due to the very conservative requirements applied, we finally retained only 3 galaxies of the 63 selected down to 30Jy in GOODS-N with our radio/24m criterion as bona-fide starburst galaxy candidates. We believe that we efficiently rejected in this way all contamination from AGN dominated radio galaxies. Several of the discarded galaxies are though most likely to be starbursts at , still very interesting objects but beyond the scope of the simple exercise described in this Section where we focus on the redshift tail. We are likely also missing several other genuine starburst, due to the very strict requirements that we have applied. E.g., that of a distinct peak in IRAC beyond m that can be weak or washed out due to the noise to the levels of our data; or that of X-ray non detections, powerful starbursts can well contain some unobscured AGN sometimes that doesn’t necessarily affect much the radio emisson. Given the promising results of this attempt, we will defer to future work an investigation of the properties of the full sample of galaxies selected with this radio/24m criterion.
Although we by no means claim to have selected a complete sample, the existence of these three additional starburst candidates reinforces our conclusion that a substantial population of vigorous star-forming galaxies was already present at early epochs.
7.2. Predictions for future Herschel surveys
We now consider expectations for forthcoming Herschel surveys to detect very high redshift starbursts. Herschel will obtain FIR imaging with an unprecedented sensitivity at 70m, 100m and 160m with PACS (Poglitsch et al. 2006) and at 250m, 350m and 520m with SPIRE (Griffin et al. 2007) .
We computed the expected flux densities of GN20 in the Herschel bands, based on various assumptions. Using the best fitting unscaled CE01 model shown in Fig. 8, we predict flux densities of about mJy in the SPIRE bands, 24 mJy at 160m, 4.8 mJy at 100m and 1.8 mJy at 70m. The latter value is comparable, but still consistent, with the Spitzer 70m upper limit. If these predictions are correct, galaxies similar to GN20 should be very easily detectable with Herschel, e.g., over the full 70 deg2 survey of the Hermes guaranteed time consortium888http://astronomy.sussex.ac.uk/sjo/Hermes/., which could yield hundreds hyperluminous infrared galaxies. Even if we used a colder template following Fig. 10, normalized conservatively at a 1 lower 850m flux density of 17 mJy, we would still predict flux densities of about 30 mJy at 350m and 520m, which is still above the expected flux limit of the 70 deg2 Hermes survey.
This suggests that, while strongly limited by confusion to quite bright flux densities ( mJy; Le Borgne et al. 2008), the Herschel SPIRE observations will efficiently detect a significant tail of very high redshift () starbursts. Due to the relation between redshift and 850m flux density (Ivison et al. 2002; Pope et al 2006), Herschel might detect the bulk of the most active merger-powered galaxies in the distant universe, and possibly accounting for an important fraction of the SFRD in the early universe. Clearly, a real challenge will be to recognize such very high redshift galaxies in the Herschel-selected samples, which will require deep multi-wavelength information.
8. Summary and Conclusions
The serendipitous detection of CO emission lines at from deep PdBI observations allowed us a first investigation of the nature and properties of vigorous star forming galaxies at these redshifts. The main results of this paper can be summarized as follows:
-
•
CO emission lines are detected at the position of two bright SMGs in the GOODS-N field: GN20 and GN20.2a. A tentative CO signal is seen for an additional radio galaxy in the field, named GN20.2b.
-
•
We identify the lines of GN20 and GN20.2a as CO[4-3] at . A concordant identification is obtained when comparing optical photometric redshifts, ACS dropout color selection, radio-IR photometric redshifts, and optical spectroscopy from Keck.
-
•
Dust continuum at 3.3mm (0.65mm rest frame) is significantly detected for GN20, the first such a measurement in a distant starburst galaxy.
-
•
We show that reliable radio-IR photometric redshifts (to ) can be derived for these galaxies using only the photometry at 24m, 850m, 3.3mm and radio 20cm and CE01 models. This implies that local models can be used to provide a reasonable description of the galaxies.
-
•
However, evidence is also found for these SEDs being somewhat colder than those of local galaxies of the same luminosities, confirming the results of P06 for lower redshift objects. In addition, the strong radio flux density of GN20.2a is taken as evidence for the presence of an AGN in this galaxy.
-
•
The IR to radio SEDs suggest very high IR luminosities of 2.9 and 1.6 for GN20 and GN20.2, respectively. The CO emission lines imply molecular gas masses of 5 and 3 for GN20 and GN20.2, respectively. For GN20 we could derive an estimate of the dynamical mass of order of 2, implying molecular gas fraction of order of 20% (or larger if the CO[4-3] transition is not thermalized).
-
•
The FIR to CO properties and SSFRs of these SMGs are similar to SMGs at lower redshift, .
-
•
Radio and submm stacking of -band dropout galaxies, together with the SED fitting of the ACS to IRAC SEDs, is used to show that typical starforming galaxies have much lower SSFRs than SMGs at the same redshift. This suggests that the stellar mass-SFR correlation does not evolve much further in normalization beyond .
-
•
The GN20 and GN20.2 SMGs appear to live at the center of a strong sky overdensity of galaxies (with an apparent size of comoving Mpc), and a very significant redshift spike is seen over the full GOODS-N area, consistent with a proto-cluster. It is tantalizing to speculate that this overdense environment might be playing a role in triggering such extreme star formation activity (see, e.g., Elbaz et al. 2007; Chapman et al. 2008b).
-
•
Applying the newly defined radio-IR photometric redshift technique to the full sample of SMGs selected in the GOODS-N and Lockman Hole fields, we find that this provided estimates with a typical accuracy of . This is starting to approach the accuracy obtainable from optical photometric redshifts (; e.g., Brodwin et al. 2006).
-
•
Using this photometric redshift technique, we identify a small sample of galaxies in GOODS-N whose counterpart identification had likely failed in previous works. Lacking an obvious counterpart within the SCUBA beam, these SMGs could be at quite high redshift.
-
•
A total of up to eight SMGs in GOODS-N (including GN20, the two counterparts of GN20.2, GN10, HDF850.1, GN13, GN28, GN04.2) are found consistent with being at . This implies a space density of similar sources around Mpc-3 and a sizeable contribution to the cosmic SFRD at of order of yr-1 Mpc-3. This is similar to that of UV-selected galaxies at the same redshifts.
-
•
We find that the GN20, GN20.2a and GN20.2b galaxies and the most secure SMG candidates satisfy the simple criterion . By applying this criterion, with additional conservative constraints from optical, near-IR and mid-IR photometry, to a sample of VLA 20cm selected galaxies in GOODS-N, we identify three additional galaxies that appear to be reliable starburst galaxy candidates. A posteriori, two of the three are found to have a detection at submm/mm wavelengths as well.
-
•
Given the expected FIR fluxes of these galaxies, future surveys with Herschel should allow us to characterize the properties of this population in detail.
References
- (1) Alexander D. M., et al., 2003, AJ, 126, 539
- (2) Appleton, P., et al. 2004, ApJS, 154, 147
- (3) Archibald, E. N., et al. 2001, MNRAS, 323, 417
- (4) Avni Y., 1976, ApJ, 210, 642
- (5) Aretxaga I., et al., 2007, MNRAS, 379, 1571
- (6) Aretxaga I., Hughes D. H., Chapin E. L., Gaztañaga E., Dunlop J. S., Ivison R. J., 2003, MNRAS, 342, 759
- (7) Aretxaga I., Hughes D. H., Dunlop J. S., 2005, MNRAS, 358, 1240
- (8) Bouche, N., et al. 2007, ApJ, 671, 303
- (9) Blain, A. W., & Longair, M. S, et al. 1993, MNRAS, 264, 509
- (10) Blain, A. W., et al. 2002, Phys. Rep., 369, 111
- (11) Blain A. W., Chapman S. C., Smail I., Ivison R., 2004, ApJ, 611, 725
- (12) Bolzonella M., Miralles J.-M., Pelló R., 2000, A&A, 363, 476
- (13) Bournaud F., et al., 2008, A&A, 486, 741
- (14) Brodwin M., et al., 2006, ApJ, 651, 791
- (15) Calzetti, D., Armus, L., Bohlin, R. C., et al. 2000, ApJ, 533, 682
- (16) Capak P., et al., 2008, ApJ, 681, L53
- (17) Carilli C. L., Yun M. S., 1999, ApJ, 513, L13
- (18) Carilli C. L., Yun M. S., 2000, ApJ, 530, 618
- (19) Chary, R. & Elbaz, D., 2001, ApJ, 556, 562
- (20) Cimatti A., et al., 2004, Nature, 430, 184
- (21) Cimatti A., et al., 2008, A&A, 482, 21
- (22) Chabrier G., 2003, ApJ, 586, L133
- (23) Chapman S. C., Richards E. A., Lewis G. F., Wilson G., Barger A. J., 2001a, ApJ, 548, L147
- (24) Chapman S. C., Lewis G. F., Scott D., Richards E., Borys C., Steidel C. C., Adelberger K. L., Shapley A. E., 2001b, ApJ, 548, L17
- (25) Chapman, S. C., Blain, A. W., Ivison, R. J., Smail, I. R., 2003, Nature, 422, 695
- (26) Chapman, S. C., Blain, A. W., Smail, I. R., Ivison, R. J.,2005, ApJ, 622, 772
- (27) Chapman, S. C., et al., 2008a, ApJ in press (arXiv:0809.1159)
- (28) Chapman, S. C., et al., 2008b, ApJ in press (arXiv:0807.3674)
- (29) Clements D. L., et al., 2008, MNRAS, 387, 247
- (30) Condon, J. J., 1992, ARA&A, 30, 575
- (31) Daddi, E., et al. 2004a, ApJ, 600, L127
- (32) Daddi, E., Cimatti, A., Renzini, A., et al. 2004b, ApJ, 617, 746
- (33) Daddi E., et al., 2005a, ApJ, 626, 680
- (34) Daddi, E., Dickinson, M., Chary, R., et al. 2005b, ApJ, 631, L13
- (35) Daddi, E., et al. 2007a, ApJ 670, 156
- (36) Daddi, E., et al. 2007b, ApJ 670, 173
- (37) Daddi, E., et al. 2008, ApJ 673, L21
- (38) Dunlop, J., et al. 2004, MNRAS, 350, 769
- (39) Dannerbauer, H., et al. 2002, ApJ, 573, 473
- (40) Dannerbauer, H., et al. 2004, ApJ, 606, 664
- (41) Dannerbauer, H., et al. 2006, ApJ, 637, L5
- (42) Dannerbauer, H., Walter, F. & Morrison G., 2008, ApJ, 673, L127
- (43) De Breuck C., van Breugel W., Minniti D., Miley G., Röttgering H., Stanford S. A., Carilli C., 1999, A&A, 352, L51
- (44) De Breuck, C., et al. 2004, A&A, 424, 1
- (45) Downes, D., Solomon, P. M., 1998, ApJ, 507, 615
- (46) Egami, E., et al. 2004, ApJS, 154, 130
- (47) Elbaz D., Cesarsky C. J., Chanial P., Aussel H., Franceschini A., Fadda D., Chary R. R., 2002, A&A, 384, 848
- (48) Elbaz, D., et al. 2007, A&A, 468, 33
- (49) Faber S. M., et al., 2003, SPIE, 4841, 1657
- (50) Frayer D. T., et al., 2006, ApJ, 647, L9
- (51) Frayer D., et al., 2008, ApJ, 680, L21
- (52) Garrett M. A., 2002, A&A, 384, L19
- (53) Giavalisco, M., Ferguson, H.C., Koekemoer, A., et al. 2004a, ApJ. 600, L93
- (54) Giavalisco, M., Dickinson, M., Ferguson, H.C., et al. 2004b, ApJ. 600, L103
- (55) Greve, T. R., et al. 2005, MNRAS, 359, 1165
- (56) Greve, T. R., et al. 2007, MNRAS, 382, 48
- (57) Greve T. R., Pope A., Scott D., Ivison R. J., Borys C., Conselice C. J., Bertoldi F., 2008, MNRAS, 389, 1489
- (58) Griffin M., et al., 2007, AdSpR, 40, 612
- (59) Hughes D. H., et al., 2002, MNRAS, 335, 871
- (60) Iono D., et al., 2006, ApJ, 640, L1
- (61) Ivison, R. J., et al. 2002, MNRAS, 317, 1
- (62) Ivison, R. J., et al. 2005, MNRAS, 364, 1025
- (63) Ivison R. J., et al., 2007, MNRAS, 380, 199
- (64) Kennicutt, R. C., Jr., 1998, ARA&A, 36, 189
- (65) Kong X., et al., 2006, ApJ, 638, 72
- (66) Knudsen, K. K., et al. 2006, astro-ph/0604073
- (67) Kreysa, E., et al. 1998, A&A, 379, 823
- (68) Kriek M., van der Wel A., van Dokkum P. G., Franx M., Illingworth G. D., 2008, ApJ, 682, 896
- (69) Kurk, J. D., et al. 2000, A&A, 358, L1
- (70) Labbé I., et al., 2005, ApJ, 624, L81
- (71) Le Borgne D., et al., 2008, submitted to A&A
- (72) Lee K.-S., Giavalisco M., Gnedin O. Y., Somerville R. S., Ferguson H. C., Dickinson M., Ouchi M., 2006, ApJ, 642, 63
- (73) Lehmann, I., et al. 2001, A&A, 371, 833
- (74) Lin Y.-T., Mohr J. J., Stanford S. A., 2003, ApJ, 591, 749
- (75) Longhetti M., et al., 2007, MNRAS, 374, 614
- (76) Mancini C., et al., 2008, A&A in press
- (77) Maraston C., 2005, MNRAS, 362, 799
- (78) Maraston C., Daddi E., Renzini A., Cimatti A., Dickinson M., Papovich C., Pasquali A., Pirzkal N., 2006, ApJ, 652, 85
- (79) McCarthy P. J., et al., 2004, ApJ, 614, L9
- (80) Miley G. K., et al., 2004, Nature, 427, 47
- (81) Miley G., De Breuck C., 2008, A&ARv, 1
- (82) Noeske, K. G., et al. 2007, ApJ, 660, L43
- (83) Paciga G., Scott D., 2007, MNRAS, submitted (arXiv:0801.0274)
- (84) Perera T.A., et al., 2008, submitted to MNRAS (arXiv:0806.3791)
- (85) Poglitsch A., et al., 2006, SPIE, 6265, 8
- (86) Pope, A., et al., 2005, MNRAS, 358, 149
- (87) Pope, A., et al., 2006 MNRAS, 370, 1185 (P06)
- (88) Pope A., et al., 2008, ApJ, 675, 1171
- (89) Saracco P., et al., 2005, MNRAS, 357, L40
- (90) Schinnerer E., et al., ApJL in press (arXiv:0810.3405)
- (91) Scott, S. E., et al. 2002, MNRAS, 331, 817
- (92) Scoville N., et al., 2007, ApJS, 172, 38
- (93) Solomon, P. M., Vanden Bout P. A., 2005, ARA&A, 43, 677
- (94) Songaila A., 2004, AJ, 127, 2598
- (95) Spinrad H., Dey A., Stern D., Dunlop J., Peacock J., Jimenez R., Windhorst R., 1997, ApJ, 484, 581
- (96) Steidel C. C., Adelberger K. L., Dickinson M., Giavalisco M., Pettini M., Kellogg M., 1998, ApJ, 492, 428
- (97) Steidel C. C., Adelberger K. L., Shapley A. E., Pettini M., Dickinson M., Giavalisco M., 2003, ApJ, 592, 728
- (98) Stevens, J. A., et al. 2003, Nature, 425, 264
- (99) Stern, D., et al., 2005, ApJ, 631, 163
- (100) Tacconi, L. J., et al. 2006, ApJ, 640, 228
- (101) Tacconi, L. J., et al. 2008, ApJ, 680, 246
- (102) Takagi T., et al., 2008, MNRAS, 389, 775
- (103) Trujillo I., et al., 2006, MNRAS, 373, L36
- (104) Vanzella E., et al., 2008, A&A, 478, 83
- (105) Venemans B. P., et al., 2002, ApJ, 569, L11
- (106) Venemans, B. P., et al. 2007, A&A, 461, 823
- (107) Waddington I., Windhorst R. A., Cohen S. H., Partridge R. B., Spinrad H., Stern D., 1999, ApJ, 526, L77
- (108) Wang Z., et al., 2004, ApJS, 154, 193
- (109) Wang, W.-H., et al. 2007, ApJ, 670, L89
- (110) Wang, W.-H., et al. 2008, submitted to ApJ (arXiv:0805.3503)
- (111) Wiklind T., 2003, ApJ, 588, 736
- (112) Wilson, G. W., et al. 2008, MNRAS, 386, 807
- (113) Younger, J. D., et al. 2007, ApJ, 671, 1531
- (114) Younger, J. D., et al. 2008a, MNRAS, 387, 707
- (115) Younger, J. D., et al. 2008b, ApJ, 688, 59
- (116) Yun M. S., Reddy N. A., Condon J. J., 2001, ApJ, 554, 803
- (117) Zirm A. W., et al., 2007, ApJ, 656, 66