MOLECULES IN G1.60.025 – “HOT” CHEMISTRY IN THE ABSENCE OF STAR FORMATION AT THE PERIPHERY OF THE GALACTIC CENTER REGION
Abstract
We present molecular line mapping of the Giant Molecular Cloud G1.60.025, which is located at the high longitude end of the Central Molecular Zone of our Galaxy. We assess the degree of star formation activity in that region using several tracers and find very little. We made a large scale, medium () resolution map in the transition of SiO for which we find clumpy emission over a -sized region stretching along the Galactic plane. Toward selected positions we also took spectra in the easy to excite quartet of CH3OH and the CS line. Throughout the cloud these CH3OH lines are, remarkably, several times stronger than, both, the CS and the SiO lines. The large widths of all the observed lines, similar to values generally found in the Galactic center, indicate a high degree of turbulence. Several high LSR velocity clumps that have 50–80 km s-1 higher velocities than the bulk of the molecular cloud appear at the same projected position as “normal” velocity material; this may indicate cloud-cloud collisions. Statistical equilibrium modeling of the CH3OH lines observed by us and others yield relatively high densities and moderate temperatures for a representative dual velocity position. We find cm-3/30 K for material in the G1.60.025 cloud and a higher temperature (190 K), but a 50% lower density in a high velocity clump projected on the same location. Several scenarios are discussed in which shock chemistry might enhance the CH3OH and SiO abundances in G1.60.025 and elsewhere in the Central Molecular Zone.
1 INTRODUCTION – THE CENTRAL MOLECULAR ZONE AND ITS (LITTLE) STAR FORMATION ACTIVITY
“Ordinary” giant molecular clouds (GMCs) in the Galactic disk have sizes of tens of parsecs, temperatures, , in the low tens of K, and densities, , of order a hundred cm-3. Embedded in these GMCs are regions of star formation with much higher temperatures and densities. In contrast, the gas in the central molecular zone (CMZ; see e.g. Morris & Serabyn, 1996) of our Galaxy, stretching from Galactic latitude,, to in a wide band in latitude, , around the Galactic center (GC, Bally et al., 1987, 1988; Dahmen et al., 1997, 1998; Oka et al., 1998) is in general characterized by much higher temperatures, densities, and more turbulence, resulting in larger linewidths (–30 km s-1). Güsten & Philipp (2004) give a recent review.
To get a handle on the chemistry and physical conditions in these peculiar clouds, multi-transition measurements of molecules other than the ubiquitous and easily-thermalized carbon monoxide (CO) are highly desirable. By observing many lines from a given species and modeling the results using, e.g., large velocity gradient (LVG) methods, one can derive the densities and temperatures of the GC clouds, which are known to be significantly higher than values in Galactic disk clouds, but still relatively ill-constrained by existing data. Extensive surveys of carbon monosulfide (CS), 13CO, and C18O have been made mostly with coarse spatial resolutions of and , respectively (Bally et al., 1987; Dahmen et al., 1997) and, in a smaller region around the GC itself, of cyanoacetylene (HC3N), ammonia (NH3), and silicon monoxide (SiO) with beam sizes between and (Güsten et al., 1981; Walmsley et al., 1986; Martin-Pintado et al., 1997). Walmsley et al. observed several HC3N transitions within of the GC and found that the bulk of the gas has K and cm-3, while 20% of its mass may exist in higher ( cm-3) density clumps. Astonishingly, a large number of complex organic molecules have been found to show widespread emission all over the CMZ (see §6).
Whether tidal forces, stronger turbulence, higher densities, and stronger magnetic fields (compared to Galactic disk clouds) favor stars formation or hinder it can be argued either way. Fact is that the spectacular Arches and Quintuplet clusters give testimony for violent star formation a few million years ago (Figer et al., 1999, 2002). Figer et al. (2004) argue that ongoing star formation is responsible for the observed central stellar cusp. From Infrared Space Observatory (ISO) and Spitzer Space Telescope infrared wavelength data Schuller et al. (2005) derive a star formation rate in the CMZ of 0.2 yr-1 over the past Myr, which is an appreciable fraction of our whole Galaxy’s star formation rate.
However, apart from the star formation-wise extremely active Sgr B2 region, little of what is commonly assumed to be evidence for on-going high-mass star formation is found in the GC GMCs at present, such as (ultra)compact HII regions, H2O and CH3OH masers. The submillimeter-detected dust ridge identified by Lis & Carlstrom (1994) marks highest column density material of the general GC dust emission/molecular cloud distribution (Pierce-Price et al., 2000). It has the potential to harbor proto-cluster cores with the massive ( ) Infrared Dark Cloud M0.25+0.11 the most prominent example (Lis et al., 1994; Lis & Menten, 1998). However, in this ridge, namely in M0.25+0.11, and also in the larger GC region only few markers of star formation have been found, just very few H2O masers and compact continuum sources (Güsten & Downes, 1981; Lis et al., 1994). Caswell (1996) covered an area of extent ′′ ′′ in a sensitive interferometric search for 6.7 GHz class II methanol masers, which are unambiguous tracers of high-mass star formation. He only found 23 masers sites with half of them located in the Sgr B2 complex alone.
2 THE PECULIAR G1.60.025 MOLECULAR CLOUD
2.1 Extended, Warm, Molecular Gas
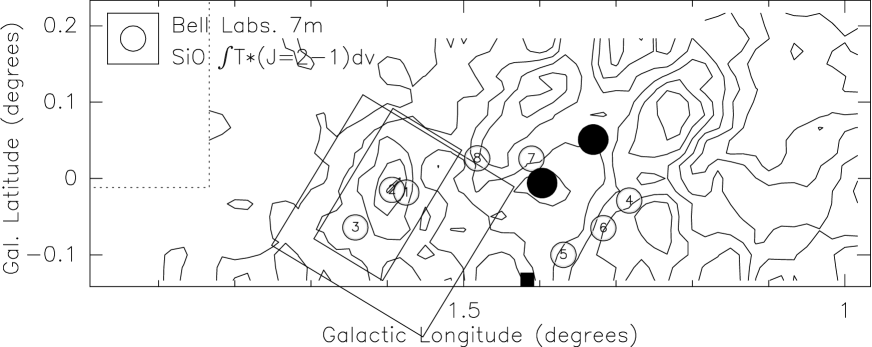
The molecular cloud G1.60.025111Strictly speaking G1.60.025 is only the cloud fragment delineated by the square in Fig. 1. For simplicity’s sake, we refer by that name to the whole -sized region shown in that figure. lies at the very easternmost longitude edge of the cloud complexes making up the CMZ that were mapped in CO, 13CO, C18O CS, and other molecules (Bally et al., 1987, 1988; Dahmen et al., 1997, 1998; Oka et al., 1998; Martin et al., 2004) Maybe because of its location, this cloud received comparatively little attention in the past. However, the few observations that do exist reveal a fascinating chemical picture.
For further reference, we show, in Fig. 1, an image of the velocity-integrated emission in the transition of SiO discussed in §4.1.
Apart from the low resolution surveys in CS and C18O G1.60.025 has been mapped in several inversion transitions of NH3 by Gardner et al. (1985), who found remarkably strong emission in the =(1,1), (2,2), and (3,3) lines, with the (3,3) line possibly being inverted toward one position. The NH3 observations indicate that the cloud is warm (probably K) but Gardner et al. do not give a thorough discussion of the temperatures suggested by the NH3 data. Gardner & Boes (1987), based on another set of NH3 data, conclude K. Kuiper et al. (1993) observed the transition of C3H2 near 18.3 GHz. This line, whose appearance is ubiquitous in molecular clouds, here appears atypically in enhanced absorption against the cosmic microwave background radiation.
Also overcooling was found by Whiteoak & Peng (1989) in the line of CH3OH. This transition, which is the second strongest class II methanol maser line222See Menten (1991) for the nomenclature/classification of CH3OH masers. (Batrla et al., 1987), has been found in absorption in dark clouds (Walmsley et al., 1988), which lack the far-infrared continuum emission necessary to produce class II maser action and also in absorption in class I methanol maser regions for which the same is true. Whiteoak & Peng (1989) model the very (up to 2 K) deep absorption and find a high -type CH3OH abundance of and an H2 density cm-3. Haschick & Baan (1993) find extended, strong maser emission in the (class I) methanol maser line. As explained in §5.1, the occurrence of overcooling in the and simultaneous maser action in the lines is expected from basic properties of the methanol molecule and can be used to constrain the physical conditions in the masing region.
Sobolev (1992) and Salii et al. (2002) discuss observations of several lines from methanol and other molecules with the RT-22 telescope at Pushchino (with resolution) and the Swedish-ESO Submillimeter Telescope (SEST) (with and resolution), which they model to derive physical parameters. Their results are compared to our own in §5.1.
One of the most astonishing things about G1.60.025 is the virtually complete absence of any marker of high-mass star formation on which we shall elaborate in §2.2. This means, in G1.60.025 we have the opportunity to study large-scale high-temperature gas-phase chemistry in the absence of strong UV fields, which, in star-forming regions occurs only in very high extinction, spatially compact hot cores near young (proto)stars. In the latter environment, the high observed abundances of SiO, CH3OH, and other more complex species, which are orders of magnitudes or more higher than their quiescent, cool molecular cloud abundances, are thought to result from the evaporation of ice grain mantles in which these molecules resided in frozen-out form (see, e.g. Garrod & Herbst, 2006, and references therein). Later in this paper (in §5.2) we will argue that in the case of G1.60.025 these abundances may be the result of shock chemistry.
Given that several of the cloud’s characteristics (high linewidths, high abundances of usually rare species) are typical for GC GMCs, we assume in the following that is at the distance of the GC, 8 kpc (Reid, 1993) . Other evidence for placing the cloud there are the high [HCO]/[H2CO] and [HCO]/[H2C18O] isotopic abundance ratios, which are by factors of 4 and 2 higher, respectively, than values found in the solar neighborhood, but typical for the GC region (Gardner & Whiteoak, 1981, 1982). Its projected distance from the GC is ca. 200 pc.
In this paper we report medium spatial resolution () mapping observations of G1.60.025 in the rotational line of silicon monoxide (SiO). Furthermore, we observed selected positions in the line of carbon monosulfide (CS) and several methanol (CH3OH) transitions. As described by Leurini et al. (2004), newly calculated collisional rate coefficients now allow meaningful modeling of methanol excitation to obtain densities and kinetic temperatures (see §5.1). Using all this information, we summarize the available chemical information for G1.60.025 and in §5.2 discuss possible reasons for the observed picture.
2.2 (Almost Non-)Existent Active Massive Star Formation in G1.60.025
In order to assess whether G1.60.025’s peculiar chemistry could be energetically driven by the influence of young high-mass stars, we conducted a census of observational phenomena and, in particular, of tracers of on-going high-mass star formation activity in the region and its surroundings. For this, we conducted a literature search using the SIMBAD333http://simbad.u-strasbg.fr/Simbad database. We searched for all astronomical objects contained in that database in a circle of radius with at its center. We found a total of 138 objects, many of which are foreground (some of them OH/IR) stars and planetary nebulae. However, also a few compact radio continuum sources were found, for some of which, as discussed in the following, multi-wavelength data are available, allowing a characterization.
For our purposes, we are only interested in objects that are (most probably) associated with G1.60.025 and may have some influence on their environment. Given this, it is straightforward to eliminate radio sources from our list that are not coincident with IRAS point sources. A spot check reveals that, e.g., G1.2850.054, which has no associated IRAS source is, both, variable and has a negative, non-thermal spectral index and is therefore in all likelihood of extragalactic origin. On the other hand, IRAS sources without detected radio emission may be important, as there is no established correlation between the radio and IR luminosities of very young high-mass protostellar objects; see the famous case of Orion IRc2 (Menten & Reid, 1995).
OH/IR objects are easy to eliminate from our list since they can be identified by their IRAS colors (as established by van der Veen & Habing, 1988) and/or the presence of 1612 MHz OH maser emission.
The only IRAS sources in the general region that are definitely associated with star formation are IRAS 174502742 and 174572743 which are coincident with the compact HII regions Sgr D 7 and 8, respectively (Liszt, 1992); the latter one is also known as GPSR5 1.396-0.006 (Becker et al., 1994). We note that these sources are not coincident with any molecular peak in the cloud. Observed and derived properties for them can be found in Table 1. While Liszt determines for Sgr D 7 a size of at 1.6 GHz, he finds source 8 unresolved in his beam. Becker et al. (2004), with beam size, do not detect 7 at either 1.4 or 5 GHz, most certainly “resolving it out” and find source 8 unresolved at either frequency with flux densities of 24.2 and 26 mJy at 1.4 and 5 GHz, respectively. Assuming a size of for source 8 and an electron temperature of 10000 K we calculate an optical depth, , of the free-free emission of 0.47, 0.29, and 0.03 at 1.4, 1.6, and 5 GHz respectively. For source 7 we determine . Using the formula given by Mezger et al. (1974) we derive that Lyman continuum photon fluxes of s-1 and s-1 are needed to produce the compact HII regions Sgr D 7 and 8, respectively. According to the Tables given by Panagia (1973) these values correspond to ZAMS spectral types of O9 and B0, respectively.
To determine the neutral gas masses and luminosities of these sources from the IRAS data in the same way as described by Lis & Menten (1998), Planck functions were fitted to the measured 12, 25, 60, and 100 m flux densities444This fitting was not straightforward as the 12, 60, and 100 m flux densities listed by the SIMBAD database for Sgr D 7 are very uncertain, as is the 60 m value for D 8; for the latter source only upper limits are given for the 12 and 100 m flux densities. to determine dust temperatures (see Table 1). We used the formulae given therein and in the paper by Motte et al. (2003) to determine the gas masses listed in Table 1 for Sgr D 7 and 8 (taking the upper limits in the table at face value). Integrating over the spectral energy distributions we derive the bolometric luminosities given in Table 1, which, again according to Panagia (1973), are produced by a B0 and a B1 ZAMS star, respectively. These spectral types are very similar to the ones inferred from the Lyman continuum fluxes.
All in all we conclude that, apart from the two sources discussed above, there is presently very little star-forming activity in G1.60.025 and consider it highly unlikely that star-formation activity contributes to its enhanced temperature in a significant way.
2.3 A Possible Connection to the G1.40.1 Supernova Remnant
The supernova remnant (SNR) G1.40.1, which lies partially in the area mapped by us clearly interacts with molecular gas. Yusef-Zadeh et al. (1999) found 1720 MHz OH maser emission at (see Fig. 1) at a velocity of km s-1, which is blue-shifted relative to almost all of the gas we observe. Possibly the masing gas is located in the portion of the swept-up molecular material coming toward us and thus amplifying the continuum background. Lockett et al. (1999) constrain the conditions for the occurrence of these masers to temperatures between 50 and 125 K, densities and OH column densities around cm-3 and cm-2, respectively, typical for post magneto-hydrodynamic (“C”)-shock material. These numbers can be compared with the values derived from our methanol modeling in §5.1.
3 OBSERVATIONS
Our observations were made with the Bell Laboratories 7 m telescope in the spring of 1995. The beamwidth at 86 GHz is . System temperatures ranged from 300 to 400 K, but could be as high as 1200 K. Generally while mapping, the observing time per point was adjusted to retrieve uniform rms noise values. We observed the lines listed in Table 2, some of them (as listed in the table caption) with a MHz filterbank, others with a kHz filterbank.
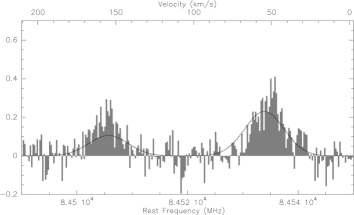
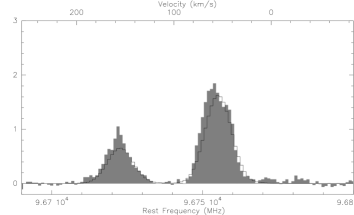
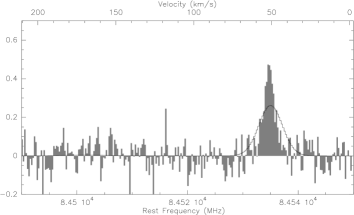
We mapped only the SiO line extensively over the -sized region shown in Figs. 1 and 5. Mostly high-quality spectra of this line and the others listed in Table 2 were taken toward the “fiducial” positions given in Table 3, which are marked in Fig. 1. The CS and SiO spectra taken toward positions 1–6 are presented in Fig. 2 and the CH3OH spectra in Fig. 3 and 4. Line parameters , obtained by Gaussian fitting are presented in Table 4. Because of the existence of multiple velocity components, large line widths and line blending, Gaussian fitting of the CH3OH series was not viable. The interpretation of the methanol results is discussed in §5.1.
4 OUR MOLECULAR LINE DATA
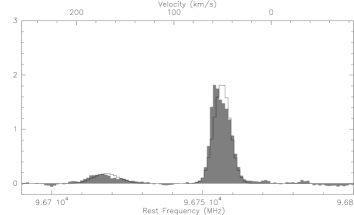
As shown in Figs. 2–5, we observe emission between velocities of and km s-1. Molecular gas at velocities km s-1 and km s-1 is usually attributed to the expanding molecular ring (EMR, Kaifu et al., 1972, 1974; Scoville, 1972) around the Galactic center. Given its position, G1.60.025 is at the high longitude end of that ring. That the emission in all the three molecules observed by us is much more prominent and widespread than in “normal” Galactic disk clouds favors a Galactic center location; see also the arguments brought forward in §2.1.
4.1 SiO Emission Distribution and Velocity Structure
Figs. 1 and 5 show that the SiO emission is very clumpy on different scales, the smallest of which seem to be resolved by our beam, whose HPBW corresponds to 4.7 pc. This picture is similar to that presented by the line mapped by Martin-Pintado et al. (1997) with the same resolution over a similar-sized region extending the area mapped by us to smaller longitudes, i.e., from to , covering Sgr B2 and the Galactic center proper (Sgr A). Huettemeister et al. (1998) observed the 28SiO and the 29SiO and the 28SiO transitions toward CS peaks found by Bally et al. (1987). They used LVG calculations to model these two-line, two-isotopomer data to constrain density, temperature and SiO abundance toward all these positions. Their data are consistent with a hot K, low density medium cm-3, in which, particularly, the higher- SiO transitions are highly subthermally excited. One of the positions they observed, at , , is within of our position 6. Toward this position, they find the highest fractional SiO abundance () of all the 33 positions they observed, which are spread over the whole of the CMZ. Huettemeister et al. (1998) invoke a shock origin for the elevated SiO abundance there and also toward other locations for which models of the Galactic bar gravitational potential predict cloud-cloud collisions (see §4.3 and 5.2).
4.2 Methanol Emission
Toward all of the positions listed in Table 2 the emission from the 555The projection of the angular momentum quantum number, , runs from to for -type CH3OH. For -type CH3OH a capital is used, with . When referring in one expression to levels from both species, lowercase is used. quartet of CH3OH is stronger than that of the SiO line, and, amazingly, even stronger than that of the CS line (see Table 4, Figs. 3 and 4). Given their strong blending, it is impossible to determine the properties of these lines by fitting Gaussians in any meaningful way. Instead we performed the model calculations described in §5.1 to predict intensities for them lines and the 84 GHz transition and, in turn, to constrain the physical parameters of the emission region.
4.3 Evidence for Cloud-Cloud Collisions
We note that we find a spatial coincidence (at ) of an SiO clump with emission in the 17.6 km s-1 channel with one with emission in the 100 km s-1 channel. We also observe a coincidence, at , between clumps in the 100.4 and one in 155.6 km s-1 channels. Other such coincidences can be found in the channel maps.
A similar coincidence of two clumps with widely different velocities that appear at the same projected area in space has been reported by Haschick & Baan (1993) who note, in the CH3OH emission, a coincidence of a clump in the 40–70 km s-1 velocity interval (which they call Dm) with one in the 150–167 km s-1 interval (Em) at . This particular spatial coincidence of components at these velocities was also pointed out by Salii et al. (2002), who present a map of the high velocity emission along with the integrated emission in the and the blended lines of CH3OH for which we took spectra only toward selected positions. Both the low and the high velocity emission have a similar extent in the CH3OH as the SiO emission (for the high velocity emission, see the 156 km s-1 channel map in our Fig.5).
5 PHYSICAL CONDITIONS AND CHEMISTRY IN G1.60.025
5.1 Methanol Statistical Equilibrium Calculations
In addition to our own data and those of Salii et al. (2002), further important constraints on CH3OH excitation in G1.60.025 come from widespread enhanced absorption (overcooling) in the 12.2 GHz line (Whiteoak & Peng, 1989) and the also widespread maser emisson in the line (Haschick & Baan, 1993; Liechti & Wilson, 1996). As explained, e.g., by Menten (1991) one expects, in the absence of a strong far-infrared field, which is certainly the case in G1.60.025, an overpopulation of the ladder relative to the . Similarly, one might naively expect overcooling in the 109 GHz transition, where we observe neither absorption nor emission with a upper limit of 0.57 K. This absence is explained by our model predictions (see below).
To address these issues quantitatively, we performed model calculations. Leurini et al. (2004) used the rate coefficients for collisions of CH3OH with He calculated by Pottage et al. (2002) to investigate the excitation of CH3OH over a range of physical parameters typical of star-forming regions. They also presented a new technique to handle the problem of deriving physical parameters of a source from spectroscopic data; the technique is based on the simultaneous fit of multiple lines in a spectrum (when present) with a synthetic spectrum computed using the LVG approach for solving the radiative transfer equations, in the derivation of de Jong et al. (1975). This analysis is particularly well-suited for the case of strongly blended lines, where “by-hand” Gaussian fitting of lines with multiple components often leads to unreliable results. Moreoever, following Cesaroni & Walmsley (1991), the effect of overlap of lines in the excitation of the CH3OH molecule is taken into account defining an average optical depth and brightness temperature for lines with a frequency separation
| (1) |
Using the technique described above, we analyzed our data toward two of the observed positions, namely numbers 2 and 3 of Table 3, to derive the physical parameters of the region. In addition to our own data, we have also compared the predictions of our model for other CH3OH lines observed toward position 2 by other authors. Our model calculations do not predict absorption in the transition for a wide range of physical parameters from to ; from to ; from to . The simultaneous modeling of the and lines gives constraints on the column density of methanol and on the H2 density. The transition is strongly inverted over a wide range of physical parameters, for H cm-3 and CH3OH column densities higher than 1015 cm-2 (see Fig. 8). Hence, the non-detection of obvious strong maser action (but see below) in our observations indicates low values for the column density of the gas. The lines are, on the other hand, sensitive to the density of the gas (see Fig. 4 of Leurini et al. (2004)).
Inspecting the CH3OH map presented by Salii et al. (2002) we assumed the CH3OH emission to be extended compared to the 7 m telescope beam. We modeled the data with two velocity components, corresponding to the high velocity clump and to the extended cloud. The LVG fit overlaid on the data is shown in Figs. 6 and 7. The results determined from the fit are given in Table 5. Table 6 shows our model predictions for the other CH3OH transitions observed by other authors. Pointing and absolute calibration uncertainties and beam-size differences can make the determination of physical parameters less reliable when comparing data from different telescopes; in our case however, beam-size differences should not affect the results as, given the source sizes, beam filling factors for the different transitions are pretty close to 1.
Salii et al. (2002) determined the physical parameters toward our position 2 by analyzing several methanol transitions. Their results do differ somewhat from ours. In particular, they find somewhat smaller spatial densities and CH3OH column densities. From their analysis they conclude that the high velocity clump has a hydrogen density, H, less than cm-3, column densities between and cm-2 and temperatures in the 150–200 K range. For the extended cloud they infer a hydrogen density cm-3, column densities larger than cm-2 and a kinetic temperature of less than 80 K. Assuming that all the gas is in molecular form, this translates in spatial densities of molecular hydrogen less than cm-3 for the extended cloud and H cm-3 for the high velocity clump. With these parameters, they can reproduce the observed line intensities for several transitions, but fail to explain the simultaneous deep absorptions in the 2 and 2 lines at 12.18 GHz and 156.6 GHz, and the brightness of the emission in the blend. They conclude that the absorptions and the blended emission come from different parts of the cloud.
Our model predictions (see Table 6) overestimate the , blended emission and underestimate the absorption in the 2- transition in the extended cloud, but can reproduce the simultaneous absorptions and the emission in the blend. For the high velocity clump, our predictions are in good agreement with the observations. Moreover, spatial densities of the order of a few 103 cm-3, as inferred by Salii et al. (2002), fail to reproduce our observations of the - line.
At position 2, Haschick & Baan (1993) find maser emission in the 4- line on top of a broad thermal-looking component. Fitting the maser component in our model would need a second, narrower component for both the high velocity clump and the extended cloud, which is not detected in our observations. Therefore we do not include in our analysis any other component to account for the narrow maser features in the 4 line. However, the maser action in the 4 and the simultaneous absence of it in the 5 line can give interesting constraints for the physical parameters of the regions. Leurini et al. (in prep.) have extensively analyzed the pumping mechanisms of class I CH3OH masers. Their calculations confirm collisions to be responsible for the excitation of class I masers and suggest the maser action in these lines to be used as a density indicator. Both the 4- and 5 transitions are inverted at low densities; however, the inversion of 5 line starts with H cm-3 with CH3OH column densities higher than 1015 cm-2, while the 4 line mases also at lower densities, as Fig. 9 shows, almost independently from the kinetic temperature. The above is also found by Berulis et al. (1992) and Sobolev (1992). At lower column densities, the inversion of the 5 line happens at slightly higher densities. Therefore the detection of a maser component at 36 GHz together with the non-detection of strong maser action manifested by narrow features in the 84.5 GHz line puts an upper limit on of cm-3 on the spatial hydrogen density of the region, depending on the column density of methanol.
Nevertheless, comparison of 5 and spectra (Figs. 3 and 4) shows that the former generally are narrower than the latter, which might at first look be interpreted as line narrowing accompanying maser action. However, since some of the (noisy) spectra also cover incongruent velocity ranges this might actually not be the cause for this difference in appearance. Another possibility would be the existence of two gas components in the beam with different densities and/or temperatures, which might contribute to the lines in question in different proportions. This could explain the narrower line profiles of the 5 line, which seems not to be excited in one of the velocity components, and the underestimate of line intensity in the model. However, the maps of the 5 and lines published by Salii et al. (2002) (and with a spatial resolution of ), do not show any large discrepancies between the distributions of the two lines. Needless to say, the described discrepancy illustrates the qualitative nature of our results.
To summarize, our statistical equilibrium modeling of the CH3OH lines observed by us and others indicates relatively high densities ( cm-3) and moderate temperatures ( – K) for two representative positions in the G1.60.025 cloud at vLSR=50 km s-1. In the high velocity component, lower densities are inferred by the model for both positions; for position 2, a high temperature (190 K) is needed to reproduce the observations, while cold gas (16 K) is needed for position 3. The latter is puzzling as, in analogy to position 2, one might also expect an enhanced temperature for high velocity CH3OH emission. High velocity SiO is not even detected toward position 3 and high velocity CS barely. Methanol abundances relative to H2 are of the order of 10-7 – 10-8. Finally, we note that the temperatures and densities we derive are of the same order of the values that Whiteoak & Peng (1989) derive from their modeling of the CH3OH line.
Huettemeister et al. (1993) conducted a multi-transition study of NH3 inversion lines with energies of up to 408 K above ground toward 36 positions in the CMZ. They find evidence for two components pervasive throughout the CMZ, both at each position at roughly the same velocity, a cool one, K and a hot one K. The densities of the these components are not well constrained by their observations, but they argue that the hot and cool gas have densities of and cm-3, respectively.
In their study, they also included one position within the area that we mapped in SiO emission () and several others just abutting it; i.e., within 0.2 degrees outside of its boundaries. Since they do not present data toward the positions toward which we see a high(=clump)- and a low(= general cloud)-velocity component, a direct comparison with our analysis is difficult. However, we can say that we do not see evidence for a high temperature component at the general cloud velocities toward the two positions that we analyzed, while they find evidence for both a cool and hot component at these velocities.
The reason why we do not see a hot component may be a selection effect based on our choice of lines. The rotation temperatures Huettemeister et al. (1993) derive from their lowest excitation lines alone [ and at energies of 23 and 64 K above ground, respectively] invariably are between 18 and 40 K throughout the CMZ and mostly around 25 K. In contrast, rotation temperatures determined from the (4,4) and (5,5) lines (at 200 and 295 K above ground, respectively) are all K, most K, and some as high as 200 K. Since we didn’t observe any high excitation lines, given the experience with NH3, we could not detect any hot component in G1.60.025 at velocities at which emission from cold as well as from hot gas is arising, but only at velocities at which only the hot component emits (i.e., high velocity clumps).
To estimate the column density of molecular hydrogen and derive the [CH3OH]/[H2] ratio, we used the 13CO data imaged by Bally et al. (1987) with the Bell Labs 7 m telescope. Assuming the Local Thermal Equilibrium approximation, and using the kinetic temperatures derived from the analysis of the methanol emission, we computed the 13CO column densities for positions 1 and 2, for the high velocity clump and for the extended cloud, by integrating over the velocity channels corresponding to the CH3OH emission. To convert the 13CO column density into a H2 column density, we used a typical abundance relative to H2 of 10-4 for CO and a value of 20 for the 12CC isotopic ratio. This is the value Wilson & Rood (1994) give for the 12C/13C ratio for molecular clouds in the Galactic center region. If we, however, used 11 for the latter ratio, which Gardner & Whiteoak (1981) derive for G1.60.025 from observations of formaldehyde isotopomers, the relative methanol abundance ratios given in the following would increase by a factor of 2.
Assuming that the column density of CH3OH- and CH3OH- are the same, our derived column densities translate into abundances relative to molecular hydrogen of for the high velocity clump and for the extended cloud toward position 2 and to and , respectively, for position 3. The high velocity component is not detected in the 13CO line toward position 3 and we could only derive an upper limit to the H2 column density based on the rms noise value of the data. Therefore, the CH3OH abundance ratio estimated for this component is a lower limit to its true value.
5.2 Shock Chemistry in G1.60.025
As discussed in §§4.1 and 5.1 the SiO and CH3OH abundances are enhanced relative to cold molecular cloud values. The observed chemical peculiarities of G1.60.025 could be the the result of several mechanisms all involving shocks: cloud-cloud collisions (see §4.1), a molecular cloud-SNR interaction, and whatever is responsible for the peculiar large linewidths in GC GMCs in general (increased turbulence, tidal forces).
It is tempting to assume that the high observed SiO and CH3OH abundances in G1.60.025 have a common origin. With regard to these two species, a picture similar to G1.60.025 presents itself in the molecular peak M (the so-called “20 km s-1 cloud”), which lies NEE of the Galactic center radio source Sgr A⋆ at a position where the supernova remnant Sgr A East (SNR G0.0+0.0) appears to interact with a molecular cloud. Here, Martin-Pintado et al. (1997) find strong SiO () emission, while Szczepanski et al. (1989) and, at higher resolution, Liechti & Wilson (1996) find very strong maser emission in the 36 GHz line of methanol. Just like in G1.60.025 the CH3OH emission consists of a few narrow spikes and intense “broad” emission. 1720 MHz OH masers are also found in this region on the near-side of the SiO/CH3OH emission distribution relative to Sgr A East facing the SNR (Karlsson et al., 2003; Pihlström & Sjouwerman, 2006; Yusef-Zadeh et al., 2007). We emphasize the similarity to G1.60.025, with the SNR (see §2.3), projected on and possibly interacting with it.
The existence of 1720 MHz OH maser emission argues, as discussed in §2.3, also for (C-)shock. The densities and temperature we derive from the methanol lines are very similar to the values necessary for 1720 MHz OH maser emission as discussed there. The chemistry in the molecular gas interacting with the SNR IC 443 was studied by van Dishoeck et al. (1993). One subregion, clump G I, was found to show a particularly rich chemical picture. However, one dramatic difference between the molecular content of G1.60.025 and molecular IC 443 clump G I a is the complete dearth of any CH3OH in the latter. van Dishoeck et al. (1993) give a relatively sensitive upper limit of 0.2 K for any line in the 241.7 GHz CH3OH series, while various SiO lines are two to three times stronger than that.
As for SiO, high abundances after the passage of magnetohydrodynamic C-shocks can result from a combination of the setting free of SiO into the gas-phase by sputtering of the (charged, and hence coupled to the magnetic field) grain cores by neutral particles in the region of the C-shock where the relative velocities between charged and neutral particles are large, and following gas-phase reactions (Schilke et al., 1997). This is true for pristine material, where silicon resides in the grain cores. If, as is the case in the Galactic center, molecular clouds are frequently exposed to cloud-cloud collisions, silicon may, after the initial release from the core, reside either in the gas phase (possibly some of it in SiO2 as suggested by Schilke et al. (1997)) or in grain mantles, with a lower binding energy.
How is the methanol produced in shocks? Gas-phase production of methanol has been shown to be insufficient to create the observed abundances in dark, quiescent clouds by many orders of magnitude (Geppert et al., 2005). Grain surface production however seems to be efficient, as shown by Hidaka et al. (2004). This indeed is the proposed mechanism for producing the high methanol abundances found in “hot cores” around high-mass young (proto)stars, where CH3OH is created by the evaporation from grain mantles once temperatures exceed K. Shocks also would be able to release material from grain mantles, either by sputtering, even at lower shock speeds than needed for SiO production, since here the more weakly bound ice mantles have to be destroyed instead of the grain cores, as needed for SiO; or by thermal evaporation in the hot shocked gas. This mechanism has indeed been evoked for explaining the high methanol abundances in shocked protostellar outflows (e.g., Bachiller & Perez Gutierrez, 1997).
To evaporate methanol from ice mantles, however, these ice mantles have to be present. While there is observational evidence from IR spectroscopy that ice mantles do exist in the cold envelopes of protostars (to be released by outflows or heating by the igniting star), the conditions for formation of ice mantles in the highly turbulent, warm and relatively low density environment of Galactic center clouds (of which G1.60.025 is a member) seem less favorable. Deciding if sufficient methanol abundances in ice mantles can be built up under these conditions will require detailed modeling.
Another option could be that under GC cloud conditions, ice mantles do not build up, but CO can reside long enough on the grain surface to be transformed into CH3OH, which then is desorbed either by sputtering in vortices, or just thermally desorbed. In this case, the elevated methanol abundance would not be related to any specific shock event, but be the steady state abundance under these special conditions. Modeling would certainly be illuminating, but an observational consequence of this mechanism would be a uniformly high methanol abundance in the Galactic center, which may actually apply (Requena-Torres et al., 2006).
Alternatively, in the elevated temperatures of a C-shock, CH3OH may be created by the endothermic gas-phase reactions
| (2) |
and
| (3) |
discussed by Hartquist et al. (1995), which have endothermicities of 6500 and 14700 K, respectively. The abundances of reaction partners OH and H2O certainly would be enhanced in a shock, but to judge these reactions’ importance would require running shock models, looking also carefully at possible shock destruction mechanisms for CH3OH. Observationally, this would, just as the option of removing CH3OH from ice mantles, imply a correlation of elevated CH3OH abundances with shock events.
In practice, it will be very hard to distinguish observationally between these scenarios, because SiO, the canonical shock tracer, is so widely distributed. This suggests that either shocks are ubiquitous, or that the grains are processed to a degree that a significant fraction of silicon resides in more weakly bound form either in the gas phase or on the grain surface, so that the release mechanisms for SiO and CH3OH are similar.
While we argue above that the interaction with a SNR may influence the chemistry in at least part of G1.60.025, cloud-cloud collisions resulting from the special dynamics induced by the Galactic bar potential may play a major role for G1.60.025 and other GC clouds as a whole (see Huettemeister et al., 1998; Rodriguez-Fernandez et al., 2006).
6 G1.60.025 IS AT THE OUTER REACHES OF THE GALACTIC CENTER ORGANIC MOLECULE REGION
There actually is evidence for a giant repository of organic molecules coextensive with the Central Molecular Zone, of which G1.60.025 demarcates the high-longitude border (Menten, 2004).
The first evidence for extended organic material in the CMZ came from widespread 4.8 GHz H2CO absorption (Scoville et al., 1972); see also Zylka et al. (1992). Given the ubiquity of formaldehyde in molecular clouds (e.g. Downes et al., 1980), one might dismiss this “as nothing special”. CH3OH, on the other hand, has usually quite low abundance and is difficult to detect outside hot, dense cloud cores. Nevertheless, Gottlieb et al. (1979) find the 834 MHz line in the CMZ in emission and extended relative to their (!) beam, concluding it is (weakly) inverted and amplifying the strong background radio emission.
Other molecules similarly (or even) more complex than CH3OH and H2CO were found widespread throughout the CMZ, such as HCOOH and C2H5OH (Minh et al., 1992; Martín-Pintado et al., 2001) and, very recently, (CH3)2O, HCOOCH3, HCOOH, and CH3COOH (Requena-Torres et al., 2006)
Furthermore, mapping of the HNCO transition (made serendipitously simultaneously with a C18O survey), shows that the emission in this line is extending continuously from to , right out to G1.60.025! (Dahmen et al., 1997). The possible existence of such a huge mass of organic material in our Galactic center is extremely exciting and its extent, chemistry, and excitation should be studied with suitable tracers.
In fact, G1.60.025 coincides with the third-strongest peak in the integrated HNCO distribution (after the general Sgr B2 region and an area around ∘ ) and the ratio of the integrated intensities of the HNCO to that of the C18O line in G1.60.025 is the highest in the whole CMZ. Maybe it the low UV radiation field density resulting from the absence of young high mass stars in G1.60.025 is conducive to the existence of (fragile) complex molecules. Given this, one might also expect other complex molecules than CH3OH and HNCO to have large abundances in G1.60.025. Possibly the best spectral range to search for those is the 3 mm window since, given our density estimates (§5.1), submillimeter lines might have prohibitively high critical densities.
7 CONCLUSIONS
Here we summarize our main conclusions. We find very little evidence for star-formation in over the whole deg2 region of the G1.60.025 GMC. Our large scale, medium resolution () mapping in the transition of SiO reveals clumpy emission over an region stretching along the Galactic plane. Toward selected positions, we have observed emission in the quartet of CH3OH lines and the CS line. Toward all of these, the CH3OH lines are several times stronger than both the CS and the SiO lines. In addition, spectra of other methanol lines where taken. The wide widths of all the observed lines, similar to values generally found in the Galactic center, indicates a high degree of turbulence. A high velocity clump with a km s-1 higher velocity than the molecular cloud may indicate a cloud-cloud collision. Statistical equilibrium modeling of all the CH3OH lines observed by us and others indicates relatively high densities and moderate temperatures for one representative position in the G1.60.025 cloud ( cm-3/30 K) and higher temperature (190 K), but lower density ( cm-3in the high velocity clump. For a second position we also find densities of several times cm-3 for both the low and the high velocity emission, but a puzzling low temperature for the high velocity clump (16 K) and warmer gas (60 K) for the low velocity 50 gas. Different scenarios are possible in which shock chemistry might enhance the CH3OH and SiO abundances in G1.60.025 and elsewhere in the Central Molecular Zone by grain-gas chemistry or by hot gas chemistry.
References
- Bachiller & Perez Gutierrez (1997) Bachiller, R. & Perez Gutierrez, M. 1997, Ap. J. (Letters) , 487, L93+
- Bally et al. (1987) Bally, J., Stark, A. A., Wilson, R. W., & Henkel, C. 1987, ApJS, 65, 13
- Bally et al. (1988) —. 1988, ApJ, 324, 223
- Batrla et al. (1987) Batrla, W., Matthews, H. E., Menten, K. M., & Walmsley, C. M. 1987, Nature, 326, 49
- Becker et al. (1994) Becker, R. H., White, R. L., Helfand, D. J., & Zoonematkermani, S. 1994, ApJS, 91, 347
- Berulis et al. (1992) Berulis, I. I., Kalenski, S. V., Sobolev, A. M., & Strelnitski, V. S. 1992, Astronomical and Astrophysical Transactions, 1, 231
- Caswell (1996) Caswell, J. L. 1996, MNRAS, 283, 606
- Cesaroni & Walmsley (1991) Cesaroni, R. & Walmsley, C. M. 1991, A&A, 241, 537
- Dahmen et al. (1998) Dahmen, G., Huttemeister, S., Wilson, T. L., & Mauersberger, R. 1998, A&A, 331, 959
- Dahmen et al. (1997) Dahmen, G., Huttemeister, S., Wilson, T. L., Mauersberger, R., Linhart, A., Bronfman, L., Tieftrunk, A. R., Meyer, K., Widenhover, W., Dame, T. M., Palmer, E. S., May, J., Aparici, J., & Macauliffe, F. 1997, A&AS, 125, 1
- de Jong et al. (1975) de Jong, T., Dalgarno, A., & Chu, S.-I. 1975, ApJ, 199, 69
- Downes et al. (1980) Downes, D., Wilson, T. L., Bieging, J., & Wink, J. 1980, A&AS, 40, 379
- Figer et al. (1999) Figer, D. F., McLean, I. S., & Morris, M. 1999, ApJ, 514, 202
- Figer et al. (2002) Figer, D. F., Najarro, F., Gilmore, D., Morris, M., Kim, S. S., Serabyn, E., McLean, I. S., Gilbert, A. M., Graham, J. R., Larkin, J. E., Levenson, N. A., & Teplitz, H. I. 2002, ApJ, 581, 258
- Figer et al. (2004) Figer, D. F., Rich, R. M., Kim, S. S., Morris, M., & Serabyn, E. 2004, ApJ, 601, 319
- Gardner & Boes (1987) Gardner, F. F. & Boes, F. 1987, Proceedings of the Astronomical Society of Australia, 7, 185
- Gardner & Whiteoak (1981) Gardner, F. F. & Whiteoak, J. B. 1981, MNRAS, 194, 37P
- Gardner & Whiteoak (1982) —. 1982, MNRAS, 199, 23P
- Gardner et al. (1985) Gardner, F. F., Whiteoak, J. B., Forster, J. R., Peters, W. L., & Kuiper, T. B. H. 1985, Proceedings of the Astronomical Society of Australia, 6, 176
- Garrod & Herbst (2006) Garrod, R. T. & Herbst, E. 2006, A&A, 457, 927
- Geppert et al. (2005) Geppert, W. D., Hellberg, F., Österdahl, F., Semaniak, J., Millar, T. J., Roberts, H., Thomas, R. D., Hamberg, M., Ugglas, M. A., Ehlerding, A., Zhaunerchyk, V., Kaminska, M., & Larsson, M. 2005, in IAU Symposium, Vol. 231, Astrochemistry: Recent Successes and Current Challenges, ed. D. C. Lis, G. A. Blake, & E. Herbst, 117–124
- Gottlieb et al. (1979) Gottlieb, C. A., Ball, J. A., Gottlieb, E. W., & Dickinson, D. F. 1979, ApJ, 227, 422
- Güsten & Downes (1981) Güsten, R. & Downes, D. 1981, A&A, 99, 27
- Güsten & Philipp (2004) Güsten, R. & Philipp, S. D. 2004, in The Dense Interstellar Medium in Galaxies, ed. S. Pfalzner, C. Kramer, C. Staubmeier, & A. Heithausen, 253–+
- Güsten et al. (1981) Güsten, R., Walmsley, C. M., & Pauls, T. 1981, A&A, 103, 197
- Hartquist et al. (1995) Hartquist, T. W., Menten, K. M., Lepp, S., & Dalgarno, A. 1995, MNRAS, 272, 184
- Haschick & Baan (1993) Haschick, A. D. & Baan, W. A. 1993, ApJ, 410, 663
- Hidaka et al. (2004) Hidaka, H., Watanabe, N., Shiraki, T., Nagaoka, A., & Kouchi, A. 2004, ApJ, 614, 1124
- Huettemeister et al. (1998) Huettemeister, S., Dahmen, G., Mauersberger, R., Henkel, C., Wilson, T. L., & Martin-Pintado, J. 1998, A&A, 334, 646
- Huettemeister et al. (1993) Huettemeister, S., Wilson, T. L., Bania, T. M., & Martin-Pintado, J. 1993, A&A, 280, 255
- Kaifu et al. (1974) Kaifu, N., Iguchi, T., & Kato, T. 1974, Pub. Astr. Soc. Japan , 26, 117
- Kaifu et al. (1972) Kaifu, N., Kato, T., & Iguchi, T. 1972, Nature, 238, 105
- Karlsson et al. (2003) Karlsson, R., Sjouwerman, L. O., Sandqvist, A., & Whiteoak, J. B. 2003, A&A, 403, 1011
- Kuiper et al. (1993) Kuiper, T. B. H., Whiteoak, J. B., Peng, R.-S., Peters, III, W. L., & Reynolds, J. E. 1993, Ap. J. (Letters) , 416, L33+
- Leurini et al. (2004) Leurini, S., Schilke, P., Menten, K. M., Flower, D. R., Pottage, J. T., & Xu, L.-H. 2004, A&A, 422, 573
- Liechti & Wilson (1996) Liechti, S. & Wilson, T. L. 1996, A&A, 314, 615
- Lis & Carlstrom (1994) Lis, D. C. & Carlstrom, J. E. 1994, ApJ, 424, 189
- Lis & Menten (1998) Lis, D. C. & Menten, K. M. 1998, ApJ, 507, 794
- Lis et al. (1994) Lis, D. C., Menten, K. M., Serabyn, E., & Zylka, R. 1994, Ap. J. (Letters) , 423, L39
- Liszt (1992) Liszt, H. S. 1992, ApJS, 82, 495
- Lockett et al. (1999) Lockett, P., Gauthier, E., & Elitzur, M. 1999, ApJ, 511, 235
- Martin et al. (2004) Martin, C. L., Walsh, W. M., Xiao, K., Lane, A. P., Walker, C. K., & Stark, A. A. 2004, ApJS, 150, 239
- Martin-Pintado et al. (1997) Martin-Pintado, J., de Vicente, P., Fuente, A., & Planesas, P. 1997, Ap. J. (Letters) , 482, L45+
- Martín-Pintado et al. (2001) Martín-Pintado, J., Rizzo, J. R., de Vicente, P., Rodríguez-Fernández, N. J., & Fuente, A. 2001, Ap. J. (Letters) , 548, L65
- Menten (1991) Menten, K. 1991, in Astronomical Society of the Pacific Conference Series, Vol. 16, Atoms, Ions and Molecules: New Results in Spectral Line Astrophysics, ed. A. D. Haschick & P. T. P. Ho, 119–+
- Menten (2004) Menten, K. M. 2004, in The Dense Interstellar Medium in Galaxies, ed. S. Pfalzner, C. Kramer, C. Staubmeier, & A. Heithausen, 69–+
- Menten & Reid (1995) Menten, K. M. & Reid, M. J. 1995, Ap. J. (Letters) , 445, L157
- Mezger et al. (1974) Mezger, P. G., Smith, L. F., & Churchwell, E. 1974, A&A, 32, 269
- Minh et al. (1992) Minh, Y. C., Irvine, W. M., & Friberg, P. 1992, A&A, 258, 489
- Morris & Serabyn (1996) Morris, M. & Serabyn, E. 1996, ARA&A, 34, 645
- Motte et al. (2003) Motte, F., Schilke, P., & Lis, D. C. 2003, ApJ, 582, 277
- Oka et al. (1998) Oka, T., Hasegawa, T., Sato, F., Tsuboi, M., & Miyazaki, A. 1998, ApJS, 118, 455
- Panagia (1973) Panagia, N. 1973, AJ, 78, 929
- Pierce-Price et al. (2000) Pierce-Price, D., Richer, J. S., Greaves, J. S., Holland, W. S., Jenness, T., Lasenby, A. N., White, G. J., Matthews, H. E., Ward-Thompson, D., Dent, W. R. F., Zylka, R., Mezger, P., Hasegawa, T., Oka, T., Omont, A., & Gilmore, G. 2000, Ap. J. (Letters) , 545, L121
- Pihlström & Sjouwerman (2006) Pihlström, Y. M. & Sjouwerman, L. O. 2006, Journal of Physics Conference Series, 54, 77
- Pottage et al. (2002) Pottage, J. T., Flower, D. R., & Davis, S. L. 2002, Journal of Physics B Atomic Molecular Physics, 35, 2541
- Reid (1993) Reid, M. J. 1993, ARA&A, 31, 345
- Requena-Torres et al. (2006) Requena-Torres, M. A., Martín-Pintado, J., Rodríguez-Franco, A., Martín, S., Rodríguez-Fernández, N. J., & de Vicente, P. 2006, A&A, 455, 971
- Rodriguez-Fernandez et al. (2006) Rodriguez-Fernandez, N. J., Combes, F., Martin-Pintado, J., Wilson, T. L., & Apponi, A. 2006, A&A, 455, 963
- Salii et al. (2002) Salii, S. V., Sobolev, A. M., & Kalinina, N. D. 2002, Astronomy Reports, 46, 955
- Schilke et al. (1997) Schilke, P., Walmsley, C. M., Pineau des Forets, G., & Flower, D. R. 1997, A&A, 321, 293
- Schuller et al. (2005) Schuller, F., Omont, A., Felli, M., Testi, L., Bertoldi, F., & Menten, K. M. 2005, in ESA Special Publication, Vol. 577, ESA Special Publication, ed. A. Wilson, 235–238
- Scoville (1972) Scoville, N. Z. 1972, Ap. J. (Letters) , 175, L127+
- Scoville et al. (1972) Scoville, N. Z., Solomon, P. M., & Thaddeus, P. 1972, ApJ, 172, 335
- Sobolev (1992) Sobolev, A. M. 1992, Soviet Astronomy, 36, 590
- Szczepanski et al. (1989) Szczepanski, J. C., Ho, P. T. P., Haschick, A. D., & Baan, W. A. 1989, in IAU Symposium, Vol. 136, The Center of the Galaxy, ed. M. Morris, 383–+
- van der Veen & Habing (1988) van der Veen, W. E. C. J. & Habing, H. J. 1988, A&A, 194, 125
- van Dishoeck et al. (1993) van Dishoeck, E. F., Jansen, D. J., & Phillips, T. G. 1993, A&A, 279, 541
- Walmsley et al. (1986) Walmsley, C. M., Guesten, R., Angerhofer, P., Churchwell, E., & Mundy, L. 1986, A&A, 155, 129
- Walmsley et al. (1988) Walmsley, C. M., Menten, K. M., Batrla, W., & Matthews, H. E. 1988, A&A, 197, 271
- Whiteoak & Peng (1989) Whiteoak, J. B. & Peng, R.-S. 1989, MNRAS, 239, 677
- Wilson & Rood (1994) Wilson, T. L. & Rood, R. 1994, ARA&A, 32, 191
- Yusef-Zadeh et al. (2007) Yusef-Zadeh, F., Arendt, R. G., Heinke, C. O., Hinz, J. L., Hewitt, J. W., Pratap, P., Ramirez, S. V., Rieke, G. H., Roberts, D. A., Stolovy, S. R., Wardle, M., & Whitney, B. A. 2007, ArXiv e-prints, 705
- Yusef-Zadeh et al. (1999) Yusef-Zadeh, F., Roberts, D. A., Goss, W. M., Frail, D. A., & Green, A. J. 1999, ApJ, 512, 230
- Zylka et al. (1992) Zylka, R., Guesten, R., Henkel, C., & Batrla, W. 1992, A&AS, 96, 525
| Radio name | Sgr D 7 | Sgr D 8 | References |
|---|---|---|---|
| 17 45 01.3 | 17 45 47.1 | 1,2 | |
| 27 42 17 | 27 43 45 | 1,2 | |
| 1.330 | 1.397 | 1,2 | |
| 0.051 | 0.006 | 1,2 | |
| (1.4 GHz)(mJy) | – | 26 | 1 |
| (1.6 GHz)(mJy) | 222 | 21 | 2 |
| (5 GHz)(mJy) | – | 24.2 | 1 |
| IRAS Name | 174502742 | 174572743 | 3 |
| (Jy) | 9.79: | 5.54L | 3 |
| (Jy) | 28.30 | 3.13 | 3 |
| (Jy) | 462.40: | 85.82: | 3 |
| (Jy) | 782.90: | 386.60L | 3 |
| (K) | 47 | 43.5 | 4 |
| (K) | 43.5 | 38.5 | 4 |
| () | 4 | ||
| () | 4 | ||
| () | 33 | 9 | 4 |
| () | 84 | 43 | 4 |
Note. — Flux densities are denoted by an . , , and are dust temperature, bolometric luminosity, and total mass determined from the 25 and 60 m IRAS data when thus indexes, or from the 25, 60, and 100 m data. (1) Becker et al.(1994) (2) Liszt (1992) (3) SIMBAD, a : denotes an uncertain value and an L an upper limit. (4) Lis 2006, pers. comm.
| Species | Transition | Frequencya | |
|---|---|---|---|
| (MHz) | (K) | ||
| CS | 97980.95 | 2.4 | |
| SiO | 86848.96 | 2.1 | |
| CH3OH | 84521.21 | 28.4 | |
| 96739.39 | 0.0 | ||
| 96741.42 | 2.3 | ||
| 96744.58 | 7.6 | ||
| 96755.51 | 15.5 | ||
| 108893.94 | 0.0 |
Note. — a Frequencies and lower state energies are taken from the JPL catalog (http//spec.jpl.nasa.gov/). b For the CH3OH lines, lower level energies are relative to the state for -type lines and relative to the state for E-type lines.
| Nr. | ||||
|---|---|---|---|---|
| 1 | 1.∘5750 | 0.∘0183 | 17h 49m 23.7 | 27∘ 35’ 53” |
| 2 | 1.5939 | 0.0148 | 17 49 18.6 | 33 54 |
| 3 | 1.6418 | 0.0641 | 17 49 43.6 | 33 52 |
| 4 | 1.2829 | 0.0289 | 17 48 31.9 | 49 27 |
| 5 | 1.3690 | 0.1000 | 17 49 13.9 | 49 04 |
| 6 | 1.3168 | 0.0650 | 17 49 00.8 | 50 55 |
| 7 | 1.4110 | +0.0260 | 17 48 51.7 | 42 29 |
| 8 | 1.8053 | 0.3391 | 17 48 01.6 | 33 08 |
| 9 | 1.48211 | +0.0264 | 17 45 51.6 | 38 22 |
| Pos. | Species | Transition | ||||
|---|---|---|---|---|---|---|
| (K) | (K km-1) | (km s-1) | (km s-1) | |||
| 1 | CH3OH | 0.53 | 4.9(0.3) | 56.2(0.2) | 8.7(0.6) | |
| – | – | – | ||||
| CS | 0.31 | 4.6(4.1) | 48.0(5.5) | 13.8(6.4) | ||
| 0.71 | 11.0(4.5) | 61.2(2.3) | 14.4(3.3) | |||
| 0.28 | 8.6(1.3) | 163.2(2.1) | 28.5(5.5) | |||
| SiO | 0.23 | 6.9(0.4) | 53.4(0.6) | 27.4(1.1) | ||
| 0.12 | 1.2(0.3) | 60.1(0.6) | 9.9(1.4) | |||
| 0.10 | 4.1(0.2) | 163.3(1.0) | 37.0(2.3) | |||
| 2 | CH3OH | 0.20 | 3.1(0.3) | 51.6(0.8) | 14.1(1.7) | |
| fitting impossible | ||||||
| fitting impossible | ||||||
| – | – | – | ||||
| CS | 0.23 | 1.5(0.9) | 43.7(1.1) | 5.8(3.2) | ||
| 0.62 | 12.2(1.2) | 58.7(0.9) | 18.6(2.2) | |||
| 0.46 | 12.4(1.0) | 162.3(1.0) | 25.1(2.2) | |||
| SiO | 0.17 | 1.4(0.3) | 42.5(0.4) | 7.7(1.3) | ||
| 0.37 | 10.1(0.5) | 60.3(0.6) | 26.0(1.5) | |||
| 0.21 | 7.0(0.3) | 157.9(0.6) | 30.8(1.6) | |||
| 3 | CH3OH | 0.44 | 4.2(0.2) | 51.9(0.3) | 8.9(0.8) | |
| 1.3 | 12.6(0.5) | 56.2(0.2) | 9* | |||
| 1.4 | 13.0(0.6) | * | 9* | |||
| 1.4 | 13.3(0.4) | * | 9* | |||
| 0.08 | 0.7(0.4) | * | 9* | |||
| – | – | – | ||||
| CS | 0.33 | 13(2) | 73(15) | |||
| 0.61 | 15(2) | 58(1) | 23(2) | |||
| 0.55 | 16(3) | 162(2) | 27(4) | |||
| 0.15 | 4(3) | 197(7) | 27(22) | |||
| SiO | 0.29 | 4.5(0.7) | 45.4(1.1) | 14(2) | ||
| 0.40 | 4.2(0.7) | 56.8(0.4) | 9(1) | |||
| 0.06 | 0.6(0.1) | 182.3(1.0) | 11(2) | |||
| 4 | CH3OH | 0.21 | 8.6(0.5) | 118.5(1.2) | 39.6(2.8) | |
| fitting impossible | ||||||
| – | – | – | ||||
| CS | 0.74 | 45(9) | 106(5) | 57(7) | ||
| 0.20 | 13(9) | 166(21) | 61(27) | |||
| SiO | 0.31 | 20(1) | 116(1) | 61 (2) | ||
| 0.05 | 1.1(0.2) | 179(2) | 20(4) | |||
| 5 | CH3OH | 0.20 | 11.5(0.7) | 79(8) | 55(4) | |
| CS | 0.25 | 6.5(1.1) | 24(6) | |||
| 0.89 | 33(3) | 72(2) | 35(3) | |||
| 0.53 | 17(3) | 109(3) | 30(5) | |||
| SiO | 0.32 | 13(2) | 63(2) | 39(3) | ||
| 0.24 | 11(2) | 101(3) | 42(4) | |||
| 6 | CH3OH | 0.24 | 0.5(0.1) | 17.9(0.3) | 1.8(0.7) | |
| 0.22 | 5.5(0.4) | 80.8(1.0) | 24.1(2.1) | |||
| CS | 0.42 | 38(4) | 48(4) | 84(7) | ||
| 0.82 | 25(3) | 84(1) | 29(3) | |||
| SiO | 0.15 | 5(1) | 44(2) | 31(3) | ||
| 0.39 | 14(1) | 83(1) | 33(1) | |||
| 7 | CH3OH | – | – | – | ||
| CS | 0.32 | 9(3) | 82(3) | 27(5) | ||
| 0.32 | 24(4) | 100(5) | 69(12) | |||
| SiO | 0.12 | 3.7(0.3) | 72(1) | 29(2) | ||
| 0.15 | 8.6(0.1) | 98(1) | 54(2) | |||
| 8 | CH3OH | 0.23 | 8.2(0.6) | 79.0(1.3) | 33.6(3.0) | |
| SiO | 0.24 | 8(4) | 71(1) | 32(6) | ||
| 0.16 | 10(4) | 85(7) | 60(5) | |||
| 9 | CH3OH | fitting impossible | ||||
| CH3OH | 0.21 | 5(1) | 66(1) | 24(3) | ||
| 0.12 | 6(1) | 99(6) | 49(8) | |||
Note. — Columns are, right to left, position at which spectrum was taken (from Table 3), species, transition, corrected antenna temperature, integrated corrected antenna temperature, LSR velocity, and linewidth (FWHM), with the latter four quantities determined from multi-component Gaussian fits. Meaningful fitting was in most cases impossible for the quartet of methanol and modeling of these and other methanol lines are discussed in §5.1. For the fit results for position 4 and are given for the km s-1 system only, with the linewidth fixed to the value of the emission at that velocity. The fitted velocity is that of the lines and the velocities of the other lines were fixed to it. For that position, the CH3OH equivalents of the CS 162 and 197 km s-1 components were too difficult to fit. Upper limits given for the CH3OH, line are 3 times the rms noise.
| Pos. | H | H3OH-) | H3OH-) | |
|---|---|---|---|---|
| (K) | (cm | (cm | (cm | |
| 2 | high velocity clump | |||
| 190 | 3.6104 | 51014 | 51014 | |
| extended cloud | ||||
| 30 | 8104 | 91014 | 91014 | |
| 3 | high velocity clump | |||
| 16 | 4 104 | 11014 | 11014 | |
| extended cloud | ||||
| 60 | 6104 | 61014 | 61014 | |
Note. — Pos. denotes the position (from Table 3) toward which the fitted spectra were taken. and H are the best fit values for the kinetic temperature and the molecular hydrogen density, respectively. H3OH- and H3OH- are the best fit column densities of - and -type methanol, respectively. The calculations assume that both the high velocity clump and the extended cloud are extended relative to the telescope beam.
| Transition | Frequency | References | ||||
|---|---|---|---|---|---|---|
| (GHz) | (K) | (K) | (K) | (K) | ||
| extended cloud | high velocity clump | |||||
| 2 | 12.179 | 1.25 | 0.25 | 0.38 | 0.24 | 1 |
| 4 | 36.169 | 0.5 | 0.26 | 2 | ||
| 5 | 84.521 | 0.34 | 0.23 | 0.26 | 0.10 | 3 |
| 2 | 96.739 | |||||
| 2 | 96.741a | 1.85 | 1.63 | 1.05 | 0.66 | 3 |
| 2 | 96.745 | |||||
| 0 | 108.894 | not detectedb | 0.2 | not detectedb | 0.08 | 3 |
| 8 | 156.489 | 0.00 | 0 | 0.00 | 0 | 2 |
| 2 | 156.602 | 0.17 | 0.08 | 0.13 | 0.05 | 2 |
| 7 | 156.829 | 0.00 | 0 | 0.00 | 0 | 2 |
| 6 | 157.049 | 0.00 | 0 | 0.01 | 0.003 | 2 |
| 5 | 157.179 | 0.00 | 0 | 0.00 | 0.005 | 2 |
| 4 | 157.246 | 0.00 | 0 | 0.00 | 0.01 | 2 |
| 1 | 157.271 | |||||
| 3 | 157.272c | 0.09 | 0.2 | 0.17 | 0.11 | 2 |
| 2 | 157.276 | |||||