The population of early-type galaxies at - New clues on their formation and evolution
Abstract
We present the morphological analysis based on HST-NICMOS observations in the F160W filter ( m) of a sample of 32 early-type galaxies (ETGs) at with spectroscopic confirmation of their redshift and spectral type. The 32 ETGs at are placed on the [, Re] plane according to a Kormendy relation with the same slope of the local one but with a different zero-point which accounts for the evolution they undergo from to . The best fitting of their SED shows that ETGs at are composed of two distinct populations, an older population (oETGs) and a younger population (yETGs) whose mean ages differ by about 1.5-2 Gyr. Young ETGs are not denser than local ones since they follow the size-mass relation of local ETGs and luminosity evolution brings them onto the local Kormendy and size-luminosity relations without the need of size evolution. Old ETGs do not follow the size-mass relation of local ETGs and luminosity evolution does not account for the discrepancy they show with respect to the local size-luminosity and Kormendy relations. An increase of their Re by a factor 2.5-3 (a density decrease by a factor 15-30) from to is required to bring these galaxies onto the local scaling relations. The different properties and the different behaviour shown by the two populations with respect to the scaling relations imply different formation and evolution scenarios. The older population of ETGs must have formed at higher-z in a sort of dissipative gas-rich collapse ables to produce remnants which at are old and compact, scenario which can be fitted qualitatively by some recent hydrodynamic simulations of gas-rich mergers. Given the typical time scale of merging and the old age of their stellar population, oETGs should exist as they are up to . The size evolution they must experience from to must leave unchanged their mass to not exceed the local number of high-mass ( M⊙) ETGs. Thus, major merging cannot fit this requirement. Satellite merging, close encounters and interactions can help at least qualitatively in solving this problem. The younger population of ETGs can be formed later through subsequent episodes of merging which increased progressively their size and assembled their mass down to . At they evolve purely in luminosity since episodes of major merging would bring them far from the local scaling relations.
paolo.saracco@brera.inaf.it
keywords:
Galaxies: evolution; Galaxies: elliptical and lenticular, cD; Galaxies: formation.1 Introduction
The formation and the evolution of early-type galaxies (ETGs, elliptical and bulge-dominated galaxies) occupy an important position among the challenges of the observational cosmology. At least of the stellar mass in the local universe is locked into ETGs. For this reason, the understanding of their build-up and growth is fundamental to trace the galaxy mass assembly in the Universe. Their homogeneous properties, e.g. colors and scaling relations, make them an excellent probe to investigate the history of the stellar mass assembly of galaxies over cosmic times (see e.g. Renzini et al. 2006 and references therein). Most of the recent studies based on samples of ETGs at agree with considering completed their build up at . This statement is supported by the results on the evolution of the stellar mass function of galaxies which do not show any deficit of high-mass galaxies up to (e.g. Fontana et al. 2004; Pozzetti et al. 2007), by the observed evolution of the bright end of the luminosity function of galaxies consistent with the pure luminosity evolution expected for early-types (e.g. Drory et al. 2005; Saracco et al. 2006; Zucca et al. 2006; Caputi et al. 2007; Cirasuolo et al. 2007; 2008), by the observed number density of ETGs at consistent with the one at (e.g. Saracco et al. 2005; Cimatti et al. 2006; Conselice et al. 2007) and by the evolution of the size-mass and size-luminosity relations compatible with a passive luminosity evolution (e.g. McIntosh et al. 2005). If on one hand the agreement among these results provide a clear view of the status and of the evolution of ETGs at , they do not add stringent constraints on the mechanism(s) with which ETGs assemble their mass, pushing at higher the redshift range of interest.
Several studies, indeed, suggest that both the observational and the theoretical efforts aimed at constraining the build up of the stellar mass of ETGs and the shaping of their morphology should be focused at , the redshift range for which the strongest evolution is expected (e.g. Glazebrook et al. 2004; Arnouts et al. 2007). The picture at this redshift is far from being as clear and homogeneous as at because of the difficulties in catching ETGs at high redshift. Indeed, to study the population of ETGs at , a preliminary but not so obvious step has to be overcome: the identification of suitable samples of ETGs with secure redshift determination, spectral classification and confirmed morphological signatures similar to those of the local ETGs. In fact, up to now, only few samples of spectroscopically identified ETGs at have been collected, with no more than a tenth of galaxies morphologically confirmed each: the sample of McCarthy et al. (2004) resulting from the GDDS (Abraham et al. 2004) contains 10 galaxies at ; the sample of Longhetti et al. (2005) derived from the TESIS (Saracco et al. 2003) contains 10 galaxies at and the sample of Cimatti et al. (2008) resulting from the K20 (Cimatti et al. 2002) and the GMASS surveys contains 13 galaxies at . On the basis of the analysis of these few samples, it is well ascertained that ETGs at contain stellar populations formed at in an intense and short lived starburst (Longhetti et al. 2005; Kong et al. 2006; Farrah et al. 2006; Cimatti et al. 2004; McGrath et al. 2007). This information provides a strong constraint on the star formation history of the stellar population of ETGs, that is the epoch at which the stars they host formed. On the other hand, this does not constrain how ETGs grew up: what are the time scale and the mechanism(s) characterizing the growing and the shaping of ETGs ?
Recently, evidence for higher compactness of the ETGs at with respect to the local ones have come out. Daddi et al. (2005) show that a large fraction of their ETGs have smaller sizes (effective radii R kpc) than local ETGs of comparable stellar mass, possibly implying higher stellar densities even if the presence of AGN in some of them could justify the compactness. However, other studies find similar results confirming the apparent smaller sizes of high-z ETGs if compared to the local ETGs with comparable stellar mass (e.g. Di Serego Alighieri et al. 2005; Trujillo et al. 2006a; Cassata et al. 2005). These results are based on HST optical observations sampling the blue and UV rest-frame emission of the galaxies and/or on seeing limited ground-based observations, characteristics which could affect the estimate of the effective radius of high-z early-type galaxies. Moreover, the above results have been obtained by comparing galaxies at different redshift having, in principle, the same stellar mass. However, the stellar mass estimate depends on the spectrophotometric models used to fit the data and on the different model parameters. More recently, Longhetti et al. (2007) have studied the Kormendy relation for a sample of ETGs at using HST-NICMOS observations. They show that these ETGs are at least 2 times more compact than those in the local Universe showing that this apparent high compactness is real and not dependent on the wavelength of observation (see also McGrath et al. 2008 and Buitrago et al. 2008 for similar recent results). Some of these works are based on the small samples quoted above made of a tenth of galaxies spanning a narrow range in luminosity and stellar mass or on samples of candidates ETGs with no confirmation of their redshift and spectral type.
In an attempt to provide new and stronger constraints on the formation of compact/dens high-z ETGs we have studied the main scaling relations (the Kormendy, the size-luminosity and the size-mass relations) for a new sample of 32 ETGs at with spectroscopic confirmation of their redshift and spectral type. The morphological analysis for the whole sample is based on HST-NICMOS imaging in the F160W filter ( m) which samples the rest-frame R-band at the redshift of the galaxies. The sample spans 3 magnitudes in absolute magnitude and more than two orders of magnitude in stellar mass. This paper presents the analysis and the results we obtained from the study of the scaling relations and it is organized as follows. Section 2 is a presentation of our sample describing the criteria used to construct the sample and the data we have at hand. Section 3 describes the methodology used to determine the main physical properties (effective radius, surface brightness, absolute magnitude, stellar mass and age) of the 32 ETGs. Section 4 presents the Kormendy relation while Section 5 presents a discussion of the results obtained in Sec. 4. Section 6 shows the size-luminosity and the size-mass relations while Section 7 places the results in the context of the galaxy formation and evolution scenarios. Section 8 is a summary.
Throughout this paper we use a standard cosmology with Km s-1 Mpc-1, and . All the magnitudes are in the Vega system, unless otherwise specified.
2 Sample selection and HST-NICMOS imaging
The sample of early-type galaxies we constructed is composed of 32 galaxies at selected from different samples and surveys on the basis of their spectroscopic and morphological classification. We restricted our selection to those galaxies having both deep HST-NICMOS observations in the F160W filter ( m) sampling the rest-frame continuum m at and spectroscopic confirmation of their redshift and spectral type. On the basis of these criteria we were able to collect a sample of 32 ETGs. The samples from which they have been extracted are the following:
- 10 ETGs at have been selected from the Galaxy Deep-Deep Survey sample (GDDS, Abraham et al. 2004; McCarthy et al. 2004). According to the spectral classification described in Abraham et al., we selected those galaxies having Class=001 (8 galaxies), i.e. pure signatures of an evolved stellar population, and two galaxies having signatures of a young population superimposed to the older one (Class=101 and 011). These galaxies are listed in Tab. 1 as SA# and have been recently studied also by Damjanov et al. (2008).
- 6 ETGs at have been selected from the sample of Stanford et al. (1997) and belong to the cluster RDCS 0848+4453 in the Linx field. Their spectra show absorption features (Ca II H+K, Mg I and Mg II) and spectral break (B2900, D4000) similar to the present epoch ellipticals (Stanford et al. 2007; Van Dokkum et al. 2003). These galaxies, listed in Tab. 1 as CIG#, have been previously studied also by Moriondo et al. (2000).
- 3 ETGs at have been selected from the sample of Stanford et al. (2004) in the Hubble Deep Field-North (HDF-N) according to their spectral type ST characterizing an old and passive population of stars and on their morphology. They are listed as HDF_#.
- 2 ETGs (HUDF_#) at and at respectively have been selected from the sample of Cimatti et al. (2008; see also Daddi et al. 2005) in the Hubble Ultra Deep Field (HUDF). They are classified as early-types both on the basis of their morphology and on their spectral features.
- the ETG 53W091 has been taken from the paper of Dunlop et al. (1996; see also Spinrad et al. 1996). The spectrum of this galaxy is characterized by absorption features typical of an old stellar population and its light profile is bulge dominated (Waddington et al. 2002).
- The remaining 10 ETGs (S2F# and S7F#) come from our own sample of ETGs spectroscopically classified at in the framework of the TESIS project (Saracco et al. 2003, 2005). The study of their spectro-photometric properties and of their morphology based on multiwavelength data and HST-NICMOS observations are described in previous works (Longhetti et al. 2005, 2007).
The whole sample of 32 ETGs is listed in Table 1 where we also report for each galaxy the photometry in different bands. All the magnitudes, with the exception of the F160W-band magnitude, are taken from the literature as quoted in the Column 4 of the table. The magnitude in the F160W filter is the SExtractor MAG_BEST magnitude (Bertin and Arnouts 1997) that we estimated from the HST-NICMOS images we retrieved from the HST archive. All the magnitudes are in the Vega system. Given the different samples the galaxies have been extracted from, the wavelength coverage is not the same for all the galaxies as well as the filters used. We did not convert the magnitudes derived in slightly different filters from the different surveys to a common filter system since we would have introduced large and possibly systematic errors. We have preferred to keep the original magnitudes as given by the authors and to use the appropriate set of response filter functions in our analysis. We describe the multiwavelength coverage and the filters used in the various surveys in Appendix A.
The median redshift of the sample thus collected is . HST-NICMOS images with the NIC2 (0.075 arcsec/pix) camera are available for the 10 galaxies of our sample and for the galaxy 53W091, i.e. for of the sample. For the remaining galaxies the available images are based on NIC3 (0.2 arcsec/pix) camera. The NIC3 images relevant to the two galaxies in the HUDF were drizzled to 0.09 arcsec/pixel. The 1- limiting surface brightness of the different NICMOS images is reported in Tab. 1. The NICMOS mosaics for the whole sample of ETGs can be retrieved at the web page http://www.brera.inaf.it/utenti/saracco/.
![[Uncaptioned image]](/html/0810.2795/assets/x1.png)
3 Physical parameters of early-type galaxies
3.1 Morphological parameters
We derived the effective radius re [arcsec] and the mean surface brightness (SB) [mag/arcsec2] within re of our galaxies from the NICMOS images by fitting a Sérsic profile (Sérsic 1968) to the observed light profiles. The analytic expression of the adopted profiles is
| (1) |
where and values define the de Vaucouleurs (de Vaucouleurs 1948) and the exponential (disk) profiles respectively. We used Galfit software (v. 2.0.3; Peng et al. 2002) to perform the fitting to the observed profiles. The bi-dimensional Sérsic model has been convolved with the Point Spread Function (PSF) of the NIC2 and the NIC3 cameras modeled by means of the Tiny Tim111www.stsci.edu/software/tinytim (v. 6.3) software package (Krist 1995; Krist J. & Hook R. 2004). The fitting provided us with the semi-major axis of the projected elliptical isophote containing half of the total light and with the axial ratio . We thus derived the circularized effective radius .
To assess the robustness and the accuracy of our estimate of the effective radius of galaxies, we applied the same fitting procedure to a set of simulated galaxies inserted in the real background. The simulations follow those described in details in Longhetti et al. (2007) for the NIC2 images. Here, we summarize the main features of the procedure followed to obtain the simulated observations. We generated with Galfit a set of 100 galaxies described by a de Vaucouleurs profile with axial ratio and position angle PA randomly assigned in the ranges and 0PA180 deg respectively. Magnitudes in the F160W filter were assigned randomly in the range . Effective radii were assigned randomly in the ranges arcsec (corresponding to 1.5-4 kpc at ) for the NIC2 images. In order to verify the absence of a bias against the detection of small effective radii ( arcsec, R Kpc) in the fitting of galaxies in the NIC3 images characterized by a pixel scale of 0.2 arcsec/pix, we simulated here also a set of galaxies with arcsec. The simulated galaxies have been convolved with the NICMOS PSFs and then embedded in the real NIC2 and NIC3 images. We used the simulations described in Longhetti et al. (2007) for the NIC2 galaxies and the images relevant to the sample of McCarthy et al. (2005) to simulate the NIC3 galaxies. We then fit the simulated galaxies with the Sérsic profile and studied the behaviour of the resulting checking our ability in recovering the input value . In Figure 1 we plot the values of the effective radius versus in the case of NIC2 and NIC3 images. It can be seen that in the NIC2 images the effective radius of the galaxies is slightly underestimated by arcsec on average, while in the NIC3 images the mean underestimate is arcsec. The rms measured is 0.04 arcsec in the NIC3 images and 0.02 arcsec in the NIC2 images and are much larger than the formal fitting error on the effective radius.

Thus our fitting tends to slightly underestimate the effective radius . Fig. 1 shows also that the pixel scale of NIC3 does not represent a limit in the detection of small effective radii and thus that no bias is present in our analysis against very small galaxies. The small underestimate of has been taken into account in the following analysis and in the derivation of the mean surface brightnesses by adding the mean offset quoted above to the best fitting values . In Tab. 2 we report the morphological parameters [arcsec] and Re [Kpc] derived from the fitting to the profile of our galaxies and the mean SB in the F160W band
| (2) |
where F160Wtot is the total magnitude in this filter derived by galfit and reported in Tab. 2.
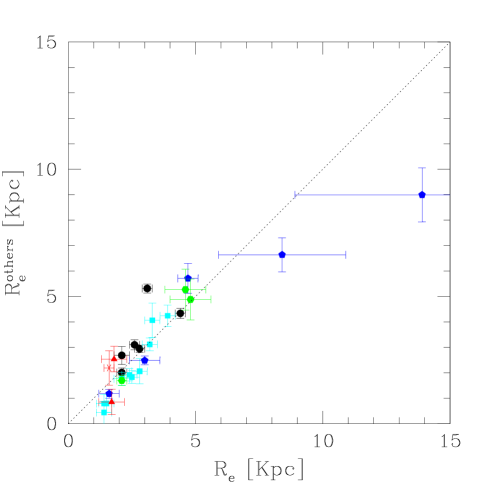
The morphology for some of them, namely the CIG# galaxies, the HDF# galaxies and 53W091, had been already derived in the rest-frame R-band from Moriondo et al. (2000), Stanford et al. (2004) and Waddington et al (2002) respectively. Our new estimates are in good agreement with their estimates in spite of the different method used to fit the profiles. For four galaxies of our sample, namely HUDF_472, HUDF_996, HDF_1031 and HDF_1523, the estimate of the effective radius derived from HST images in the optical bands (F814W and F850W filters) sampling the rest-frame wavelength Å, is also available from the literature. In the case of the two galaxies in the HDF at the estimates of Re we derived from the NICMOS images agree well with those derived by Van Dokkum et al. (2003) from observations in the F814W filter. Our estimate of Re for the galaxy HUDF_996 agrees with the one of Daddi et al. (2005) made on the F850W image while it is a factor two the estimate of Cimatti et al. (2008). For the galaxy HUDF_472 at our estimate is a factor two both the estimate of Daddi et al. (2005) and that of Cimatti et al. (2008). It should be noted that, given the redshift of this latter galaxy, the filters F850W and F160W sample the profile at Å and at Å respectively, two wavelength ranges which differ substantially for the contribution from the young and the old stars respectively. Thus, in this case the different estimates could reflect a real difference of the galaxy profile if observed at such different wavelengths (e.g. McGrath et al. 2008). However, we note that the bi-dimensional fit to the observed images of the two HUDF galaxies (together with those of the two RDCS galaxies with R Kpc) present significant residuals and thus their derived Re could be affected by large errors. The ten SA# galaxies selected from the GDDS have been recently studied by Damjanov et al. (2008). We notice that the effective radii they derive are systematically smaller than ours and that for 3 galaxies they derive effective radii as small as 0.3, 0.4 and 0.7 Kpc respectively, while we never obtain effective radii smaller than 1 Kpc. In Fig. 2 the comparison between the original estimate of the effective radii R [Kpc] obtained by the other groups and our new estimate is shown. The different symbols refer to the different data sets as detailed in the caption of the figure. The original estimate of the effective radii [arcsec] as derived by the other groups are also reported in Tab. 2.
.
3.2 Absolute magnitudes, stellar masses and age
For each galaxy of the sample we derived the R-band absolute magnitude MR, the stellar mass and the mean age of the stellar population. We made use of the stellar population synthesis models of Charlot and Bruzual (2008, CB08) and of the best-fitting code hyperz (Bolzonella et al. 2000) to find the best-fitting template to the observed spectral energy distribution (SED) at the redshift of each galaxy. The set of templates considered includes three star formation histories (SFHs) described by an exponentially declining star formation rate with e-folding time Gyr and two metallicity 0.4 and . We assumed Chabrier initial mass function (IMF; Chabrier et al. 2003). Extinction AV has been considered and treated as a free parameter in the fitting. We adopted the extinction curve of Calzetti et al. (2000) and we allowed AV to vary in the range A. For 24 out of the 32 galaxies the best-fitting template is defined by SFHs with Gyr and .
The R-band absolute magnitude MR has been derived from the observed flux in the F160W filter since it samples the R-band in the rest-frame of the galaxies. To derive MR we used the relation
| (3) |
where F160Wtot is the total magnitude, is the luminosity distance [Mpc] at the redshift of the galaxy and is the color k-correction term defined as
| (4) |
where the two magnitudes and are derived from the best fitting template at and redshifted at the redshift of the galaxy respectively. The uncertainty affecting this k-correction is typically comparable or smaller than the photometric errors since the filter F160W is extremely close to the rest-frame R-band over the whole redshift range considered and thus the dependence on the best fitting template tends to vanish. Indeed we have verified that even considering the oldest template among the best fitting templates (the one 4.0 Gyr old) and the youngest template (1 Gyr old) the difference between the k-correction is less than 0.15 mag over the whole redshift range considered. Thus, even hypothesizing to fail the fit to the observed SED of a galaxy we would wrong its absolute magnitude by no more than 0.1 mag. For this reason we consider our estimate of the R-band absolute magnitude of our galaxies extremely reliable.
The stellar mass of the galaxies we derived is the one usually computed in the literature and it is given by the equation
| (5) |
where is the normalization factor of the best fitting model provided by hyperz and is the mass associated to the best fitting template considering only the stellar mass still locked into stars. This quantity is listed in column 7 of the .4color files of CB08 models. The mass we derived is the mass locked into stars at the epoch of their observation after the gas fraction returned to the interstellar medium. This mass is typically about 60% the one derived including the gas return fraction, i.e. the one obtained by integrating the SFR over the age of the galaxy. A detailed comparison between different stellar mass estimators is given by Longhetti et al. (2008) which provide also the relations to convert an estimate to another accounting for different IMFs. The uncertainty affecting our stellar mass estimate depends mainly on the uncertainty affecting the SFH () and the age of the best-fitting model and on the best-fitting parameter AV, three parameters tightly linked among them. The SFH and the age affect mainly the value of while the extinction AV affect mainly the normalization of the fit. Since we deal with galaxies of known spectral type and redshift the best-fitting SFH and age are sharply constrained producing negligible differences in the values of . For instance, even considering the youngest and the oldest ages possible in this range of redshift, i.e. 1 Gyr and 4 Gyr, the corresponding for the same SFH would differ only by a factor 1.15. On the contrary, the normalization of the model which is a free parameter in the fitting, can vary up to a factor 2 since it depends on the photometric accuracy in the various bands, on the number of photometric points sampling the spectrum of the galaxy and on the free parameter AV. Thus, the internal accuracy of our stellar mass estimates is within a factor two and it is two times the uncertainty affecting the absolute magnitudes. This internal error does not consider the possible systematics due to different IMFs (e.g. Salpeter IMF provides higher stellar masses than Kroupa and Chabrier IMFs) or different library models (see e.g. Maraston et al. 2006; Longhetti et al. 2008). Thus, for a comparison with other samples such possible systematics should be taken into account by scaling, if necessary, the different estimates. Systematics and scaling relations among different library codes can be found in Longhetti et al. (2008).
The mean age of the best fitting model depends both on the SFHs and on the AV in the way that higher AV and shorter SFHs provide younger best fitting models for a given observed spectral energy distribution. As previously said, most of the galaxies (24 out of 32) are best-fitted by the shorter SFHs considered, i.e. by models with Gyr and A suggesting that the best fitting does not tend toward either old or young models, old with respect to the age of the universe at the redshift of the galaxy. However, the main degeneracy is between the age of the best-fitting model and the extinction AV. Indeed, while two different SFHs, for instance the one with and the other , accounts for differences in the best-fitting age of the order of few tenth of Gyr, different values of AV even within the range A can produce differences as large as 1 Gyr. An old stellar population can, in fact, be fitted by a young model reddened by an extinction A. In order to verify the absence of any systematics in our results due to the best fitting procedure we have compared the values of the extinction AV with the age of the best fitting template. In Fig. 3, we plot AV as a function of the age of the best fitting model for the sample of 32 ETGs. No systematics are present among the two parameters confirming that young best fitting templates are not a faked result of the fitting procedure. It is worth noting that, with the exception of two galaxies of the GDDS sample, our estimate of the ages agrees within Gyr (0.5 Gyr for the old ones) with the ages derived by the various authors from the spectral features of the galaxies.

In Tab. 2 we report for each galaxy the R-band absolute magnitude, the stellar mass and the mean age derived for each galaxy from the best fitting to the photometry.
4 The evolution of the Kormendy relation
The Kormendy relation (KR, Kormendy 1977) is a linear scaling relation between the logarithm of the effective radius Re [Kpc], i.e. the radius containing half of the light, and the mean surface brightness [mag/arcsec2]:
| (6) |
The ETGs follow this relation with a fixed slope up to (e.g. Di Serego et al. 2005) while the zero point varies with the redshift reflecting the evolution that the galaxy underwent.
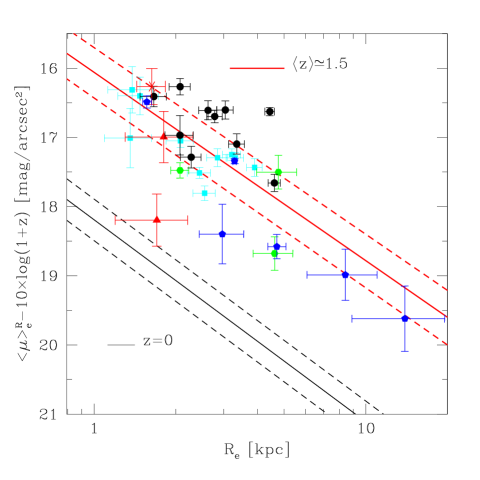
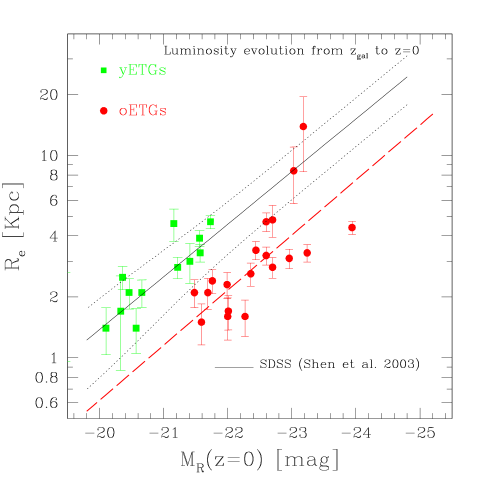
In Fig. 4 (left panel) the values of Re and in the R band for the 32 galaxies at derived as described in the previous section are plotted on the [,Re] plane. The values of have been corrected for the cosmological dimming factor . We converted the surface brightness in the F160W filter into that in the rest-frame R-band applying to each galaxy the k-correction described in the Sec. 3.2. In Fig. 4, the observed KR in the R band at (see La Barbera et al. 2003)
| (7) |
is also shown (thin black line). The thick (red) solid line is the KR we obtain from the best fitting of our sample
| (8) |
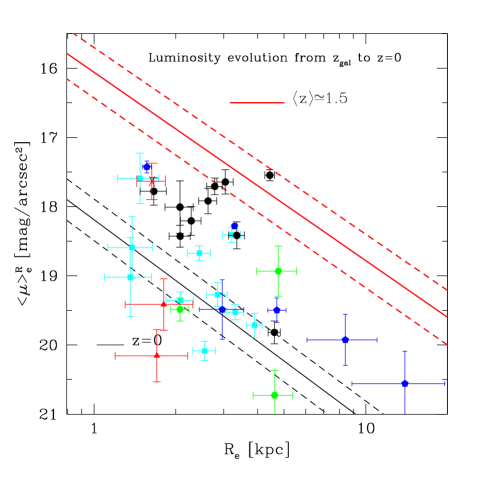
and the two thick dashed lines represent the dispersion at 1 of the relation. It can be seen that the slope of the KR we fit at does not change significantly with respect to the KR at while we detect a significant evolution of the zero-point which changes more than 2 magnitudes in this redshift range. Thus, at least up to ETGs tend to distribute on the [,Re] plane according to a KR with a slope similar to the one of local ETGs . The different zero-point accounts for the evolution which undergo the galaxies and tell us that in case of pure luminosity evolution, i.e. at constant Re, galaxies must evolve by more than 2 magnitudes in the rest-frame R band from to , in agreement with previous results (see e.g. McIntosh et al. 2005; Longhetti et al. 2007; Cimatti et al. 2008). Such evolution exceeds almost 1 mag the one expected assuming an average passive luminosity evolution (PLE) for the whole sample and exceeds much more the evolution inferred from the observed luminosity function of galaxies in this redshift range (e.g. Feulner et al. 2007; Cirasuolo et al. 2007; Marchesini et al. 2007; Zucca et al. 2006; Pozzetti et al. 2003). However, our sample of galaxies is spread over a range of redshift, , which spans about 2.5 Gyr of time, a large interval if compared to the cosmic time at (5.7 Gyr) and at (3.2 Gyr). Thus, in order to assess whether the observed evolution of the zero point of the KR can be accounted for by luminosity evolution, we derived for each galaxy its own luminosity evolution in the rest-frame R-band over the interval , corresponding to the time elapsed from to . The evolutionary term has been calculated taking into account the different ages of the galaxies at the observed redshift as provided by the best-fitting model. Thus, for each galaxy we computed the term i.e. the difference between the R-band absolute magnitude of the best fitting model with age and the R-band magnitude of the same model with age . This term added to equation (3) provides the surface brightness that our galaxies would have at in the case of pure luminosity evolution. In Fig. 4 (right panel) we show how the 32 ETGs of our sample would be displaced at in the [,Re] plane. We see that almost a half of the sample reaches a surface brightness not exceeding the one derived from the KR at while the remaining half shows a surface brightness in excess of 1 magnitude with respect to the local KR. In particular, the luminosity evolution brings 11 ETGs onto the KR at and two ETGs just below it while leaves the remaining 19 ETGs with a surface brightness exceeding much more than one sigma the local KR. It seems that for a fraction of ETGs at the expected luminosity evolution is sufficient to account for their surface brightness. They move in the [,Re] plane from high to low redshift in agreement with the local KR. On the contrary, for the remaining fraction of ETGs the expected luminosity evolution is not sufficient to dim their surface brightness to the one defined by the local KR. The other parameter involved in the KR relation, the effective radius Re, must evolve and the hypothesis of fixed size must be rejected for these galaxies. A size evolution of at least a factor 2.5 from to is needed to account for the observed surface brightness excess.
5 Young VS old ETGs: two distinct populations at ?
In the previous section we have seen that for 13 ETGs the pure luminosity evolution can move them from the KR at onto the KR at , while for the remaining 19 ETGs a different more complex evolution is required. In fact, this suggests that two distinct populations of ETGs exist at . In order to better investigate this evidence, we compared the properties of the 13 ETGs whose luminosity evolution places them onto the KR at with the remaining 19 ETGs. Basically, the luminosity evolution derived by models over a given interval of time depends on the SFH and on the age of the best-fitting model. The SFHs which fit the SED of our galaxies are described by e-folding time much shorter than the typical over which the luminosity evolution is computed ( Gyr to be compared with Gyr from to ). Thus, the slightly different values of cannot produce significant differences in over this interval. Consequently, the other parameter affecting the luminosity evolution, that is the age of the best fitting model, must be the reason of the different behaviour of the two sub-samples. If so, we expect that the two sub-samples of galaxies show a different age distribution.
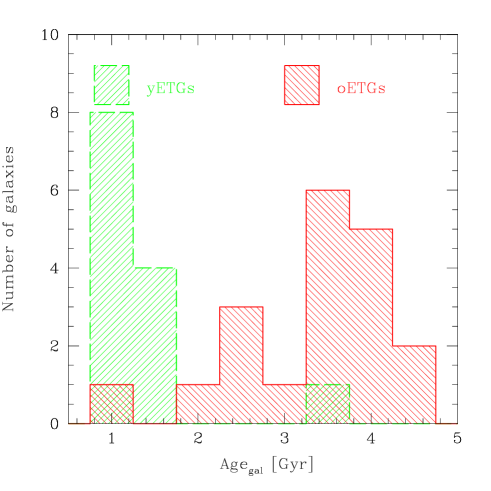
In Fig. 5 the age distribution of the 13 galaxies (dashed green histogram) which agree with the KR at is compared with the age distribution of the remaining 19 ETGs (solid red histogram). It is worth noting that the two sub-samples, with the exception of 2 ETGs (one for each sub-sample), describe two separated distributions. The first distribution is sharply picked at Gyr, the other distribution picks at Gyr. As shown in Sec. 3.2 age and extinction AV, are not correlated and no systematic are present between them (see Fig. 3). Moreover, the different values of considered cannot account for such different ages. Indeed, a galaxy 1 Gyr old fitted by a SFH Gyr would be Gyr old if fitted with a model Gyr. Analogously, a galaxy 4 Gyr old fitted by a SFH Gyr would be Gyr old if fitted with a model Gyr. Thus, the two different distributions are not a consequence of the degeneracy between SFH, age and extinction but they reflect real differences among the ETGs: the 13 ETGs which fall on the local KR are, in fact, younger than the remaining 19 ETGs. Given the uncertainties discussed above, it is reliable to consider a mean difference of about 1.5-2 Gyr between the age of the two populations. Hereafter, we will refer to these two populations as young ETGs (yETGs) and old ETGs (oETGs).
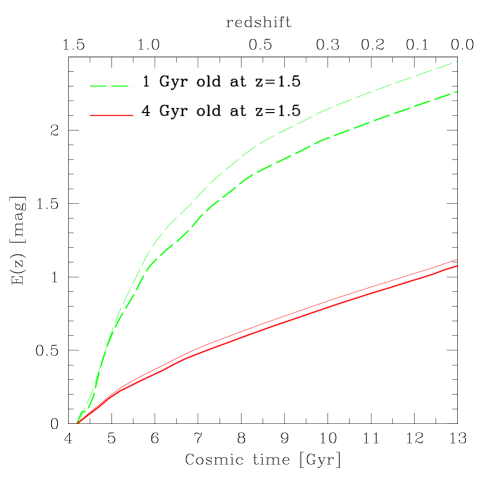
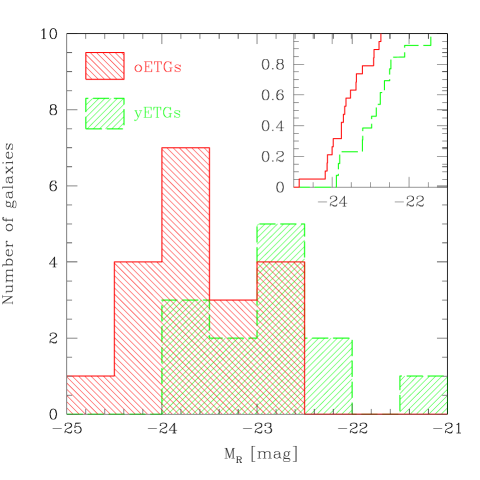
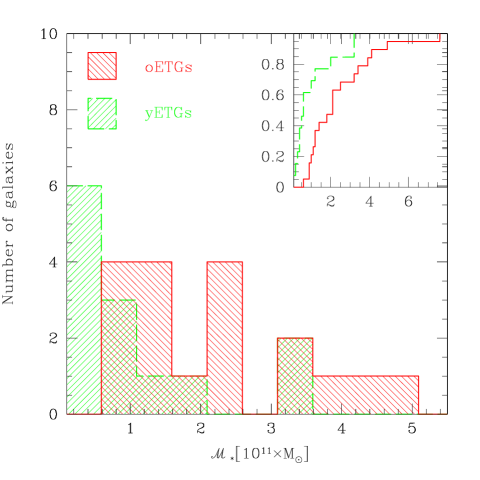
In fact, the different age of the stellar populations of the two sub-samples of ETGs is the reason of their different behaviour with respect to the KR. Figure 6 displays the evolution term in the R-band as a function of the cosmic time (bottom x-axis) or redshift (upper x-axis) for two galaxies whose stellar populations at are 1 Gyr old (dashed red line) and 4 Gyr old (solid red line). The thin lines refer to a SFH with Gyr while the thick lines refer to a Gyr. In fact, we see that the difference in the luminosity evolution between the old and the young stellar population is about 1 mag at independently of the different values of . Thus, the different mean age of the stellar populations of ETGs at is the reason of their different expected evolution. We have compared also the absolute magnitude distribution and the stellar mass distribution of these two populations to gather other information about their evolutionary status and to search for signs of different history of star formation and mass assembly. In Fig. 7 we show the distributions of the absolute magnitude (left panel) and of the stellar mass (right panel) of the yETGs (dashed red histogram) and of the oETGs (solid red histogram). We see that yETGs tend to be less luminous and, accordingly, less massive than the oETGs even if the effect is not statistically significant, as confirmed by the KS-test performed to compare the two distributions (). However, it can be seen that the high-luminosity/mass tail is populated only by old ETGs while the low-luminosity/mass tail is composed of only young ETGs.
The SED fitting of our ETGs is based on optical and near-IR photometry which at samples the wavelength range m. In practice, at this redshift, 6 out of the 8-9 photometric points sample the UV and blue rest-frame emission of the galaxies whose continuum shape is affected by star formation episodes even if involving a negligible fraction of the stellar mass (see e.g. Fig. 2 in Longhetti et al. 2008). For this reason, it is more appropriated to consider the age we derived as a lower limit to the time elapsed since the last episode of star formation. If this latter is the major one, then this age will provide the formation redshift of the stellar population. Given the different age of the two populations of ETGs it is likely that the formation redshift of their stellar populations are different. In particular, the stellar component of the oETGs () formed at while the stellar populations of yETGs () formed at , or at least the youngest population.
Object F160Wtot MR re r Re Age [mag] [mag] [arcsec] [arcsec] [Mpc] [mag/arcsec2] [mag/arcsec2] [Gyr] [1011 M⊙] S2F5_109 1.22 17.470.02 -24.86 0.530.02 – 4.40.2 20.10.1 18.10.1 3.5 7.6 S7F5_254 1.22 19.460.03 -22.91 0.270.02 – 2.30.2 20.80.2 18.60.2 4.5 3.9 S2F1_357 1.34 18.720.03 -23.71 0.330.02 – 2.80.2 20.40.2 18.30.2 4.2 4.9 S2F1_389 1.40 19.790.03 -22.73 0.250.03 – 2.10.3 20.80.2 18.70.2 3.5 1.8 S2F1_511 1.40 19.150.03 -23.64 0.250.02 – 2.10.2 20.10.2 18.10.2 1.0 0.9 S2F1_142 1.43 18.650.03 -24.00 0.360.02 – 3.10.2 20.50.2 18.40.2 3.5 4.1 S7F5_45 1.45 18.830.03 -23.89 0.550.03 – 4.70.3 21.50.1 19.50.1 1.0 2.0 S2F1_633 1.45 19.000.03 -23.67 0.310.02 – 2.60.2 20.50.2 18.50.2 2.6 2.5 S2F1_443 1.70 19.440.03 -23.76 0.400.03 – 3.40.3 21.40.2 19.40.2 3.2 3.4 S2F1_527 1.35 19.500.03 -23.38 0.200.03 – 1.70.3 20.20.2 18.00.2 2.3 1.1 SA12-5592 1.623 20.300.01 -22.85 0.160.04 0.050.05 1.40.3 20.500.4 18.360.4 0.9 0.3 SA12-5869 1.510 19.530.02 -23.20 0.340.04 0.250.06 2.80.3 21.290.3 19.160.3 1.2 0.4 SA12-6072 1.576 20.960.01 -22.11 0.160.04 0.090.04 1.40.3 21.120.4 18.980.4 1.4 0.3 SA12-8025 1.397 19.870.01 -22.92 0.300.04 0.240.03 2.40.3 21.310.3 19.180.3 3.7 0.5 SA12-8895 1.646 19.200.02 -23.84 0.460.04 0.500.05 3.90.3 21.660.2 19.560.2 0.8 0.7 SA15-4367 1.725 20.610.01 -22.64 0.300.04 0.220.03 2.50.3 22.160.3 20.050.3 0.9 0.4 SA15-5005 1.845 20.460.01 -22.97 0.250.04 0.210.03 2.10.3 21.590.3 19.420.3 0.9 0.4 SA15-7543 1.801 19.640.01 -23.80 0.390.04 0.480.08 3.30.3 21.770.2 19.600.2 1.0 0.9 SA22-0189 1.490 19.190.01 -23.76 0.380.04 0.370.03 3.20.3 21.210.2 19.080.2 3.5 1.8 SA22-1983 1.488 20.030.02 -22.78 0.170.04 0.090.04 1.50.3 20.360.4 18.230.4 3.7 1.0 CIG_237 1.271 20.140.03 -22.50 0.350.07 0.290.02 3.00.6 21.960.4 19.890.4 3.5 0.3 CIG_65 1.263 18.850.01 -24.18 0.390.04 – 3.30.3 20.890.2 18.820.2 4.2 2.1 CIG_142 1.277 19.630.02 -23.21 0.190.05 0.140.02 1.60.4 20.060.6 17.990.6 4.2 1.0 CIG_70 1.275 18.020.01 -24.12 1.700.60 1.100.13 13.95.0 23.190.8 21.120.8 4.2 2.1 CIG_108 1.277 18.480.02 -23.97 1.000.30 0.790.08 8.42.5 22.560.6 20.490.6 4.2 1.4 CIG_135 1.276 19.330.02 -23.52 0.560.05 0.680.07 4.70.4 22.150.2 20.080.2 4.3 0.9 HDF_1031 1.015 19.370.03 -22.47 0.260.02 0.21 2.10.2 20.520.2 18.420.2 1.1 0.2 HDF_1523 1.050 17.670.02 -24.13 0.590.10 0.60 4.80.8 20.620.4 18.520.4 2.0 2.1 HDF_ 731 1.755 20.200.05 -23.21 0.550.09 0.63 4.60.8 23.080.4 20.920.4 1.4 0.4 HUDF_472 1.921 20.990.03 -22.75 0.200.06 a0.10(0.08) 1.70.5 21.650.7 19.480.7 0.8 0.4 HUDF_996 1.390 21.430.05 -21.43 0.220.06 a0.31(0.10) 1.80.5 22.240.6 20.130.6 1.3 0.1 53W091 1.55 19.770.04 -23.37 0.190.02 0.300.08 1.60.2 20.330.3 18.190.3 2.4 0.6
a These values have been derived from HST-ACS observations in the F850W filter. The values out of the brackets have been derived from Daddi et al. (2005) those within the brackets from Cimatti et al. (2008).
6 The size-luminosity and the size-mass relations
The dependence of the characteristic size of galaxies on their luminosity and on their stellar mass has been recently studied for large samples of local galaxies (e.g. Shen et al. 2003), at intermediate redshift (, McIntosh et al. 2005) and at high-redshift () (e.g. Trujillo et al. 2004, 2006b; Cimatti et al. 2008; van Dokkum et al. 2008). Shen et al. (2003) on the basis of the SDSS data, show that the size of local early types and late types increases, as expected, according to their luminosity and stellar mass. However, the ETGs follow steeper relations than late types showing that the size of a stellar system is not simply a function of its mass and that the history of its mass assembly can affect these relations (Shen et al.2003). McIntosh et al. (2005) study the evolution of these relations up to by combining GEMS data (Galaxy Evolution from Morphology and SEDs, Rix et al. 2004) with COMBO-17 data (Classifying Objects by Medium-Band Observations, Wolf et al. 2003, 2006b) while Trujillo et al. (2007) extend the study up to thanks to the DEEP-2 survey (Davis et al. 2003; Bundy et al. 2006) and to (Trujillo et al. 2004, 2005) thanks to the FIRES data (Franx et al. 2000). Our data allow us to define these relations for a sample of ETGs at with secure spectroscopic redshift and classification and on the basis of the morphology derived by their red rest-frame continuum.
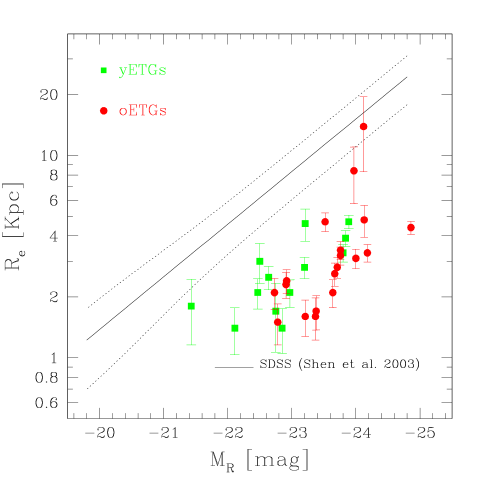
The size-luminosity (S-L) relation for our sample at is shown in Fig. 8 (left panel) and it is compared with the relation found in the band by Shen et al. (2003) using the Sersic half light radius for local ETGs (solid line)
| (9) |
The dotted lines represent the scatter of the relation. Young ETGs are marked with (green) squares while old ETGs with (red) points. The R-band absolute magnitude MR of our galaxies is the one at the redshift of the galaxies. The offset with respect to the relation of Shen et al. reflects the evolution which ETGs undergo from their redshift to , the same evolution observed in the comparison of the KR shown in Fig. 4 (the one at and that at ). It is worth noting that the difference between the photometric band of the SDSS and the Cousins band we use is about 0.2 mag (Fukugita et al. 1995). Thus the possible uncertainties related to the transformation between the two filters are negligible.
In the right panel of Fig. 8 we show how the 32 ETGs of our sample would be displaced at in the [, Re] plane in case of pure luminosity evolution, i.e. the R-band absolute magnitude plotted is . In this case the different behaviour shown by the young ETGs with respect to the old ETGs is even sharper than in the case of the KR (Fig. 4). It is evident the agreement between the young ETGs and the local size-luminosity relation once considered their own luminosity evolution. All the yETGs are located within the scatter region of the relation. On the contrary, it is evident the disagreement between the old ETGs and the local S-L relation, disagreement which shows clearly that Re must change from to . It is worth noting that the calibration of the S-L relation based only on the oETGs data is:
(dashed (red) line in Fig. 8), a relation with the same slop of the one at but with an offset of in the zero point corresponding to a factor in Re.
In Fig. 9 our galaxies (filled symbols) are plotted on the size-mass (S-M) plane and compared with the S-M relation found by Shen et al. (2003) for the local ETGs (solid line) expressed by the following equation
| (10) |
The stellar mass they use is the one from Kauffmann et al. (2003) based on the Bruzual and Charlot (2003, BC03) models and on the Kroupa (2001) initial mass function while we used the CB08 models and Chabrier IMF. Longhetti et al. (2008) show that the stellar mass obtained with Kroupa IMF differs by less than 5% from the one obtained with Chabrier IMF and that the use of BC03 models leads to over-predict the mass estimate by a factor 1.2-1.3 with respect to CB08 models. Thus, we decided not to apply any scaling factor to the relation found by Shen et al. (2003) given such small differences. Figure 9 shows that while 9 out of the 13 yETGs (70%) follow this size-mass relation at only 4 out of the 19 oETGs (20%) agree with this relation. The yETGs for which the luminosity evolution is requested to bring them on the local S-L relation, do not need any mass or size evolution since they naturally match the local S-M relation. In other words, this is an evidence that yETGs are fully compatible with a simple evolution from to of their ratio due to pure luminosity evolution while their stellar mass remains unchanged. On the contrary, the old ETGs follow well defined S-L and S-M relations but almost all of them have sizes much smaller than at implying that they have changed significantly their structure from to . Using the relation of Shen et al. (e.q. 10) we have derived the mean value , i.e. the ratio between the radius Re of the 15 oETGs which do not follow the local S-M relation and the radius of the local ETGs with similar mass. We have obtained in agreement with the value 3.4 found by Cimatti et al. (2008) in the same redshift range. Thus, the oETGs must increase their size by a factor 2.6 from to , consistently with the result obtained from the KR and the S-L relation. It is worth noting that even hypothesizing that we have systematically overestimated by a factor 2 the mass of all the oETGs their effective radius would be still 1.7 times larger then locally, i.e. they would be 5 times denser. To move the oETGs onto the local S-M relation their stellar mass should be 6 times smaller, a factor too large to be accounted for by any model assumption.
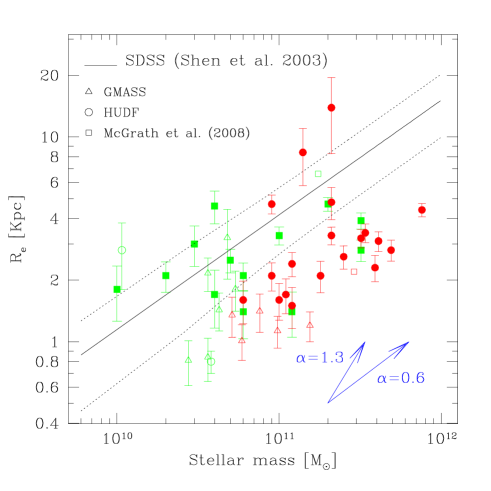
In Fig. 9 a collection of ETGs at (open symbols) taken from the literature is also shown. Triangles, circles and squares mark the GMASS galaxies from Cimatti et al. (2008), the two HUDF galaxies from Daddi et al. (2005) and the two spheroids of McGrath et al. (2008) respectively. The redshift and the spectral type of these ETGs are spectroscopically confirmed and the morphology is based on HST-ACS observations. According to the analysis performed by the authors and to the parameters they derived, we divided this sample of ETGs in old and young defining old those ETGs with age larger than 2 Gyr. The old ETGs are marked by red open symbols while the young ETGs are marked by green open symbols. It is remarkable the agreement with the behaviour shown by our sample of 32 galaxies: young ETGs tend to distribute according to the local S-M relation (6 out of 9) while none of the old ETGs follow the local S-M relation.
It should be noted however that a non negligible fraction of yETGs, both in our sample of 32 ETGs and in the sample taken from the literature, does not follow the S-M relation but follows the relation defined by the old ETGs. Thus, for some yETGs a major size evolution is still required. If this result will be confirmed on a more solid statistical ground proving that it is not due to an internal scatter in the estimate of the physical parameters (age, stellar mass and effective radius), it implies that yETGs follow different histories of assembly and are less homogeneous than old ETGs. We will try to constrain their evolutionary path in the next section.
7 Constraining the formation and the evolution of ETGs
The analysis performed in the previous sections shows that two populations of ETGs exist at . They differ substantially for the age of their stellar populations by about 2 Gyr and for the scaling relations they follow. It is natural to ask how these two populations evolved from to to match the properties of the local ETGs and which is their assembly history they followed to have the properties shown at . We have tried to answer to these questions placing our results in the hierarchical paradigm of galaxy formation and evolution taking into account the results obtained from various renditions of merging models.
7.1 Tracing the evolution at
The older ETGs of our sample at do not follow the S-M relation of local ETGs as well as the other scaling relations. Pure luminosity evolution from their redshift to does not bring them onto the local KR and S-L relation. oETGs are characterized by effective radii R2.5-3 times smaller than those of the local ETGs with comparable surface brightness, absolute magnitude and stellar mass as deduced from the comparison with the local KR, S-L and S-M relations. Thus, an evolution of their size between and must occur to bring them onto the local scaling relations. Such size evolution is often used to advocate the merging processes the ETGs should experience during their life in the hierarchical paradigm of galaxy formation and evolution (e.g. Trujillo et al. 2004, 2007; Bell et al. 2006; De Lucia et al. 2006; van Dokkum et al. 2008; van der Wel et al. 2008). Merging is indeed usually invoked as the most obvious and efficient mechanism to increase the size of galaxies.
Boylan-Kolchin et al. (2006, BK06 hereafter), using simulations of dissipation-less merging, the so called ”dry merging” (e.g. van Dokkum et al. 2005; Bell et al. 2006 and references therein) show that the remnants of dry mergers lie on the fundamental plane (FP, Djorgovsky and Davis 1987; Dressler et al. 1987) of their progenitors. However, the locations of the remnants in the projections of the FP, in particular on the Re- relation, depends strongly on the merger orbit. Thus, the projections of the FP can provide a tool to investigate the assembly history of ETGs. In their analysis, they find that the expected increase of the size of an ETG due to merging follows the relation R with (represented by vectors in Figure 9) depending on the orbital properties (see also Nipoti et al. 2002; Ciotti et al. 2007). They show also that the index is almost independent of the mass ratio of the progenitors (see also Khochfar and Silk 2006 for a similar result) suggesting that their findings are applicable both to minor and major mergers. We have tried to consider this model of dry merging to increase the size of oETGs. We have seen that the effective radii of oETGs must increase by a factor from to in order to match the local S-M relation. Thus, the condition where and are the radii before (initial) and after (final) the merging must be satisfied. From the relation of BK06 it follows that where and are the masses before and after the merging. Consequently the mass that the remnant must reach to increase the size 2.6 times is
| (11) |
The most efficient way to move oETGs from their location onto the local S-M relation is for (see vectors in Fig. 9), the maximum value found by BK06 which, by the way, minimizes the stellar mass of the remnant. We thus obtain
| (12) |
i.e. the mass of the remnant is at least twice the mass before the merging. Any value of lower than 1.3 would produce larger masses. This result is difficult to reconcile with the number density of high-mass ETGs in the local universe. Indeed, this mechanism would produce too much ETGs with masses much larger than 1011 M⊙ and an evolution in the stellar mass density at which is not observed (see e.g. Conselice et al. 2007). For instance, Saracco et al. (2005) show that the 7 galaxies S2F1# also studied in the present paper, account for 70% of the local population of ETGs with comparable luminosity and mass. If they twice their mass/luminosity, at we should observe 2-3 times more ETGs with masses M⊙ then those in fact observed. Moreover, as previously noticed by Cimatti et al. (2008), it is difficult to imagine that given all possible orbital parameters in merging events, the effective value of is always close to the maximum one. Finally, we recall that values would worsen the disagreement with the local number of high-mass ETGs. Thus, we conclude that merging cannot be the mechanism with which oETGs increase their size at and that it is not the way to solve the problem. Other mechanisms able to increase the size but to leave nearly unchanged the mass of ETGs must occur. Close encounters or, more generally, interactions between galaxies can act in this way. Their frequency and thus their efficiency depend on the number of close encounters that a galaxy can experience in the last 9-10 Gyr of its life, a number that perhaps can be constrained from the statistics of pairs and from simulations. Minor or ”satellite” merging (e.g. Naab et al. 2007), i.e. merging between galaxies with masses and in the ratio 0.1:1 or lower, would produce remnants with masses of the order of but with larger size. It is not clear the ability of this kind of merging in enlarging the size, however it could act in the right way contributing to solve the problem of the small sizes of oETGs.
The younger population of ETGs, the yETGs, follows the size-mass relation of local ETGs, with few exceptions. Luminosity evolution from to , i.e. for fixed size Re, would bring the yETGs onto the local KR and S-L relation. Thus, for these galaxies, the evolution of the ratio due to the expected luminosity evolution explains their observed properties at and brings them to agree with the scaling relations of local ETGs. This suggests that the build-up of yETGs was already completed at providing no evidence in favor of merging at since it would bring them out of the S-M relation and the other scaling relations. Indeed merging, to move yETGs along the S-M relation, should take place for values (see vectors in Fig. 9) producing remnants with masses . For the analogous reasons discussed above, it is difficult to imagine that given all possible orbital parameters in merging events, the effective value of for yETGs is always close to the minimum one. Moreover, the luminosity at of the remnant should dim according to the increased size in order to match the KR and the S-L relation. These requirements and fine tuning make this picture rather unlikely. Finally, the reasoning relevant to the exceeding number of remnant ETGs with masses well in excess to M⊙ applies also in this case, and corroborates the conclusion that the assembly of yETGs was completed at and that no merging has happened at . We cannot rule out that yETGs may experience satellite merging at if it leaves nearly unchanged their size besides their stellar mass.
For the reasons here discussed we can conclude that ETGs, both young and old, have already reached their final stellar mass at . Major merging at redshift , if any, must necessarily involve a negligible fraction of the old ETGs while satellite merging could involve both yETGs and oETGs even if in a different way.
7.2 Constraining the path at : toward the formation of ETGs
The older ETGs are characterized by a median age of about 3.5 Gyr (and a dispersion of about 1 Gyr) which implies that their stars formed at . Given the short time they have at disposal to form masses of the order of M⊙ of stars the star formation rate was necessarily M⊙/yr (see also Cimatti et al. 2008, 2004; McCarthy et al. 2004; Daddi et al. 2005; Longhetti et al. 2005; Feulner et al. 2005; Kriek et al. 2006). Moreover, oETGs are 2.5-3 times smaller than those at thus the physical mechanism(s) acting at must be capable also to produce very compact galaxies with stellar densities 15-30 times higher than the local ones and than the yETGs. Dissipational gas-rich merging can produce highly compact massive early-type galaxies if a high fraction of stars of the remnant formed during the merger in a violent starburst (e.g. Kochfar et al. 2006; Springel and Hernquist 2005). However, it is not clear whether the typical time scale of major merging can fit with the requirements above ( Gyr from Boylan-Kolchin et al. 2008). Naab et al. (2007), with their ab initio hydrodynamics simulations, show that the early formation phase of galaxies can start with an initial burst of star formation at accompanied by mergers of gas-rich small sub-components and in situ intense star formation. Although some fraction of the stars is accreted (the ”quiescent” component, Khochfar et al. 2006b) Naab et al. show that this phase has the characteristics of a dissipative collapse since it happens on very short timescale. Thus, the compactness of ETGs produced through the gas-rich merging of Kochfar et al. (2006) and the rapid dissipative collapse of Naab et al. (2007) provide a scenario which seems to fit, at least qualitatively, the intense SFR required at and the need to assemble ETGs which at are compact and old.
The younger population, the yETGs, is characterized by a median age of 1 Gyr and a dispersion of about 0.2 Gyr which push the last burst of star formation at . In this case the constraints on the possible physical mechanism(s) acting at are less stringent than those required to assemble oETGs at the same redshift. A scenario in which yETGs accreted stellar mass by subsequent episodes of merging and by star formation in situ (which can also be triggered by satellite and secondary merging events) can qualitatively fit the properties of these yETGs which at must appear younger and already enlarged in their size if compared with the local ones. The few of them which appear much more compact than the others yETGs could be the results of the gas-rich merging scenario proposed by Kochfar et al. (2006) and Naab et al. (2007) characterized by a rapid dissipative collapse happened at .
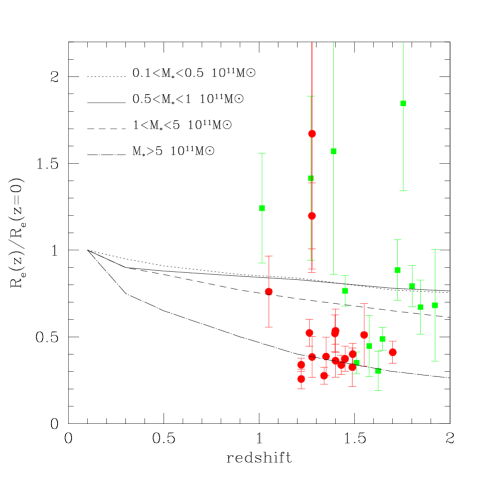
From the observational point of view, the two populations of ETGs should have different progenitors. oETGs must experience a phase of intense star formation at high-z (z), yETGs can experience this phase at lower redshift or experience subsequent episodes of star formation possibly triggered by satellite merging. In any case a different epoch of formation and assembly must characterize the two populations of ETGs. This result qualitatively agrees with the model of Khochfar and Silk (2006) which indicates that the scatter in the size of similar present-day ellipticals is a result of their formation epoch, with smaller ellipticals formed earlier through mergers much richer of gas than the mergers assembling larger ellipticals. In Fig. 10 the predicted evolution of sizes for ETGs with respect to the sizes of their local counterparts from the model of Khochfar and Silk (2006) is compared to the observed ratio RR for our sample of 32 ETGs. This ratio has been obtained for each galaxy dividing the observed effective radius by that derived by the S-M relation of Shen et al. (2003) for the same mass of the galaxy. As expected oETGs are preferentially located on the curve representing the largest ratio which is expected for the highest-mass ETGs since they should form much earlier in the model. On the contrary yETG are preferentially located onto or even above the curves representing the minimum size evolution which is expected for the lower mass ETGs which should form later. It is worth noting that while this model reproduces very well the observed relation between size evolution and formation epoch of ETGs (the older the more compact/denser) the correlation with the stellar mass is less evident from our data and a larger sample would be needed to probe this issue.
As to the progenitor candidates, as suggested by Cimatti et al. (2008), a possible population of progenitors could be the sub-mm selected galaxies seen at (e.g. Blain et al. 2002; Tacconi et al. 2006, 2008) whose characteristics could fit those of ETGs at . Even if it is difficult to identify the progenitors we can tray to constrain their redshift. Given the properties of oETGs (old and compact at ) and the typical time scale of merging ( Gyr), we should expect to see oETGs till , the only difference should be the age of their stellar population correspondingly younger. On the contrary, yETGs should appear quite different at , most probably in the phase of merging, or star forming and interacting with other galaxies.
8 Summary and conclusions
We presented the morphological analysis of a sample of 32 ETGs at with spectroscopic confirmation of their redshift and spectral type based on HST-NICMOS observations in the F160W filter. These 32 ETGs have been selected from different samples and surveys on the basis of their spectroscopic and morphological classification and are characterized by a multiwavelength coverage. The HST-NICMOS observations in the F160W filter have allowed us to derive the effective radius Re and the mean surface brightness of galaxies in the rest-frame R-band of the galaxies, less affected by morphological k-correction and star formation then the optical bands usually used in the previous works. Through the best fitting of their SEDs at known redshift we derived the R-band absolute magnitude, the stellar mass and the age for each of them. The main results of the analysis we performed can be summarized as follows.
-
•
The 32 ETGs of our sample at are placed on the [,Re] plane defining a relation with the same slope of the KR at but with a different zero-point which accounts for the evolution they undergo from to . We do not see differences between the 6 ETGs in clusters and the other ETGs in agreement with other works (e.g. Rettura et al. 2008; Gobat et al. 2008) even if the very low statistics we have do not allow us a detailed comparison of different environments.
-
•
The ETGs of our sample are composed of two distinct populations which differ for the age of their stellar populations: the older population, the oETGs, has a median age of about 3.5 Gyr which implies that the bulk of stars formed at ; the younger population, the yETGs, has a median age of about 1 Gyr and correspondingly . Even if the absolute values of these ages can be model dependent, the different age cannot be accounted for by any model assumption while it is reliable an age difference of about 1.5-2 Gyr for the two populations of ETGs. yETGs tend to be less luminous and correspondingly less massive than oETGs even if this tendency is more evident in the tails of the distributions.
-
•
yETGs follow the size-mass relation locally observed (Shen et al. 2003) and their expected luminosity evolution from to at fixed size Re brings them onto the local KR and size-luminosity relation. Thus, their surface brightness and stellar mass density do not exceed those of local ETGs with comparable luminosity and stellar mass, i.e. no size evolution is required at . These properties suggest that young ETGs have already completed the growth of their stellar mass at being them onto the S-M relation and that they must evolve at purely in luminosity to match the local KR and S-L relation. This provides no evidence in favor of major merging at since it would bring them out of the local scaling relations.
-
•
oETGs do not follow the local size-mass relation since they have sizes 2.5-3 times smaller then those provided by the S-M relation at their stellar masses. Pure luminosity evolution from their redshift to is not sufficient to bring them onto the local KR and S-L relation. Also in this case the effective radii are 2.5-3 times smaller than the local ETGs with comparable surface brightness and absolute magnitude. Thus, an evolution of their size at must occur to reconcile the oETGs with the local population of ETGs. Major (dry) merging at cannot solve the problem since it would produce too much ETGs with stellar masses M⊙ and it should happens only under particular orbit conditions to move oETGs onto the local S-M relation. Other mechanisms able to increase the size and to keep constant the stellar mass of oETGs (e.g. satellite merging, close encounters) must be invoked.
-
•
The different properties shown by the yETGs and the oETGs at imply different evolutionary paths from their formation to . oETGs are much more compact and hence denser than local ones (15-30 times denser than the local ETGs with comparable stellar mass and than yETGs) they are old with respect to the age of the universe at their redshift. Thus, their stellar mass must have formed at high-z () following a sort of dissipative gas-rich collapse ables to form rapidly most of the stellar mass thus producing a compact old remnant at . This scenario is qualitatively fitted by the merging models of Khochfar et al. (2006) and Naab et al. (2007). Considering the typical time scale of merging ( Gyr; Boylan-Kolchin et al. 2008) and the age of the stellar population of oETGs, we conclude that oETGs must exist as they are till with stellar populations correspondingly younger. Progenitors should be searched for among the population of galaxies at as high-mass galaxies with intense star formation. Possible candidates could be the sub-mm/selected galaxies (e.g. Blain et al. 2002; Tacconi et al. 2006, 2007) as suggested by Cimatti et al. (2008).
The formation scenario for the yETGs seem to be rather different even if less constrained with respect to the one of the oETGs. The age of the yETGs implies that the last burst of star formation has taken place close to their redshift, i.e. . They are not denser than the local one and are placed on the local S-M relation. They have completed their stellar mass growth as the oETGs but in a way such that their size is larger. Major merging, satellite merging and close encounters coupled with star formation in situ can qualitatively fit these requirements producing at ETGs with a young component of the stellar population and sizes comparable to those of the local ETGs with similar stellar mass, surface brightness and luminosity. This population of yETGs should appears at as star forming and/or interacting galaxies.
On the basis of the above results we believe that a key observational test would be the measure of the velocity dispersion of oETGs and yETGs since such quantity would unambiguously address the question whether the two populations are dynamically different thus providing unique constraints on the mechanism of their formation and on their size evolution at .
Appendix A Photometry of the sample
In Table 1 the multiband photometry for the whole sample of early-type galaxies is reported. With the exception of the F160W-band magnitude which we have estimated on the HST-NICMOS images, the other magnitudes have been taken from the literature.
The photometry of the two galaxies in the HUDF previously studied by Daddi et al. (2005) and by Cimatti et al. (2008) comes from the catalog of Coe et al. (2006). Namely, the B, V, R, z and J magnitudes are the magnitudes measured through the HST filters F435W, F606W, F775W , F850W and F110W respectively. The Ks-band magnitude are taken from Cimatti et al. (2008) and comes from VLT-ISAAC observations in the Ks filter.
For the sample of Longhetti et al. (2005), the magnitudes are those from the MUNICS survey whose optical filters are slightly different from the standard Kron-Cousins filters. A detailed description of the MUNICS photometry and of the filter response is given by Drory et al. (2001).
The seven-filters (B, V, R, I, z, H, K) photometry of the 10 ETGs selected from the GDDS (Abraham et al. 2004) was originally taken from the photometric catalogs of the Las Campanas Infrared Survey (LCIR survey McCarthy et al. 2001). The observations of the fields, the filters used and the photometric information are described in Chen et al. (2002) and Firth et al. (2002).
The photometry of the 6 galaxies at belonging to the cluster RDCS 0848+4453 in the Linx Supercluster is taken from the paper of Stanford et al. (1997). The three galaxies CIG_135, CIG_108 and CIG_142 seem to coincide with the three galaxies studied by van Dokkum et al. (2003). The photometry is described in Stanford et al (1997) and subsequent observations are quoted in Mei et al. (2006).
The photometry of the three galaxies in the HDF-N previously studied by Stanford et al. (2004) are partly taken from the HDF-N catalog (v2). The magnitudes in the filters B, V and I are in fact the magnitudes measured through the HST filters F450W, F606W and F814W.
The photometry in the R, H and K bands of the galaxy 53W091 are taken from the papers of Dunlop et al. (1996) and Spinrad at al. (1997). The I and J magnitudes are the magnitudes in the F814W and F110W filters respectively taken from Waddington et al. (2002).
Acknowledgments
We thank the anonymous referee for the useful comments and suggestions. Based on observations made with the NASA/ESA Hubble Space Telescope, obtained at the Space Telescope Science Institute, which is operated by the Association of Universities for Research in Astronomy, Inc., under NASA contract NAS 5-26555. This work has received partial financial support from the Istituto Nazionale di Astrofisica (Prin-INAF CRA2006 1.06.08.04) and from ASI (contract I/016/07/0).
References
- (1) Abraham R.G., Glazebrook K., McCarthy P.J., et al., 2004, AJ, 127, 2455
- (2) Arnouts S., Walcher C. J., Le Fevre O., et al. 2007, A&A, 476, 137
- (3) Bell E. F., et al. 2006, ApJ, 640, 241
- (4) Benítez N., Broadhurst T., Bouwens R., et al., 1999, ApJ, 515, L68
- (5) Bertin E, Arnouts S. 1996, A&AS, 117, 393
- (6) Blain A., Smail I., Ivison R. J., Kneib J.-P., Frayer D. T. 2002, Physics Rep., 369, 111
- (7) Boylan-Kolchin M., Ma C.-P., Quataert E. 2006, MNRAS, 369, 1089
- (8) Boylan-Kolchin M., Ma C.-P., Quataert E. 2008, MNRAS, 383, 93
- (9) Bolzonella M., Miralles J.-M., Pellò R. 2000, A&A 363, 476
- (10) Bruzual A.,G. & Charlot S. 2003, MNRAS 344, 1000
- (11) Buitrago F., Trujillo I., Conselice C. J., Bouwens R. J., Dickinson M., Yan H. 2008, ApJL, submitted [ar.Xiv:0807.4141]
- (12) Bundy K., Ellis R. S., Conselice C. J., et al. 2006, ApJ, 651, 120
- (13) Calzetti D., Armus L., Bohlin R. C., Kinney A. L., Koorneef J., Storchi-Bergmann T. 2000, ApJ, 533, 682
- (14) Caputi K. I., Lagache G., Yan L., et al. 2007, ApJ, 660, 97
- (15) Cassata P., et al. 2005, MNRAS, 357, 903
- (16) Chabrier G. 2003, PASP, 115, 763
- (17) Chen H.-W., et al. 2002, ApJ, 570, 54
- (18) Cimatti A., et al. 2002, A&A, 392, 395
- (19) Cimatti A., Daddi E., Renzini A., et al. 2004, Nature, 430, 184
- (20) Cimatti A., Daddi E., Renzini A., 2006, A&A, 453, L29
- (21) Cimatti A., et al. 2008, A&A, in press [arXiv:0801.1184]
- (22) Ciotti L., Lanzoni B., Volonteri M. 2007, ApJ, 658, 65
- (23) Cirasuolo M., McLure R. J., Dunlop J. S., et al. 2007, MNRAS, 380, 585
- (24) Cirasuolo M., McLure R. J., Dunlop J. S., et al. 2008, MNRAS, submitted [arXiv:0805.1335]
- (25) Coe M. J., Benítez M., Sánchez S. F., Jee M., Bouwens R., Ford H. 2006, AJ, 132, 926
- (26) Conselice C. J., et al. 2007, MNRAS, 381, 962
- (27) Daddi E., Renzini A., Pirzkal N., et al. 2005, ApJ, 626, 680
- (28) Damjanov I., et al. 2008, ApJ, submitted [arXiv:0807.1744v2]
- (29) Davis M., et al. 2003, proc. SPIE, 4834, 161
- (30) De Lucia G., Springel V., White S. D. M., Croton D., Kauffmann G. 2006, MNRAS, 366, 499
- (31) de Vaucouleurs G. 1948, Ann. d’Astrophys. 11, 247
- (32) di Serego Alighieri S., et al. 2005, A&A, 442, 125
- (33) Djorgovsky S., Davis M., 1987, ApJ, 313, 59
- (34) Dressler A., Lynden-Bell D., Burstein D., Davies R. L., Faber S. M., Terlevich R., Wegner G., 1987, ApJ, 313 42
- (35) Drory N., Feulner G., Bender R., et al. 2001, MNRAS 325, 550
- (36) Drory N., Salvato M., Gabasch A., Bender R., Hopp U., Feulner G., Pannella M. 2005, ApJ, 619, L131
- (37) Dunlop J., Peacock J., Spinrad H., Dey A., Jimenez R., Stern D., Windhorst R., 1996, Nature, 381, 581
- (38) Farrah D., et al. 2006, ApJ, ApJ 641, L17
- (39) Feulner G., Gabasch A., Salvato M., Drory N., Hopp U., Bender R. 2005, ApJ, 633, L9
- (40) Feulner G., Goranova Y., Hoop U., Gabasch A., Bender R., Botzler C. S., Drory N. 2007, MNRAS, 378, 429
- (41) Firth A., et al., 2002, MNRAS, 332, 617
- (42) Fontana A., Pozzetti L., Donnarumma I., et al. 2004, A&A, 424, 23
- (43) Franx M., et al. 2000, The Messenger, 99, 20
- (44) Fukugita M., Shimasaku K., Ichikawa T. 1995, PASP, 107, 945
- (45) Glazebrook K., et al. 2004, Nature, 430, 181
- (46) Gobat R., Rosati P., Strazzullo V., et al. 2008, A&A, in press [arXiv:0806.4537]
- (47) Kauffmann G., et al. 2003, MNRAS, 341, 33
- (48) Khochfar S., Silk J. 2006, ApJ, 648, L21
- (49) Khochfar S., Silk J. 2006b, MNRAS, 370, 702
- (50) Kormendy J. 1977, ApJ 218, 333
- (51) Kong X., et al. 2006, ApJ, 638, 72
- (52) Kriek et al. 2006, ApJ, 649, L71
- (53) Krist J. & Hook R. 2004, in The Tiny Tim User’s Guide
- (54) Krist J. 1995, in ASP Conf. Ser. 77, Astronomical Data Analysis Software and Systems IV, Vol. 4, ed. Shaw H.E., Payne H.E. & Hayes J.J.E., 349
- (55) Kroupa P. 2001, MNRAS, 322, 231
- (56) La Barbera F., Busarello G., Massarotti M., Merluzzi P., Capaccioli M. 2003, ApJ 595, 127
- (57) Longhetti M., Saracco P., Severgnini P., et al., 2005, MNRAS, 361, 897
- (58) Longhetti M., Saracco P., Severgnini P., et al., 2007, MNRAS, 374, 614
- (59) Longhetti M., Saracco P. 2008, MNRAS, submitted
- (60) Maraston C., Daddi E., Renzini A., Cimatti A., Dickinson M., Papovich C., Pasquali A., Pirzkal N., 2006, ApJ, 652, 85
- (61) Marchesini D., van Dokkum P., Quadri R., et al. 2007, ApJ, 656, 42
- (62) McCarthy P.J., et al., 2001, ApJ 560, L131
- (63) McCarthy P.J., Le Borgne D., Crampton D., et al. 2004, ApJ 614, L9
- (64) McGrath E., Stockton A. 2007, ApJ, 669, 241
- (65) McGrath E., Stockton A., Canalizo G., Iye M., Maihara T. 2008, ApJ, in press [arXiv:0707.1050v2]
- (66) McIntosh D. H., et al. 2005, ApJ, 632, 191
- (67) Mei S., et al. 2006, ApJ, 644, 759
- (68) Moriondo G., Cimatti A., Daddi E. 2000, A&A, 364, 26
- (69) Naab T., Johansson P. H., Ostriker J. P., Efstathiou G. 2007, ApJ, 658, 710
- (70) Nipoti C., Londrillo P., Ciotti L. 2002, MNRAS, 332, 901
- (71) Peng C.Y., Ho L.C., Impey C.D. & Rix H-W 2002, AJ 124, 266
- (72) Pozzetti L., Bolzonella M., Lamareille F., et al. 2007, A&A, 474, 443
- (73) Pozzetti L., Cimatti A., Zamorani G., et al. 2003, A&A, 402, 837
- (74) Renzini A. 2006, ARA&A, 44, 141
- (75) Rettura A., Rosati P., Nonino M., et al. 2008, ApJ, in press [arXiv:0806.4604]
- (76) Rix et al. 2004, ApJS, 152, 163
- (77) Saracco P., Longhetti M., Severgnini P., et al. 2003, A&A 398, 127
- (78) Saracco P., Longhetti M., Severgnini P., et al. 2005, MNRAS, 357, L40
- (79) Saracco P., Fiano A., Chincarini G., et al. 2006, MNRAS, 367, 349
- (80) Sérsic J.L. 1968, Atlas de Galaxias Australes (Córdoba: Obs. Astron., Univ. Nac. Córdoba)
- (81) Shen S., et al., 2003, MNRAS, 343, 978
- (82) Spinrad H., Dey A., Dunlop J., Peacock J., Jimenez R., Windhorst R., 1997, ApJ, 484, 601
- (83) Springel V., Hernquist L. 2005, 622, L9
- (84) Stanford S. A., Elston R., Eisenhardt R., et al., 1997, AJ, 114, 2232
- (85) Stanford S. A., Dickinson M., Postman M., et al. 2004, ApJ, 127, 131
- (86) Tacconi L. J., Neri R., Chapman S. C., et al. 2006, ApJ, 640, 228
- (87) Tacconi L. J., Genzel R., Smail I., 2008, ApJ, 680, 246
- (88) Treu T., et al. 2005, ApJ, 633, 174
- (89) Trujillo I., et al. 2004, ApJ 604, 521
- (90) Trujillo I., Feulner G., Goranova Y., et al. 2006a, MNRAS, 373, L36
- (91) Trujillo I., Forster Schreiber N. M., Rudnick G., et al. 2006b, ApJ, 650, 18
- (92) Trujillo I., Conselice C. J., Bundy K., Cooper M. C., Eisenhardt P., Ellis R. S. 2007, MNRAS, 382, 109
- (93) van der Wel A., Holden B. P., Zirm A. W., Franx M., Rettura A., Illingworth G. D., Ford H. C. 2008, ApJ, in press [ar.Xiv:0808.0077]
- (94) van Dokkum P. G., Stanford S. A., 2003, ApJ 585, 78
- (95) van Dokkum P. G. 2005, AJ, 130, 2647
- (96) van Dokkum P. G., et al. 2008, ApJ, in press [arXiv:0802.4094]
- (97) Waddington I., et al. 2002, MNRAS, 336, 1342
- (98) Wolf C., Meisenheimer K., Rix H.-W., Borch A., Dye S., Kleinheinrich M. 2003, A&A, 401, 73
- (99) Wolf C. 2004, A&A, 421, 913
- (100) Zucca E., et al. 2006, A&A, 455, 879