11email: polletta@iasf-milano.inaf.it 22institutetext: Université Paris 6 – Institut d’Astrophysique de Paris – CNRS, 98bis blvd. Arago, Paris, 75014 France 33institutetext: Max-Planck-Institut für extraterrestrische Physik, Postfach 1312, 85741 Garching, Germany 44institutetext: Indian Institute of Astrophysics, Koramangala, Bangalore 560 034, India 55institutetext: INAF - Osservatorio Astronomico di Brera, via Brera 28, 20121 Milano, Italy 66institutetext: IUCAA, Post Bag 4, Ganeshkhind, Pune 411 007, India 77institutetext: Max-Planck-Institut für Astronomie, K nigstuhl 17, D-69117 Heidelberg, Germany
Obscured and powerful AGN and starburst activities at 3.5††thanks: This paper makes use of observations collected at the European Southern Observatory, Chile, ESO program No. 079.A-0522(A), and at the IRAM 30m-Telescope. IRAM is funded by the Centre National de la Recherche Scientifique (France), the Max-Planck Gesellschaft (Germany), and the Instituto Geografico Nacional (Spain). Based on observations obtained with MegaPrime/MegaCam, a joint project of CFHT and CEA/DAPNIA, at the Canada-France-Hawaii Telescope (CFHT) which is operated by the National Research Council (NRC) of Canada, the Institut National des Science de l’Univers of the Centre National de la Recherche Scientifique (CNRS) of France, and the University of Hawaii. This work is based in part on data products produced at TERAPIX and the Canadian Astronomy Data Centre as part of the Canada-France-Hawaii Telescope Legacy Survey, a collaborative project of NRC and CNRS.
Abstract
Aims. Short phases of coeval powerful starburst and AGN activity during the lifetimes of the most massive galaxies are predicted by various models of galaxy formation and evolution. In spite of their recurrence and high luminosity, such events are rarely observed. Finding such systems, understanding their nature, and constraining their number density can provide key constraints to galaxy evolutionary models and insights into the interplay between starburst and AGN activities.
Methods. We report the discovery of two sources at =3.867 and =3.427 that exhibit both powerful starburst and AGN activities. They benefit from multi-wavelength data from radio to X rays from the CFHTLS-D1/SWIRE/XMDS surveys. Follow-up optical and near-infrared spectroscopy, and millimeter IRAM/MAMBO observations are also available. We performed a multi-wavelength analysis of their spectral energy distributions with the aim of understanding the origin of their emission and constraining their luminosities. A comparison with other composite systems at similar redshifts from the literature is also presented.
Results. The AGN and starburst bolometric luminosities are 1013 L⊙. The AGN emission dominates at X ray, optical, mid-infrared wavelengths, and probably also in the radio. The starburst emission dominates in the far-infrared. The estimated star formation rates range from 500 to 3000 M⊙/yr. The AGN near-infrared and X ray emissions are heavily obscured in both sources with an estimated dust extinction 4, and Compton-thick gas column densities. The two sources are the most obscured and most luminous AGNs detected at millimeter wavelengths currently known.
Conclusions. The sources presented in this work are heavily obscured QSOs, but their properties are not fully explained by the standard AGN unification model. In one source, the ultraviolet and optical spectra suggest the presence of outflowing gas and shocks, and both sources show emission from hot dust, most likely in the vicinity of the nucleus. Evidence of moderate, AGN-driven radio activity is also found in both sources. Based on the estimated stellar and black hole masses, the two sources lie on the local relation. To remain on this relation as they evolve, their star formation rate has to decrease or stop. Our results support evolutionary models that invoke radio feedback such as the star formation quenching mechanism, and suggest that such a mechanism might play a major role also in powerful AGNs.
Key Words.:
Galaxies: active – Galaxies: evolution – Galaxies: high-redshift – quasars – Infrared: galaxies1 Introduction
The similarity between the star formation history and the space density of active galactic nuclei (AGNs) over cosmic time (e.g Hartwick 2004; Hasinger et al. 2005) and the correlation in nearby galaxies between black hole (BH) mass and bulge mass (Ferrarese 2002; Gebhardt et al. 2000) indicate that star formation in a galaxy is related to the growth of its BH (but see Shields et al. 2008). Theoretical models (Granato et al. 2001, 2004; Di Matteo et al. 2005; Hopkins et al. 2005a; Springel et al. 2005) explain the link between star formation and AGN activity. They show that gas-rich galaxy mergers are viable precursors to the formation of both massive galaxies and super massive BHs (SMBHs). According to these models, QSOs and (sub)-millimeter galaxies (hereinafter SMGs), the most intense sites of star formation at high-, represent different stages in an evolutionary sequence, and the obscured growth phase of the BH coincides with the transition from the SMG to the QSO stages (Page et al. 2004; Stevens et al. 2005). QSOs are thus expected to be the end-product of the rapid growth of SMBHs seen soon after a phase of high star formation, as seen in SMGs (Sanders et al. 1988; Granato et al. 2001). Although these models claim to be successful in reproducing and explaining several observations (Hopkins et al. 2005b, 2006; Li et al. 2007; Chakrabarti et al. 2007), more observations are necessary to test their predictions, constrain their parameters, and provide a physical base to some of their assumptions (see e.g. Marulli et al. 2008).
Previous studies of SMG populations and high- starbursts have revealed the presence of obscured AGN activity in 30–40% of these systems (e.g. Page et al. 2004; Chapman et al. 2005; Stevens et al. 2005; Alexander et al. 2005c; Yan et al. 2007; Pope et al. 2008), giving support to a link between the two activities. However, it is not clear how star formation and BH growth are linked, what their relative timescales are, and whether they influence each other directly through a feedback mechanism or indirectly, e.g. by consuming the available cold gas. The number of well studied composite systems is still low, and it is often difficult to separate and quantify the contribution from different energy sources (see e.g. the variety of models proposed to explain the properties of F 10214+4724; Rowan-Robinson et al. 1993; Teplitz et al. 2006; Efstathiou 2006). In order to quantify their contribution to the bolometric luminosity, the multi-wavelength spectral energy distributions (SEDs) of such systems need to be measured and modeled. Because of the difficulty of obtaining a full multi-wavelength coverage, AGN, starburst galaxies, and composite systems with well sampled SEDs and known spectra are often used to derive correlation between bolometric luminosities and measurements at specific wavelengths or of spectral features (e.g. Sajina et al. 2008; Polletta et al. 2008). In case of powerful starburst galaxies, like SMGs, the AGN is often highly obscured and requires either ultra deep X-ray observations (Alexander et al. 2005a), spectropolarimetric observations (Goodrich et al. 1996), or mid-infrared (MIR) spectroscopic observations (Pope et al. 2008) to be revealed.
In order to investigate the link between star formation and AGN activity, it is thus important to study systems where both activities are taking place, and collect multi-wavelength measurements to constrain the starburst, i.e. the star formation rate (SFR), and AGN, i.e. accretion rate, luminosities, as well as their Eddington ratio, and stellar and gas masses.
Here, we investigate the properties of two rare millimeter (mm) bright obscured QSOs at high- discovered in a wide multi-wavelength survey. Spectroscopic data as well as the full SED, from X ray to radio wavelengths are available for both objects and are analyzed to constrain the origin of their luminosity and investigate their nature. Throughout this paper, we adopt a flat cosmology with H0 = 71 , =0.27 and =0.73 (Spergel et al. 2003).
2 Target selection and observations
In this work, we analyze the properties of two sources that were selected as drop-out sources, thus 4 candidate, in the 0.9 deg2 CFHTLS survey D1111http://www.cfht.hawaii.edu/Science/CFHTLS/ (RA = 02h26m, Dec = 04∘30′) and as very bright MIR sources in the XMM-LSS field of the Spitzer Wide-area InfraRed Extragalactic Legacy survey (SWIRE222http://swire.ipac.caltech.edu/swire/swire.html; Lonsdale et al. 2003). The sources IAU official names are SWIRE2 J022550.67$-$042142.2 (SW022550 hereinafter), and SWIRE2 J022513.90$-$043419.9 (SW022513 hereinafter). We applied a modified version of the drop-out selection technique developed by Steidel et al. (1999) for 3–4 Lyman-break sources. In addition to the optical colors and the source extension, this selection technique takes into account the 3.6 m–4.5 m color (Bergeron et al., in prep.; see also Siana et al. 2008). No other sources with these properties were found in the 0.9 deg2 CFHTLS-D1/SWIRE field. Because of their large 24m fluxes (F1 mJy), exceptionally red infrared (IR) SEDs (2.5 where F over the observed wavelength range 3–24 m), and high-, we selected both sources for observations at 1.2 mm with the Max Planck Millimeter Bolometer (MAMBO) array (Kreysa et al. 1998) at the Institut de Radioastronomie Millimétrique (IRAM) 30m telescope. Follow up spectroscopic observations were carried out and broad-band photometric data from X ray to radio wavelengths were already available in the field.
2.1 Optical and infrared imaging
Broad-band photometric data at optical and IR wavelengths are available for both sources from various surveys. Optical data in 5 broad-bands, , were provided by the CFHTLS survey D1 (data release T0004333http://terapix.iap.fr/rubrique.php?id\_rubrique=241). Near-IR (NIR) data in the J and K bands were obtained from the UKIRT Infrared Deep Sky Survey (UKIDSS444http://www.ukidss.org/ data release 3; Dye et al. 2006; Lawrence et al. 2007). Infrared data in all seven Spitzer bands, from IRAC (3.6, 4.5, 5.8, and 8.0 m; Fazio et al. 2004) and MIPS (24, 70, and 160 m; Rieke et al. 2004), are available from the SWIRE survey. The SWIRE data correspond to the latest internal catalogs that will be released as part of the Data Release 5 (DR5; for details on the data reduction see Surace et al. 2005). The total measured magnitudes and fluxes in each band are reported in Table 1.
2.2 MAMBO observations
Observations at the IRAM 30m telescope were carried out during March–April and November 2006, using the 117 element version of the MAMBO array operating at a wavelength of 1.2 mm (250 GHz). We used the standard on-off photometry observing mode, chopping between the target and sky at 2 Hz, and nodding the telescope every 10 or 20 s. On-off observations were typically obtained in blocks of 6 scans of 16 or 20 10s-subscans each, and repeated in later observing nights. The atmospheric transmission was intermediate with (1.2 mm)=0.1–0.4. The absolute flux calibration was established by observations of Mars and Uranus, resulting in a flux calibration uncertainty of about 20%.
On average, the noise of the channel used for point-source observations was about 35–40 mJy//beam, where is the exposure time in seconds, consistent with the MAMBO time estimator for winter conditions. The two sources were observed as part of a larger program targeting more than 100 starburst, AGN, and composite sources selected in the SWIRE fields (Lonsdale et al. 2008, Polletta et al., in prep., Fiolet et al., in prep.). The resulting 1.2 mm fluxes are 4.70.8 mJy and 5.50.7 mJy for SW022550, and SW022513, respectively.
2.3 Optical spectroscopy of SW022550
An optical spectroscopic observation of SW022550 was carried out with the AAOmega system (Sharp et al. 2006) on the 3.9-m Anglo-Australian Telescope, on September 27, 2006, as part of a multi-object spectroscopic program of QSOs in the CFHTLS (Petitjean et al., in prep., Yu et al. in prep.). The 580V and 385R grating were used in the blue and red arms of the spectrograph, respectively, yielding R 1300. The total integration time was 3 h, divided into six 30 min exposures.
Data reduction was performed using the AAOmega data reduction pipeline software DRCONTROL. The two dimensional images were flatfielded, and the spectrum was extracted (using a gaussian profile extraction), wavelength calibrated and combined within DRCONTROL. The final spectrum was flux calibrated using the broad-band photometric measurements in the and bands after deconvolving the spectrum with the filter bandpasses. This calibration assumes that the source optical emission has not significantly varied between the spectroscopic and photometric observations.
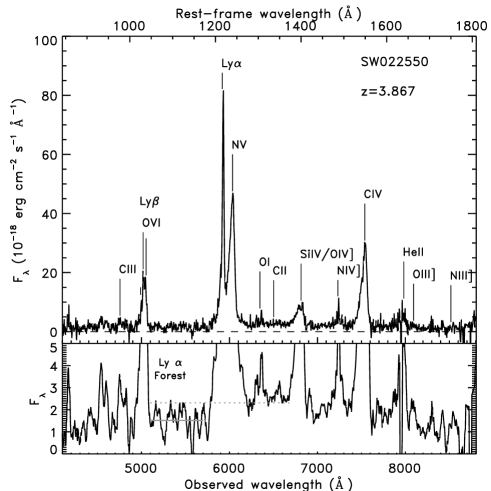
The optical spectrum of SW022550 shows several strong emission lines, e.g. Ly, N V 1240, C IV 1549, the O VI 1035 doublet (see Figure 1). The continuum emission is weak (2), and a drop in the continuum emission is visible at rest-frame wavelengths below 1216Å due to intergalactic medium (IGM) absorption. The bottom panel of Figure 1 shows the decrease in the continuum emission at rest-frame wavelengths 1216 Å. Absorption features due to the Lyman forest are also visible. Since the line spread function (LSF) derived from the lamp spectra is consistent with a Gaussian, we used such a profile to fit the emission lines. From the fits we measured the total line flux, the central wavelength, the FWHM in Å, and the flux of the local linear continuum. The FWHM in and the rest-frame equivalent width () in Å are then derived from these parameters after correcting for instrumental resolution. The instrumental FWHM is 3 Å at 5500 Å, and 5 Å at 5500 Å. The line flux, central wavelength, corresponding redshift, rest-frame FWHM and rest-frame of the main visible lines are reported in Table 2. Uncertainties are determined using a Montecarlo method and assuming a Gaussian noise given by the r.m.s. associated with the continuum where the fit is performed. A broad component, in addition to a narrow one, is measured in correspondence of the Ly, N V 1240, Si IV 1397, and C IV 1549 lines. All these lines show an asymmetric component, similar to a blue wing. To fit such an asymmetric profile, in some cases, e.g. Ly, and N V 1240, we fit multiple Gaussian components. Based on the central wavelength of the optical lines listed in Table 2, we estimate a redshifts of 3.8670.009.
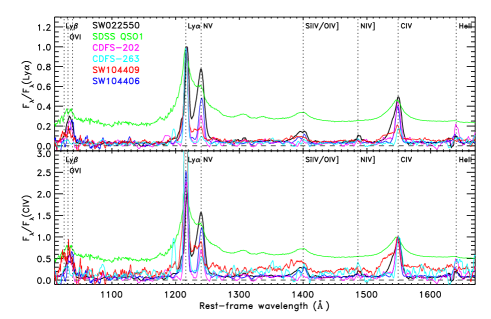
The emission lines are dominated by their narrow (FWHM1000 ) components with FWHMs typical of type 2 QSOs (1500 ; see e.g. Baldwin et al. 1988; Norman et al. 2002; Mainieri et al. 2005). Broad components are also present with FWHM2000–9000 as observed in type 1 QSOs (2000 ; see e.g. Richards et al. 2004). The equivalent widths of the emission lines in the optical spectrum of SW022550 are larger than observed in type 1 QSOs, and more similar to those observed in other type 2 QSOs (see e.g. SMM 023990136, CDFS-263, or CXO 52; Ivison et al. 1998; Mainieri et al. 2005; Stern et al. 2002). In Figure 2, we compare the optical spectrum of SW022550 with a composite spectrum of a large sample of type 1 QSOs and with the spectra of four type 2 QSOs at high- from the literature. We show the spectra normalized at the Ly peak on the top panel, and at the C IV 1549 peak in the bottom panel. The composite type 1 QSO spectrum corresponds to the median composite spectrum of 2204 QSO spectra from SDSS (Vanden Berk et al. 2001). The type 2 QSOs have been selected because of the availability of their optical spectra from the literature and high-. They are CDFS-202, and CDFS-263 from CDFS (Szokoly et al. 2004), and SW104406 and SW104409 from the SWIRE/Chandra survey (Polletta et al. 2006). This comparison shows the wide range of line ratios that can be observed in type 2 QSOs. The main differences reside in the strength of the N V 1240, and C IV 1549 emission lines, and the blue wings observed in the main emission lines. We will discuss below two possible explanations for the strength of the N V 1240, and C IV 1549 lines, i.e. high metalicities and shocks. Interestingly, there is another object in the type 2 QSO sample from the literature with similar asymmetric lines, i.e. SW104409. This source is also characterized by a similar optical-IR SED to SW022550, with an unusual optical blue continuum with strong AGN emission lines, and red optical-MIR colors. A possible explanation for the presence of blue wings is extinction due to dust mixed with infalling or outflowing ionized gas (Osterbrock 1989). Since the SED in both cases indicate that the AGN is obscured, it is also plausible that the blue continuum and the broad blue wings are due to scattered light (see e.g. Zakamska et al. 2006).
SW022550 is characterized by large N V 1240/C IV 1549 and N V 1240/He II 1640 flux ratios. These flux ratios are often used to estimate the gas metalicity in QSOs, from either the broad or the narrow line region (BLR and NLR; see Nagao et al. 2006, and references therein). High values usually imply high metalicities (see e.g. Hamann & Ferland 1993; Vernet et al. 2001; Norman et al. 2002). Based on the photoionization model in Hamann & Ferland (1993), we derive a metalicity =4. However, not all the emission line ratios of the spectrum of SW022550 are explained by NLR photoionization models (see e.g. Nagao et al. 2006; Groves et al. 2004). A possible cause of this discrepancy is the presence of broad components. It is also possible that the emission lines are produced by shocks in addition or rather than by photoionization. This hypothesis is supported by the strength of some lines, like C IV 1549, O VI 1035, and N V 1240. For example, C IV 1549 is predominantly produced in the cooling zone of shocks and it is expected to be stronger in shocks than in photoionization processes. Indeed, the C IV 1549/He II 1640, N V 1240/He II 1640, and N V 1240/C IV 1549 flux ratios like those observed in SW022550, are higher than predicted by photoionization, and can be explained by shocks (Allen et al. 2008), or by the coexistence of shocks and AGN photoionization, without requiring largely super-solar metalicities (Moy & Rocca-Volmerange 2002). Also the presence of O VI 1035 can be considered as evidence of shocks, although other explanations are also possible. To confirm whether SW022550 is characterized by high metalicity and better constrain its value, or whether shocks are in part responsible for the observed emission lines, it would be necessary to measure other emission lines, especially at rest-frame optical wavelengths.
In summary, the optical spectrum of SW022550 shows spectral features that are also observed in other obscured (type 2) AGNs at high-, but are not explained by the standard AGN unification model (Antonucci 1993). In particular, a high metalicity or the presence of shocks and a significant scattered fraction at rest-frame UV wavelengths are necessary to fully explain the observed spectrum. Note that these hypothesis can not been fully tested with the available data and other scenarios are not ruled out.
| mag or Flux555X ray fluxes are in 10-15 . Optical magnitudes are total magnitudes in the AB systems in the filters from the CFHTLS survey D1. UKIDSS J and K fluxes, and IRAC (3.6–8.9 m) fluxes are in Jy. MIPS (24–160 m), MAMBO (1.2 mm) and radio (20 cm) fluxes are in mJy. X-ray upper limits correspond to 3, optical upper limits correspond to 80% completeness, IR upper limits correspond to 5. The radio data are from the VIMOS VLA survey (Bondi et al. 2003, 2007). | Project/Telescope | SW022550 | SW022513 |
|---|---|---|---|
| F | XMDS/XMM | 2.5 | 1.10.8 |
| F | XMDS/XMM | 20 | 7.84.1 |
| mu | CFHTLS/CFHT | 25.2110.077 | 26.00 |
| m | CFHTLS/CFHT | 22.9440.007 | 24.4320.033 |
| m | CFHTLS/CFHT | 21.6480.003 | 23.2870.014 |
| m | CFHTLS/CFHT | 22.9490.004 | 22.8510.012 |
| mz | CFHTLS/CFHT | 22.4080.021 | 22.5030.027 |
| FJ | UKIDSS/UKIRT | 3.60.4 | 3.10.6 |
| FK | UKIDSS/UKIRT | 7.70.6 | 12.70.6 |
| F3.6μm | SWIRE/Spitzer | 151 | 161 |
| F4.5μm | SWIRE/Spitzer | 231 | 201 |
| F5.8μm | SWIRE/Spitzer | 58 | 284 |
| F8.0μm | SWIRE/Spitzer | 2397 | 1805 |
| F24μm | SWIRE/Spitzer | 3.320.02 | 2.350.02 |
| F70μm | SWIRE/Spitzer | 24 | 24 |
| F160μm | SWIRE/Spitzer | 126 | 126 |
| F1.2mm | IRAM/MAMBO | 4.700.77 | 5.530.72 |
| F20cm | VIMOS/VLA | 0.140.02 | 0.350.02 |
| F50cm | VIMOS/GMRT | 0.410.04 | 0.620.04 |
2.4 Near-infrared spectroscopy
Both targets were observed with the ISAAC instrument (Moorwood et al. 1998) on Antu (VLT-UT1) in low-resolution (LR) mode, using the 10241024 Hawaii Rockwell array of the Short Wavelength arm. Observations were carried out with a 1″ slit with two grating blaze angles, approximately covering the SH (1.42–1.82 m), and SK (1.82–2.5 m) bands. The nominal resolutions were 500, and 450 for the two cases, respectively. The observations of the two targets were carried out in visitor mode on September 13th–14th, 2007. Total integration times were 81 min and 66 min in the SH band, and 84 min and 42 min in the SK band on SW022550, and SW022513, respectively.
Each observation was splitted in sets of 180s exposures, adopting a nodding and jittering pattern for optimal background subtraction. The nod throw was set to 60–80 ″, in order to avoid conflict with the reference star; the jitter width was 10 ″.
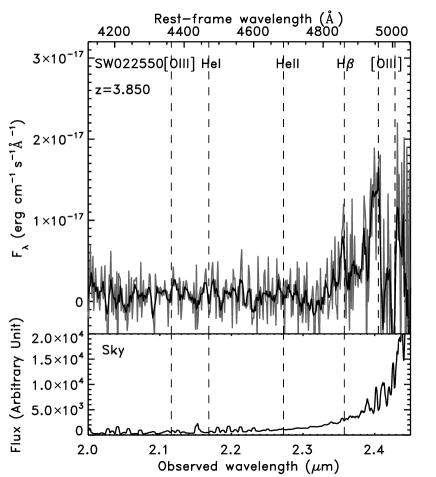
Data reduction was carried out in the standard manner, using the IRAF environment666The package IRAF is distributed by the National Optical Astronomy Observatory which is operated by the Association of Universities for Research in Astronomy, Inc., under cooperative agreement with the National Science Foundation., including ABBA sky subtraction. Wavelength calibration was based on OH sky lines. Atmospheric extinction correction and flux calibration were obtained with standard telluric stars, carefully selected from the ESO database in order to have known NIR magnitudes. For this purpose, several B-type telluric standards were observed each night (before and after a target was observed) at air masses within 0.1–0.2 of the air mass of the target observations. The rebinned ISAAC SK-band spectra of the two sources are shown in Figure 3, and discussed below.
2.4.1 ISAAC SK Spectrum of SW022550
Neither continuum nor lines are detected in the SH-band spectrum of SW022550. Two emission lines are detected in the SK-band spectrum at 23560Å, and 24060Å yielding a 3.85 if interpreted as H, and [O III] 4959, respectively. The continuum in the SK-band is not detected and it is estimated to be 3.810-18 (corresponding to 3). The identification of these lines is tentative due to the high sky level at these wavelengths and the uncertain wavelength calibration at 2.4m. The [O III] 4959 line shows a blue tail probably due to a poor sky subtraction. At the expected location of the [O III] 5007 line, the spectrum is negative, suggesting that the sky subtraction might have been too high at these wavelengths. The H/Ly flux ratio is 0.030.1, which is consistent with the range of values observed in type 2 AGNs, i.e. from 0.014 to 0.03, while type 1 AGNs are usually characterized by higher values (0.07–0.125). Note that because of the poor sky subtraction where the lines are observed (see bottom panel of Figure 3), it is possible that a broad H component is also present. Assuming a FWHM of 5000 for a broad H we estimate an upper limit to the flux 1610-16. This value is significantly higher that the predicted flux based on the measured Ly flux and the H/Ly flux ratio observed in type 1 AGNs. Thus, we cannot rule out the presence of a broad H line in the spectrum of SW022550. The [O III] 4959/H flux ratio is 6.32.1. This is also closer to the ratios observed in type 2 AGNs, 2.3, than to those observed in type 1 AGNs, 0.04. The upper limit to the H flux yields a [O III] 4959/H flux ratio 0.56, still higher than in type 1 QSOs. In summary, in spite of its low signal-to-noise, we conclude that the (rest-frame) optical spectrum of SW022550 is more similar to the spectra of type 2 AGNs, than to those of type 1 AGNs. The ISAAC spectrum shows another interesting property. The H, and [O III] 4959 lines are slightly blueshifted with respect to the optical emission lines. Assuming that such a difference is real and that the source is at =3.867 as derived from the optical spectrum, the blueshifted lines could be explained by outflowing gas with a velocity 510 (see similar cases in Sajina et al. 2008). Such a velocity is consistent with those assumed in shocks models (Allen et al. 2008).
2.4.2 ISAAC SK Spectrum of SW022513
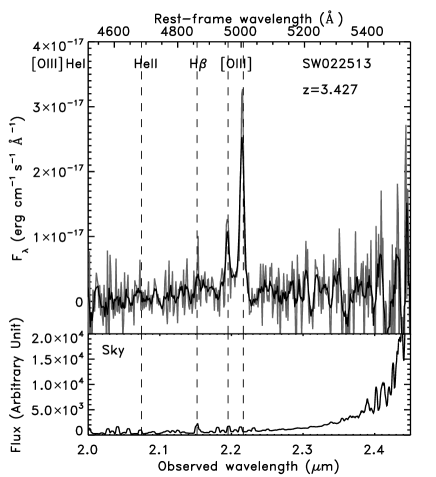
Neither continuum nor lines are detected in the SH-band spectrum of SW022513. In the SK-band spectrum, two emission lines at =21954 Å, and 22160 Å are well detected, while the continuum is not detected. We thus estimate an upper limit to the continuum 2.0310-18 (corresponding to 3), and to the emission lines equivalent widths. The two lines are interpreted as [O III] 4959,5007, constraining the redshift to be =3.4270.001. A weak emission feature is observed at the expected wavelength corresponding to the H line. Since the line is affected by a bright sky line which falls exactly at its expected location, and it is narrower than the spectral resolution, we cannot constrain it. The [O III] 4959/H and [O III] 5007/H flux ratios are, respectively, 0.97 and 2.48. These values are much higher than those observed in type 1 AGNs (i.e. 0.04 and 0.15) and more similar to those observed in type 2 AGNs (2.3 and 5.5) and expected from photoionization models of the narrow line region (NLR; Osterbrock 1989; Groves et al. 2004).Thus, it is quite likely that such a feature is the H line. In summary, the ISAAC spectrum of SW022513 shows narrow emission lines with flux ratios consistent with those of type 2 AGNs.
The lines fluxes, , and FWHMs of both spectra are reported in Table 2.The SH-band observations cover the rest-frame wavelength range 2900–3700 Å for SW022550, and 3200–4100 Å for SW022513. At these wavelengths, the only feature that might be detected is the [O II] 3727 emission line. The [O II] 3727 line is typically associated with star formation activity (Gallagher et al. 1989), but also with AGN activity. Since our sources are not detected in the SH-band, and an atmospheric feature is present at the expected [O II] 3727 location in the two sources, we cannot set any constraints on their [O II] 3727 emission.
From the spectra we estimate that the upper limits to the NIR continuum in SW022513 and SW022550 are 33 Jy, and 61 Jy. These values are about 3 and 8 times higher than the K-band measured fluxes. Thus, the spectroscopic measurements are consistent with the broad band photometric data.
| Line | Flux | FWHMa | Comments | |||||||
| (Å) | (Å) | ( ) | () | |||||||
| SW022550 | ||||||||||
| Ly | 4997.4 | 0.8 | 3.876 | 41 | 3 | 1.35 | 0.11 | 935 | 180 | Narrow |
| [O VI] 1031,1038 | 5018.2 | 0.6 | 3.867 | 68 | 3 | 2.25 | 0.10 | 777 | 81 | … |
| 5042.9 | 0.8 | 3.858 | 152 | 4 | 5.03 | 0.14 | 1820 | 114 | … | |
| Ly | 5928 | 0.1 | 3.875 | 322 | 5 | 13.52 | 0.19 | 1041 | 13 | Narrow |
| N V 1240 | 6022 | 0.7 | 3.856 | 311 | 9 | 13.19 | 0.39 | 2531 | 99 | Broad |
| 6044 | 0.7 | 3.874 | 146 | 5 | 6.19 | 0.20 | 1354 | 74 | Narrow | |
| Ly | 5920 | 1.8 | 3.868 | 164 | 15 | 6.88 | 0.65 | 4060 | 157 | Broad |
| 5985 | 2.2 | … | 496 | 23 | 20.98 | 0.96 | 8968 | 343 | Broad | |
| Si IV 1397 | 6778 | 4.3 | 3.852 | 833 | 37 | 7.38 | 0.33 | 4581 | 318 | … |
| 6820 | 2.4 | 3.861 | 281 | 22 | 2.49 | 0.20 | 2375 | 172 | … | |
| N IV] 1486 | 7242 | 2.4 | 3.873 | 41 | 4 | 1.95 | 0.18 | 1987 | 239 | … |
| C IV 1549 | 7527 | 1.5 | 3.859 | 328 | 8 | 16.13 | 0.38 | 3690 | 101 | Broad |
| 7542 | 0.8 | 3.869 | 91 | 4 | 4.47 | 0.18 | 1235 | 88 | Narrow | |
| He II 1640 | 7970 | 15 | 3.860 | 84 | 8 | 2.75 | 0.26 | 3098 | 768 | … |
| H | 23560 | 3.847 | 37b | 1.4 | 0.5 | 510c | ISAAC | |||
| [O III] 4959 | 24060 | 3.852 | 239b | 9.1 | 0.4 | 498c | ISAAC | |||
| SW022513 | ||||||||||
| H | 21532 | 5 | 3.429 | 120b | 2.5 | 557c | ISAAC | |||
| [O III] 4959 | 21954 | 2 | 3.427 | 297b | 6.1 | 0.5 | 288 | 58 | ISAAC | |
| [O III] 5007 | 22160 | 1 | 3.426 | 829b | 16.9 | 0.6 | 660 | 34 | ISAAC | |
All measurements are based on single Gaussian fits to the emission lines assuming a flat (in ) continuum. aCorrected for instrumental resolution. bSince the continuum is not detected we estimate an upper limit to the equivalent width, , assuming a 3 upper limit to the continuum. The continuum is 3.7810-18 for SW022550, and 2.0310-18 for SW022513. cThe FWHM is fixed to the spectral resolution because it cannot be correctly determined due to the low signal-to-noise.
2.5 Radio data
Both targets are detected in the VIMOS VLA survey at 1.4 GHz, and at 610 MHz (Bondi et al. 2003; Ciliegi et al. 2005; Bondi et al. 2007). The measured fluxes are reported in Table 1. In the VLA 1.4 GHz observations, SW022513 appears extended with a major axis of 4.1″ and a minor axis of 1.8″, corresponding to a projected linear size of 4.2 kpc2.1 kpc, and a position angle (PA) of 161.3∘ (Bondi et al. 2003). In the other radio observations the sources are unresolved. Assuming a power-law model for the radio emission, the radio spectral indeces are 1.3 for SW022550, and 0.7 for SW022513. Because of its radio spectral index, SW022550 can be considered an ultra-steep spectrum source (USS, i.e. ; Roettgering et al. 1994, and references therein). Such a steep spectrum implies an AGN origin of the observed emission. In case of SW022513, the spectral index is consistent with what is observed in star forming galaxies and radio-quiet AGNs (Ciliegi et al. 2003), however the extended emission and the large radio flux strongly suggest also an AGN origin of its radio emission. A more detailed discussion of the radio properties of our sources is presented in § 3.3.
2.6 X ray data
The two targets are also covered by 20 ks observations with XMM-Newton from the XMM-Newton Medium Deep Survey (XMDS; Chiappetti et al. 2005; Tajer et al. 2007). Only EPIC/MOS data are available as both sources fall in a bad column of the EPIC/pn detector. SW022513 is at 4.5′ from the aimpoint and marginally detected with 2912 total counts (128 at 0.5–2 keV, and 179 at 2–10 keV). The hardness ratio is HR=0.18, which corresponds to an effective gas column density (11024 assuming a power-law model with photon index =1.7, and Galactic and intrinsic photo-electric absorption with Gal= 2.611020 (Dickey & Lockman 1990). More details on the X ray data and derived quantities can be found in Chiappetti et al. (2005), and Tajer et al. (2007). SW022550 is at 11′ from the aim-point and is not detected, thus we can only give an upper limit to its X-ray flux. The X-ray fluxes of both sources are reported in Table 1.
Based on these X ray measurements, the estimated broad and hard X ray luminosities of SW022513 are 61044 , and 51044 , respectively. The absorption-corrected broad and hard X ray luminosities are 111044 , and 61044 . For SW022550, we estimate an upper limit to the absorbed luminosities in the broad and hard bands of 2.01045 , and 1.81045 , respectively. Based on the estimated X ray luminosity of SW0221513 and the relationship between the [O III] 5007 and the hard X ray luminosity in type 2 AGNs (Mulchaey et al. 1994; Netzer et al. 2006), we expect an [O III] 5007 luminosity of 3–91042 , instead of 21044 as observed (see Table 3). Such a discrepancy might be due to the non validity of the X ray/[O III] 5007 relationship for our sources, to an underestimation by a factor of 100 of the X ray luminosity, or to the contamination from star formation to the [O III] 5007 flux. Probably, all these factors play a role in explaining this discrepancy, but the only one that could explain such a large difference is the underestimation of the intrinsic X ray luminosity. A higher X ray luminosity would also be required to obtain a MIR/X-ray luminosity ratio consistent with those observed in other AGNs (see § 3.1). Based on these considerations, it is quite probable that SW022513 is a Compton-thick QSO. Since SW022550 is even fainter in the X-rays, and more luminous in [O III] 5007 emission and in MIR luminosity, it is also quite plausible that SW022550 is a Compton-thick QSO.
The full radio-Xray SEDs of the two targets are shown in Figure 5, and all the available fluxes are listed in Table 1.

3 Multi-wavelength spectral energy distributions
The SEDs of SW022550, and SW022513 are shown in Figures 4 and 5. Both sources are characterized by large MIR fluxes (F24μm2–3 mJy), show red power-laws in the NIR (1–5m in the rest-frame; 2.5, where Fν ), and large IR/optical flux ratios (=1.5). All these properties are signatures typical of obscured QSOs (Weedman et al. 2006; Polletta et al. 2008).
3.1 Comparison with other high- QSOs
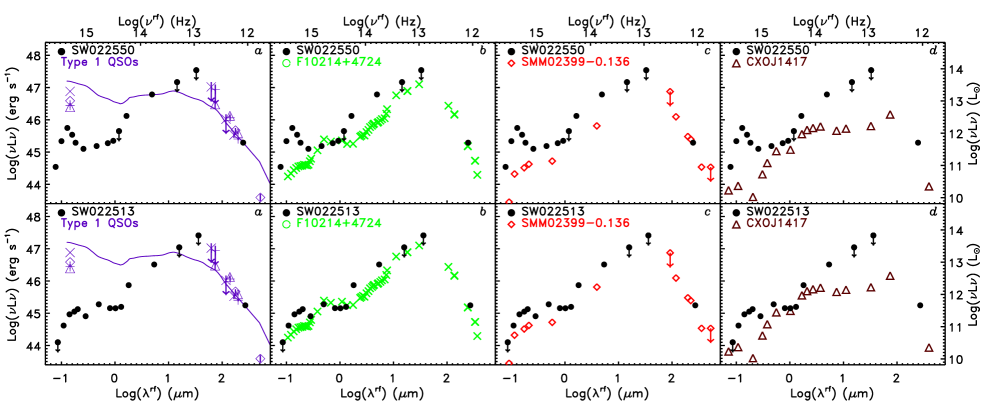
We compare the UV-mm SEDs of SW022550, and SW022513 with those of well studied mm-detected non radio-loud AGNs at high- from the literature in Figure 4. The vast majority of mm-detected QSO at high- are unobscured or type 1 QSOs with MIR SEDs consistent with the median template of unobscured QSO (e.g. Hines et al. 2006). We represent their SEDs in panel of Figure 4 with the median QSO template by Elvis et al. (1994). The majority of these type 1 QSOs with strong mm fluxes, i.e. 3 mJy, as our sources, show a significant excess in the far-IR (FIR) with respect to the optical emission predicted by the median QSO template (Wang et al. 2007; Hao et al. 2008). The SEDs of 4 QSOs with a FIR excess are also shown in panel of Figure 4. Our sources show similar mm luminosities, but 10–100 times lower optical fluxes, consistent with being obscured. In Figure 4, we also compare our sources SEDs with those of 3 mm-detected obscured QSOs with available MIR data, (1) the lensed system F 10214+4724, a Seyfert 1 galaxy at =2.86, but that is also heavily absorbed in the X rays (panel ; Ivison et al. 1998; Alexander et al. 2005b); (2) SMM 02399$-$0136, a type 2 QSO at =2.803 (panel ; Ivison et al. 1998); and (3) CXO GWS J141741.9+522823 (CXOJ1417 hereinafter) at =1.15 (panel ; Le Floc’h et al. 2007). With the only exception of CXOJ1417 that is the least luminous sources of the sample, all the remaining cases are characterized by mm luminosities consistent with those of our sources. All the obscured AGNs shown in panels – in Figure 4 show flat NIR SEDs with similar luminosities. Since the maximum of stellar light in and the minimum of AGN light are at NIR wavelengths (1–1.6m in the rest-frame; Sawicki 2002; Sanders et al. 1989), it is at these wavelengths that we can expect the maximum contribution to the optical-IR SED from the host galaxy. The similarity of the observed NIR SEDs might thus be explained by a significant contribution from stellar emission. All SEDs are characterized by red MIR colors, consistent with hot dust thermal emission, but such a component is more luminous and redder in our sources than in the sources from the literature. Our sources are also systematically more luminous at optical wavelengths, and this is mainly due to the strong emission lines. In summary, our targets have SEDs that are intermediate between those of type 1 QSOs (panel a), and those of obscured QSOs (panels b-d). In absence of high spatial resolution data and MIR spectroscopy, we cannot determine the origin of the observed differences. Assuming that the intrinsic AGN SED is the same in all sources, the redder MIR SED and the higher optical flux imply a higher AGN luminosity and more extinction in our sources than in the mm-detected obscured QSOs from the literature.
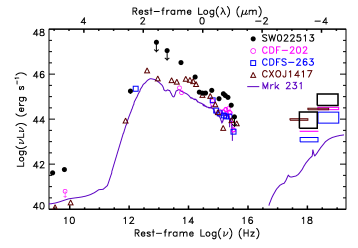
In Figure 5, we compare our sources radio-X ray SEDs with those of high- AGNs with similar multi-wavelength coverage. We include the mm-detected sources CDFS-263, and CXOJ1417 because they are also detected at X ray wavelengths. CXOJ1417 is also detected at radio wavelengths. We also include CDF-202, a X ray detected heavily absorbed type 2 QSO at =3.7 (Norman et al. 2002), and Mrk 231, a BAL QSO which is heavily absorbed in the X rays and is hosted by a powerful starburst galaxy. We do not consider F 10214+4724 because its X ray spectrum is likely dominated by starburst emission (Alexander et al. 2005b). The absorption-corrected hard X ray luminosities of CDFS-263, CXOJ1417, and CDF-202 are 7.61044, 2.41044, and 3.31044 , respectively. The X ray luminosity of SW022513 is 61044 . Unless, the X ray luminosity of SW022513 is largely underestimated (see § 2.6), the current estimate is consistent with those measured in the literature sources. In addition to being more luminous at all wavelengths, our sources show a redder MIR emission than the CDFS sources. Interestingly, such a red MIR emission is also observed in other heavily obscured QSOs at high- which are also characterized by higher MIR/X ray luminosity ratios (13–40) than classical AGNs (Polletta et al. 2008). For classical AGNs the MIR/X ray luminosity ratios () range from about 0.3 to 13 (Polletta et al. 2007, 2008), but for SW022513 and CXOJ1417 this ratio is about 60. Such a prominent MIR component might imply either that dust heating is more efficient, that the dust covering factor is particularly high, or that the intrinsic X-ray luminosity is underestimated.
3.2 SED modeling and star formation rate
Our targets have optical and MIR properties typical of obscured QSOs, but their large mm fluxes suggest that they are also experiencing intense star forming activity. Indeed, emission from AGN-heated circumnuclear dust is expected to peak around 10–30 m and not to contribute significantly in the FIR (see e.g. Granato et al. 2004; Hönig et al. 2006; Fritz et al. 2006). A powerful starburst provides a more likely explanation, but such a hypothesis cannot be confirmed because of the lack of detections at rest-frame wavelengths =6–250 m, contrarily to the cases for F 10214+4724 and CXOJ1417. Although current data do not constrain the origin of the mm emission, AGN model predictions and the similarity with F 10214+4724 and CXOJ1417 favor a starburst origin.
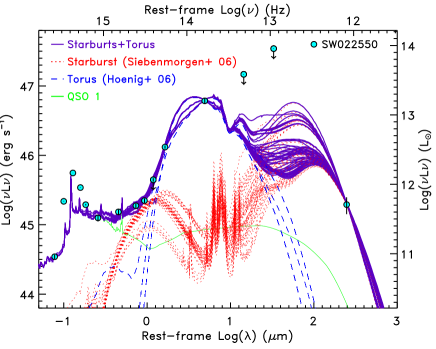
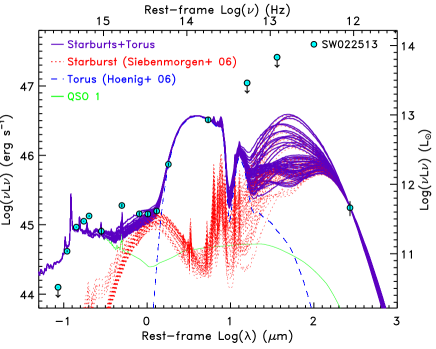
Assuming that the mm flux is due to a starburst component and that the MIR flux is mainly due to the AGN, we model the IR (2–1200 m) observed SED of our targets by combining a starburst and a torus model. To model the starburst component, we use a library of 7208 starburst models (Siebenmorgen & Krügel 2007). To model the AGN component, we use a set of 44 clumpy torus models with various inclinations from Hönig et al. (2006). These models were used to fit the MIR SEDs and spectra of a sample of MIR-luminous obscured QSOs with available MIR spectra (Polletta et al. 2008). The starburst component is normalized at the observed 1.2 mm flux, and the torus models at the observed 24 m flux. The sum of the starburst and torus models is then compared to the SED of our targets. Since none of the models is able to reproduce the optical data, and since the optical data indicate that there is a contribution from strong emission lines, typical of AGNs, an additional component is added to the starburst+torus models represented by an AGN template. For this component we use a type 1 QSO template (Hatziminaoglou et al. 2005; Polletta et al. 2007) because it reproduces well the observed optical broad-band data. The type 1 QSO template is normalized at the J-band (1.25 m) observed flux. Note that such a normalization corresponds to 1.4% of what would be obtained if we normalized the type 1 QSO template at the observed 24 m flux. Such a small fraction implies that the AGN optical light might be suppressed by more than 70%, which corresponds to a foreground extinction of =4.6. Since this component is not reddened, its origin is more likely due to a small (1.4%) fraction of nuclear light that escapes without suffering obscuration, or to nuclear scattered light (see e.g. Zakamska et al. 2006).
After combining all the starbursts models, with all the torus models and with the type 1 QSO template, we then reject all combinations that overpredict the fluxes at 70, and 160m. This criterion rejects about 40% of all models. We then select 50 models with the lowest , computed by comparing the predicted and observed fluxes in 7 bands, from 1.25 m to 24 m. The best 50 models are shown in Fig. 6. The choice of 50 models yields a wide enough range of solutions to characterize all acceptable models and the luminosities produced by each component. A higher number of models yields either poor fits or does not increase significantly the range of SEDs already represented by the 50 best models.
The preferred starburst models contain an old stellar population component, correspond to starbursts of intermediate sizes, i.e. 3 kpc, and show a wide range of ratios, 40–90%, of the OB stars luminosity with respect to the total luminosity. The preferred torus model for both sources, defined as the most often chosen among the best 50 models, corresponds to a torus with axis at only 15∘ from the line of sight with an additional cold dusty absorber along the line of sight. Such a model explains the prominent MIR emission as radiation from hot dust in the torus inner walls, and the red MIR colors as extinguished torus radiation by a cold absorber (for details on the AGN models see Polletta et al. 2008).
From the set of acceptable models we derive the AGN and the starburst bolometric (0.1–1000 m) luminosities, and the IR (8–1000 m) starburst luminosity. The derived luminosities for all acceptable models are reported in Table 3.
Assuming that the estimated IR luminosity is produced by a starburst, the derived SFRs, given by SFR(M⊙/yr) = L(IR)/(5.8109L⊙) (Kennicutt 1998), are 500–3000 M⊙/yr for both sources. The estimated SFRs are consistent with those estimated in other radio-quiet obscured QSOs at high- (e.g Ivison et al. 1998; Efstathiou 2006; Stevens et al. 2005; Polletta et al. 2008; Sajina et al. 2007b).
| Parameter777L(IR) is the 8–1000 m luminosity in L⊙ derived by integrating the model under Method. L in the monochromatic radio luminosity at 1.4 GHz in the rest-frame in W Hz-1. L(H) is the monochromatic luminosity in L⊙ at 1.6 m in the rest-frame derived from the starburst models. M∗ is the stellar mass derived from L(H) assuming the average L(H)/M∗ ratio derived from the high- radio galaxy sample in Seymour et al. (2007). L(6m) is the rest-frame luminosity at 6m in L⊙ derived from the torus models. L is the 0.1–1000 m luminosity derived from the starburst models in L⊙. L is the 0.1–1000 m luminosity derived from the torus models in L⊙. | Method888The SK07 starburst models are from the library in Siebenmorgen & Krügel (2007). The H06 torus models are from Hönig et al. (2006). PL stands for power-law model with spectral index , , where =1.3 for SW022550, and 0.7 for SW022513. | SW022550 | SW022513 |
| Log(L(IR)) | SK07 Starburst | 12.5–13.3 | 12.5–13.2 |
| Log(L) | PL | 25.50 | 25.38 |
| Log(L(H)) | SK07 Starburst | 11.2–11.9 | 11.3–11.6 |
| Log(M∗) | L(H) (S07) | 11.2–11.9 | 11.3–11.6 |
| Log(L(6m)) | H06 Torus | 13.1–13.2 | 12.9–12.9 |
| Log(L) | SK06 Starburst | 12.6–13.4 | 12.4–13.2 |
| Log(L) | H06 Torus | 13.4 | 13.1 |
3.3 The origin of the radio luminosity
Among the various feedback mechanisms that have been suggested as star formation regulators in high- galaxies, the radio feedback mode is probably the most popular and successful in reproducing numerous observables through simulations (Silk & Rees 1998; Croton et al. 2006; Cattaneo & Teyssier 2007). Because of the predicted short timescale associated with the radio activity and of the difficulty of identifying AGN-driven radio activity in non radio-loud objects, there is only limited evidence of radio feedback at play on star-formation in AGNs, especially at high-, and at high luminosities. The best supporting observations are the detection of AGN-driven outflows in high- radio-galaxies (Nesvadba et al. 2006, 2007b, 2007a), and of moderate AGN-driven radio activity in high- Spitzer-selected starburst and AGNs (Sajina et al. 2007a; Polletta 2008). Finding further evidence of AGN-driven radio activity, especially in massive high- star forming galaxies, would provide additional support for the radio feedback as quenching mechanism. Here, we analyze the origin of the radio emission in our two sources.
The measured radio fluxes of SW022550, and SW022513 correspond to 1.4 GHz rest-frame luminosities of 1025.50 and 1025.38 , respectively, or SFRs6000 M⊙/yr, if powered by star formation. These high luminosities would imply the presence of AGN-driven radio emission in the local universe (an AGN is classified radio-loud if , corresponding to a SFR 100 M⊙/yr; Condon 1992). However, at high-, intense starburst episodes with SFRs of thousands of M⊙/yr can be expected. It is thus not straightforward to infer an AGN origin of the radio emission in sources at high- based on the estimated radio luminosities. Although a broad multi-wavelength coverage is available for both sources, some traditional diagnostic methods would not be reliable in probing an AGN origin of the radio emission. The commonly diagnostic based on large radio/optical flux ratios cannot be applied because our sources suffer from heavy optical obscuration. Another diagnostic is provided by the radio/infrared flux ratio, which is based on the well established far-IR/radio correlation (Condon 1992). The average FIR-to-radio emission ratio = log(L(FIR)/3.751012 W)log(Lν,1.4GHz/W Hz-1) is equal to 2.34 in local star forming galaxies (Yun et al. 2001), where L(FIR)=L40-120μm, and L(FIR)/L(IR)=0.560.1 for the starburst models used in this work. Slightly lower values have been found in sources at higher , =2.07 in 2 SMGs (Kovács et al. 2006), and =2.210.02 in radio-quiet MIR selected 1–2.5 AGNs (Sajina et al. 2008). As the AGN contribution to the radio emission increases, decreases. For example, in radio loud AGNs is typically close to zero or negative. The values derived for our sources using the FIR luminosities obtained from the starburst models (see Table 3) are 0.8–1.6 for both sources. These low values favor an AGN origin for the observed radio emission. This is also supported by the steep radio spectral index in SW022550 and the extended radio size of SW022513.
In summary, we find some evidence of an AGN origin for the radio emission of our two sources. The associated radio activity is moderate, as it is only slightly in excess of what is typically observed in radio quiet quasars and much less than in radio loud quasars.
3.4 AGN and starburst contribution to the bolometric luminosity
The SEDs of our sources indicate that their MIR emission is dominated by AGN-heated dust. Using the best torus models described in § 3.2 and shown in Fig. 6, we estimate a lower limit to the AGN bolometric luminosity by integrating the torus model in the 0.1–1000 m wavelength range. The derived AGN bolometric luminosities, also reported in Table 3, are 1013.4 L⊙, and 1013.1 L⊙ for SW022550 and SW022513, respectively. To derive the starburst bolometric luminosity, we do the same integration but using only the starburst models. Based on these approximations, the AGN contribution to the bolometric luminosities is 50–87% in SW022550, and 43–83% in SW022513. The broad range of values is due to the uncertainty on the starburst IR luminosity. The AGN contribution to the system bolometric luminosity is thus at least 40%, and it can be more than 80%.
3.5 Host stellar luminosity
The stellar emission, in , from a host galaxy peaks in the NIR, typically at 1.6 m in the rest-frame (or H-band) (Sawicki 2002). The ratio between NIR luminosity and stellar mass is characterized by little dispersion, especially when similar star formation histories are assumed. The estimated stellar masses can be 30% lower in case of younger stellar populations. Thus, we can assume that the NIR luminosity is a proxy of the stellar mass or luminosity of the host galaxy. Since in our objects the AGN optical and NIR emissions are obscured, we can directly estimate the host NIR luminosity from the observed SED. Indeed, the best-fit SED models show that the NIR emission is dominated by stellar light. We estimate the host, and thus stellar, H-band host luminosities using the acceptable starburst templates described above. From the H-band luminosity, we estimate the stellar mass using the average L(H)/M∗ ratio derived for a sample of high- radio galaxies by Seymour et al. (2007), Log(M∗) = Log(L(H))0.10.1, where M∗ is the stellar mass in M⊙ and L(H) is the monochromatic H-band luminosity in L⊙. Note that this relationship assumes a Kroupa (2001) initial mass function (IMF). The estimated stellar masses are 1.3–6.51011 M⊙ for SW022550, and 1.5–2.91011 M⊙ for SW022513. The estimated H-band luminosities and stellar masses are reported in Table 3. Because of the uncertainty in separating the host and the AGN contributions to the H-band luminosity, the stellar masses should be considered as upper limits to the true stellar masses. The estimated masses are of the same order as those of the most massive systems at high- (see e.g. Seymour et al. 2007; Berta et al. 2007), and are thus among the most massive objects at 3–4.
4 Discussion
4.1 Dust obscuration: geometry and distribution
The two sources analyzed in this work exhibit properties usually observed in type 2 AGNs. Their narrow line dominated spectra, low optical/IR flux ratios and faint X ray fluxes imply that they are obscured, but both sources show a blue optical continuum which is unexpected by the standard AGN unification model (Antonucci 1993), but not unusual for obscured AGNs (see e.g. SW104409; Polletta et al. 2006). Moreover, SW022550 shows some broad components in its optical spectrum. In addition, both sources also exhibit a prominent MIR emission suggesting that the hottest dust component, likely at the dust sublimation radius, is in part visible (see preferred torus models in § 3.2). These hybrid properties suggest that a fraction of the nuclear light is visible. Since the SEDs of our sources cannot be simply reproduced by extinguishing the emission of a type 1 QSO, a more complex model is required to explain their properties. A proper modeling, that takes into account various geometries, dust properties, the intensity and the spectrum and luminosity of the heating source, and a radiative transfer treatment would be necessary to fully explain their hybrid properties. However, the uncertainty on determining the spectrum of the AGN component due mainly to the contribution from the host galaxy, and the lack of a MIR spectrum, would yield degeneracies in the models. Thus, we limit our discussion to a qualitative comparison with some of the most popular models of obscuring dust in AGNs from the literature. A possible scenario is a clumpy dust distribution which produces a partial covering of the nucleus (Nenkova et al. 2002; Hönig et al. 2006). This scenario is quite unlikely if the optical radiation comes from the nuclear region, and it is thus much smaller than the dust sublimation radius. An alternative to an unobstructed line of sight to the nucleus is having a scattering medium, perhaps associated with the NLR. The scattering medium can produce the blue optical light, and broad emission lines. If dust is mixed with the scattering medium, this might be responsible for the large MIR excess, while the nuclear light is obscured by the dusty torus (Schweitzer et al. 2008). Spectropolarimetric observations to measure the scattered component are planned for SW022550 to investigate the latter scenario.
4.2 SMG–QSO evolutionary link
Our targets show simultaneous powerful starburst and AGN activity. They are thus good candidates for transitioning objects between the starburst and the QSO stage predicted by the most popular evolutionary models (Sanders et al. 1988; Alexander et al. 2005c). Here, we consider their properties to make predictions on their evolution.
From the AGN bolometric luminosity (see Table 3), and assuming that the AGN emission is Eddington limited (), we derive a lower limit to the BH masses of SW022550 and SW022513 of M⊙ and 3.7 M⊙, respectively. Since most of the quasars accrete below their Eddington limit (McLure & Dunlop 2004), it would be more realistic to assume a lower Eddington ratio, but this would imply even higher BH masses. Note that these estimates are not quite accurate since we are estimating the AGN bolometric luminosity from the reprocessed thermal emission which is highly dependent on the properties of the reprocessing dust (see e.g. Marconi et al. 2004). Assuming an accretion efficiency of 10%, the derived accretion rates are 17 M⊙ yr-1 for SW022550 and 8.5 M⊙ yr-1 for SW022513.
Assuming the estimated BH masses and the stellar masses derived in § 3.5, we find that these sources lie on the local MBH-Mbulge relationship (e.g. Marconi & Hunt 2003). Thus they are more similar to other obscured QSOs at high-, than to SMGs with AGN activity or type 1 AGNs which are both offset from the local MBH-Mbulge relationship (Alexander et al. 2008; Polletta 2008; Coppin et al. 2008). In order to keep these objects on the local MBH-Mbulge relation as they evolve, the on-going star formation process and BH growth will have to stop, or continue with analogous rates (SFRṀ). Since accretion rates of thousands, or even hundreds of M⊙/yr are not sustainable, the latter scenario can occur only if the SFR decreases significantly. In either cases, we predict a quick decrease in the SFR of our sources. The presence of shocks and outflowing gas and the moderate AGN-driven radio activity might be the expression of an AGN-induced feedback that will cause the predicted SFR to decrease. Such a mechanism is predicted in numerous current evolutionary models (Silk 2005; Croton et al. 2006), but it is more often invoked in AGNs at lower redshifts and luminosities. Our results suggest that radio feedback might be also important in high- QSOs (see also Sajina et al. 2008; Polletta 2008).
5 Summary
We analyze the multi-wavelength spectral energy distributions of two obscured QSOs at high- discovered in the CFHTLS-D1/SWIRE survey, SWIRE4 J022550.67042142.37 (=3.867) and SWIRE4 J022513.92043420.24 (=3.427). Both sources benefit from multi-wavelength data available in the field and from mm data from MAMBO and optical and NIR spectroscopy obtained as part of a dedicated follow up program.
Their large mm fluxes, 4 mJy, imply IR luminosities 1012.5-13.3 L⊙, and SFRs500–3000 M⊙/yr. The two sources also show powerful AGN activity, mostly seen in the MIR (L(MIR)1013 L⊙) and in the optical emission lines, and probably also at radio wavelengths. Their MIR emission is mainly due to AGN-heated hot dust and corresponds to a luminosity comparable to or higher than the starburst luminosity. The MIR SEDs are redder and more luminous than observed in other mm-detected obscured QSOs (see § 3.1 and Figure 4).
Their optical and NIR spectra are characterized by faint or absent continuum emission and strong emission lines typical of AGNs. The optical spectrum of SW022550 suggests either a high metalicity, , or the presence of shocks. The comparison between the rest-frame ultraviolet (UV) and optical spectra indicates the presence of outflowing material with a velocity of 500 . The red and faint NIR emission compared to the MIR emission indicates that the AGN is extincted by dust with 4. The faint X ray emission, the large hardness ratio, and the small X ray/[O III] 5007, and X ray/MIR luminosity ratios suggest that their X ray emission might be absorbed by a gas column density 1024 , and thus that they are Compton-thick QSOs.
The sources show some hybrid properties in between those of type 1 and type 2 AGNs, i.e. a broad component in some UV emission lines, blue UV colors, and a significant emission from hot dust, likely at the sublimation radius. We suggest that these properties are explained by the presence of scattered light at UV wavelengths, and that a hot dust component might be visible, perhaps associated with the NLR and with the scattering medium.
The scattering scenario will be tested with planned spectropolarimetric observations on the VLT of SW022550. With those data we will investigate whether the UV emission of SW022550 is dominated by a scattered component, and measure the scattered fraction.
The composite (starburst and AGN) nature of our sources suggests that they might be experiencing the transition phase between the starburst and the QSO stage predicted by some evolutionary models (e.g. Di Matteo et al. 2005). Since both sources already lie on the local relation, we predict a quick decrease in their SFR in order to remain on such a relation as they evolve. Both sources are characterized by AGN-driven moderate radio activity, providing support to evolutionary models invoking radio feedback as star formation quenching mechanism even in powerful QSOs (Silk 2005; Croton 2006).
Acknowledgements.
We thank the referee, R. Antonucci, for a very careful reading and helpful comments and suggestions. MP is grateful to S. Andreon for providing a list of clusters around our sources. MP is also grateful to M. Bondi for providing the VLA image of SW022513. MP thanks N. Fiolet for the final validation of the MAMBO measurements. MP is particularly thankful to N. Miller and C. Norman for providing the radio data for CDF-202, and for helpful discussions. MP thanks S. Hönig for the permission to use the torus models. CSS is grateful to S. Croom for providing the AUTOZ code. MP acknowledges financial support from the Marie-Curie Fellowship grant MEIF-CT-2007-042111. The AAOmega observations have been funded by the Optical Infrared Coordination network (OPTICON), a major international collaboration supported by the Research Infrastructures Programme of the European Commission’s Sixth Framework Programme. This work is based on observations made with the Spitzer Space Telescope, which is operated by the Jet Propulsion Laboratory, California Institute of Technology under NASA contract 1407. We are thankful to the IRAM staff for their support with the observations and the data reduction.References
- Alexander et al. (2005a) Alexander, D. M., Bauer, F. E., Chapman, S. C., et al. 2005a, ApJ, 632, 736
- Alexander et al. (2008) Alexander, D. M., Brandt, W. N., Smail, I., et al. 2008, AJ, 135, 1968
- Alexander et al. (2005b) Alexander, D. M., Chartas, G., Bauer, F. E., et al. 2005b, MNRAS, 357, L16
- Alexander et al. (2005c) Alexander, D. M., Smail, I., Bauer, F. E., et al. 2005c, Nature, 434, 738
- Allen et al. (2008) Allen, M. G., Groves, B. A., Dopita, M. A., Sutherland, R. S., & Kewley, L. J. 2008, ApJS, 178, 20
- Antonucci (1993) Antonucci, R. 1993, ARA&A, 31, 473
- Baldwin et al. (1988) Baldwin, J. A., McMahon, R., Hazard, C., & Williams, R. E. 1988, ApJ, 327, 103
- Berta et al. (2007) Berta, S., Lonsdale, C. J., Polletta, M., et al. 2007, A&A, 476, 151
- Bondi et al. (2007) Bondi, M., Ciliegi, P., Venturi, T., et al. 2007, A&A, 463, 519
- Bondi et al. (2003) Bondi, M., Ciliegi, P., Zamorani, G., et al. 2003, A&A, 403, 857
- Cattaneo & Teyssier (2007) Cattaneo, A. & Teyssier, R. 2007, MNRAS, 376, 1547
- Chakrabarti et al. (2007) Chakrabarti, S., Cox, T. J., Hernquist, L., et al. 2007, ApJ, 658, 840
- Chapman et al. (2005) Chapman, S. C., Blain, A. W., Smail, I., & Ivison, R. J. 2005, ApJ, 622, 772
- Chiappetti et al. (2005) Chiappetti, L., Tajer, M., Trinchieri, G., et al. 2005, A&A, 439, 413
- Ciliegi et al. (2005) Ciliegi, P., Zamorani, G., Bondi, M., et al. 2005, A&A, 441, 879
- Ciliegi et al. (2003) Ciliegi, P., Zamorani, G., Hasinger, G., et al. 2003, A&A, 398, 901
- Condon (1992) Condon, J. J. 1992, ARA&A, 30, 575
- Coppin et al. (2008) Coppin, K. E. K., Swinbank, A. M., Neri, R., et al. 2008, MNRAS, 389, 45
- Croton (2006) Croton, D. J. 2006, MNRAS, 369, 1808
- Croton et al. (2006) Croton, D. J., Springel, V., White, S. D. M., et al. 2006, MNRAS, 365, 11
- Di Matteo et al. (2005) Di Matteo, T., Springel, V., & Hernquist, L. 2005, Nature, 433, 604
- Dickey & Lockman (1990) Dickey, J. M. & Lockman, F. J. 1990, ARA&A, 28, 215
- Dye et al. (2006) Dye, S., Warren, S. J., Hambly, N. C., et al. 2006, MNRAS, 372, 1227
- Efstathiou (2006) Efstathiou, A. 2006, MNRAS, 371, L70
- Elvis et al. (1994) Elvis, M., Wilkes, B. J., McDowell, J. C., et al. 1994, ApJS, 95, 1
- Fazio et al. (2004) Fazio, G. G., Hora, J. L., Allen, L. E., et al. 2004, ApJS, 154, 10
- Ferrarese (2002) Ferrarese, L. 2002, ApJ, 578, 90
- Fritz et al. (2006) Fritz, J., Franceschini, A., & Hatziminaoglou, E. 2006, MNRAS, 366, 767
- Gallagher et al. (1989) Gallagher, J. S., Hunter, D. A., & Bushouse, H. 1989, AJ, 97, 700
- Gebhardt et al. (2000) Gebhardt, K., Bender, R., Bower, G., et al. 2000, ApJ, 539, L13
- Goodrich et al. (1996) Goodrich, R. W., Miller, J. S., Martel, A., et al. 1996, ApJ, 456, L9
- Granato et al. (2004) Granato, G. L., De Zotti, G., Silva, L., Bressan, A., & Danese, L. 2004, ApJ, 600, 580
- Granato et al. (2001) Granato, G. L., Silva, L., Monaco, P., et al. 2001, MNRAS, 324, 757
- Groves et al. (2004) Groves, B. A., Dopita, M. A., & Sutherland, R. S. 2004, ApJS, 153, 75
- Hamann & Ferland (1993) Hamann, F. & Ferland, G. 1993, ApJ, 418, 11
- Hao et al. (2008) Hao, C.-N., Xia, X.-Y., Shu-DeMao, Deng, Z.-G., & Wu, H. 2008, Chinese Journal of Astronomy and Astrophysics, 8, 12
- Hartwick (2004) Hartwick, F. D. A. 2004, ApJ, 603, 108
- Hasinger et al. (2005) Hasinger, G., Miyaji, T., & Schmidt, M. 2005, A&A, 441, 417
- Hatziminaoglou et al. (2005) Hatziminaoglou, E., Pérez-Fournon, I., Polletta, M., et al. 2005, AJ, 129, 1198
- Hines et al. (2006) Hines, D. C., Krause, O., Rieke, G. H., et al. 2006, ApJ, 641, L85
- Hönig et al. (2006) Hönig, S. F., Beckert, T., Ohnaka, K., & Weigelt, G. 2006, A&A, 452, 459
- Hopkins et al. (2005a) Hopkins, P. F., Hernquist, L., Cox, T. J., et al. 2005a, ApJ, 630, 705
- Hopkins et al. (2005b) Hopkins, P. F., Hernquist, L., Cox, T. J., et al. 2005b, ApJ, 630, 716
- Hopkins et al. (2006) Hopkins, P. F., Hernquist, L., Cox, T. J., et al. 2006, ApJ, 639, 700
- Ivison et al. (1998) Ivison, R. J., Smail, I., Le Borgne, J.-F., et al. 1998, MNRAS, 298, 583
- Kennicutt (1998) Kennicutt, Jr., R. C. 1998, ARA&A, 36, 189
- Kovács et al. (2006) Kovács, A., Chapman, S. C., Dowell, C. D., et al. 2006, ApJ, 650, 592
- Kreysa et al. (1998) Kreysa, E., Gemuend, H.-P., Gromke, J., et al. 1998, in Proc. SPIE Vol. 3357, p. 319-325, Advanced Technology MMW, Radio, and Terahertz Telescopes, Thomas G. Phillips; Ed., ed. T. G. Phillips, 319–325
- Kroupa (2001) Kroupa, P. 2001, MNRAS, 322, 231
- Lawrence et al. (2007) Lawrence, A., Warren, S. J., Almaini, O., et al. 2007, MNRAS, 379, 1599
- Le Floc’h et al. (2007) Le Floc’h, E., Willmer, C. N. A., Noeske, K., et al. 2007, ApJ, 660, L65
- Li et al. (2007) Li, Y., Hernquist, L., Robertson, B., et al. 2007, ApJ, 665, 187
- Lonsdale et al. (2008) Lonsdale, C. J., Polletta, M., Omont, A., et al. 2008, ApJ accepted [arXiv:0810.1293]
- Lonsdale et al. (2003) Lonsdale, C. J., Smith, H. E., Rowan-Robinson, M., et al. 2003, PASP, 115, 897
- Mainieri et al. (2005) Mainieri, V., Rigopoulou, D., Lehmann, I., et al. 2005, MNRAS, 356, 1571
- Marconi & Hunt (2003) Marconi, A. & Hunt, L. K. 2003, ApJ, 589, L21
- Marconi et al. (2004) Marconi, A., Risaliti, G., Gilli, R., et al. 2004, MNRAS, 351, 169
- Marulli et al. (2008) Marulli, F., Bonoli, S., Branchini, E., Moscardini, L., & Springel, V. 2008, MNRAS, 257
- McLure & Dunlop (2004) McLure, R. J. & Dunlop, J. S. 2004, MNRAS, 352, 1390
- Miller et al. (2008) Miller, N. A., Fomalont, E. B., Kellermann, K. I., et al. 2008, ApJS accepted [arXiv:0804.2375]
- Moorwood et al. (1998) Moorwood, A., Cuby, J.-G., Biereichel, P., et al. 1998, The Messenger, 94, 7
- Moy & Rocca-Volmerange (2002) Moy, E. & Rocca-Volmerange, B. 2002, A&A, 383, 46
- Mulchaey et al. (1994) Mulchaey, J. S., Koratkar, A., Ward, M. J., et al. 1994, ApJ, 436, 586
- Nagao et al. (2006) Nagao, T., Maiolino, R., & Marconi, A. 2006, A&A, 447, 863
- Nenkova et al. (2002) Nenkova, M., Ivezić, Ž., & Elitzur, M. 2002, ApJ, 570, L9
- Nesvadba et al. (2007a) Nesvadba, N. P. H., Lehnert, M. D., De Breuck, C., Gilbert, A., & van Breugel, W. 2007a, A&A, 475, 145
- Nesvadba et al. (2006) Nesvadba, N. P. H., Lehnert, M. D., Eisenhauer, F., et al. 2006, ApJ, 650, 693
- Nesvadba et al. (2007b) Nesvadba, N. P. H., Lehnert, M. D., Genzel, R., et al. 2007b, ApJ, 657, 725
- Netzer et al. (2006) Netzer, H., Mainieri, V., Rosati, P., & Trakhtenbrot, B. 2006, A&A, 453, 525
- Norman et al. (2002) Norman, C., Hasinger, G., Giacconi, R., et al. 2002, ApJ, 571, 218
- Osterbrock (1989) Osterbrock, D. E. 1989, Astrophysics of gaseous nebulae and active galactic nuclei (Research supported by the University of California, John Simon Guggenheim Memorial Foundation, University of Minnesota, et al. Mill Valley, CA, University Science Books, 1989, 422 p.)
- Page et al. (2004) Page, M. J., Stevens, J. A., Ivison, R. J., & Carrera, F. J. 2004, ApJ, 611, L85
- Polletta (2008) Polletta, M. 2008, A&A, 480, L41
- Polletta et al. (2007) Polletta, M., Tajer, M., Maraschi, L., et al. 2007, ApJ, 663, 81
- Polletta et al. (2008) Polletta, M., Weedman, D., Hönig, S., et al. 2008, ApJ, 675, 960
- Polletta et al. (2006) Polletta, M., Wilkes, B. J., Siana, B., et al. 2006, ApJ, 642, 673
- Pope et al. (2008) Pope, A., Chary, R.-R., Alexander, D. M., et al. 2008, ApJ, 675, 1171
- Richards et al. (2004) Richards, G. T., Nichol, R. C., Gray, A. G., et al. 2004, ApJS, 155, 257
- Rieke et al. (2004) Rieke, G. H., Young, E. T., Engelbracht, C. W., et al. 2004, ApJS, 154, 25
- Roettgering et al. (1994) Roettgering, H. J. A., Lacy, M., Miley, G. K., Chambers, K. C., & Saunders, R. 1994, A&AS, 108, 79
- Rowan-Robinson et al. (1993) Rowan-Robinson, M., Efstathiou, A., Lawrence, A., et al. 1993, MNRAS, 261, 513
- Sajina et al. (2007a) Sajina, A., Yan, L., Armus, L., et al. 2007a, ApJ, 664, 713
- Sajina et al. (2007b) Sajina, A., Yan, L., Lacy, M., & Huynh, M. 2007b, ApJ, 667, L17
- Sajina et al. (2008) Sajina, A., Yan, L., Lutz, D., et al. 2008, ApJ, 683, 659
- Sanders et al. (1989) Sanders, D. B., Phinney, E. S., Neugebauer, G., Soifer, B. T., & Matthews, K. 1989, ApJ, 347, 29
- Sanders et al. (1988) Sanders, D. B., Soifer, B. T., Elias, J. H., Neugebauer, G., & Matthews, K. 1988, ApJ, 328, L35
- Sawicki (2002) Sawicki, M. 2002, AJ, 124, 3050
- Schweitzer et al. (2008) Schweitzer, M., Groves, B., Netzer, H., et al. 2008, ApJ, 679, 101
- Seymour et al. (2007) Seymour, N., Stern, D., De Breuck, C., et al. 2007, ApJS, 171, 353
- Sharp et al. (2006) Sharp, R., Saunders, W., Smith, G., et al. 2006, in Presented at the Society of Photo-Optical Instrumentation Engineers (SPIE) Conference, Vol. 6269, Ground-based and Airborne Instrumentation for Astronomy. Edited by McLean, Ian S.; Iye, Masanori. Proceedings of the SPIE, Volume 6269, pp. 62690G (2006).
- Shields et al. (2008) Shields, J. C., Walcher, C. J., Böker, T., et al. 2008, ApJ, 682, 104
- Siana et al. (2008) Siana, B., Polletta, M. d. C., Smith, H. E., et al. 2008, ApJ, 675, 49
- Siebenmorgen & Krügel (2007) Siebenmorgen, R. & Krügel, E. 2007, A&A, 461, 445
- Silk (2005) Silk, J. 2005, MNRAS, 364, 1337
- Silk & Rees (1998) Silk, J. & Rees, M. J. 1998, A&A, 331, L1
- Spergel et al. (2003) Spergel, D. N., Verde, L., Peiris, H. V., et al. 2003, ApJS, 148, 175
- Springel et al. (2005) Springel, V., White, S. D. M., Jenkins, A., et al. 2005, Nature, 435, 629
- Steidel et al. (1999) Steidel, C. C., Adelberger, K. L., Giavalisco, M., Dickinson, M., & Pettini, M. 1999, ApJ, 519, 1
- Stern et al. (2002) Stern, D., Moran, E. C., Coil, A. L., et al. 2002, ApJ, 568, 71
- Stevens et al. (2005) Stevens, J. A., Page, M. J., Ivison, R. J., et al. 2005, MNRAS, 360, 610
- Surace et al. (2005) Surace, J. A., Shupe, D. L., Fang, F., et al. 2005, Spitzer Science Center, California Institute of Technology
- Szokoly et al. (2004) Szokoly, G. P., Bergeron, J., Hasinger, G., et al. 2004, ApJS, 155, 271
- Tajer et al. (2007) Tajer, M., Polletta, M., Chiappetti, L., et al. 2007, A&A, 467, 73
- Teplitz et al. (2006) Teplitz, H. I., Armus, L., Soifer, B. T., et al. 2006, ApJ, 638, L1
- Vanden Berk et al. (2001) Vanden Berk, D. E., Richards, G. T., Bauer, A., et al. 2001, AJ, 122, 549
- Vernet et al. (2001) Vernet, J., Fosbury, R. A. E., Villar-Martín, M., et al. 2001, A&A, 366, 7
- Wang et al. (2007) Wang, R., Carilli, C. L., Beelen, A., et al. 2007, AJ, 134, 617
- Weedman et al. (2006) Weedman, D., Polletta, M., Lonsdale, C. J., et al. 2006, ApJ, 653, 101
- Yan et al. (2007) Yan, L., Sajina, A., Fadda, D., et al. 2007, ApJ, 658, 778
- Yun et al. (2001) Yun, M. S., Reddy, N. A., & Condon, J. J. 2001, ApJ, 554, 803
- Zakamska et al. (2006) Zakamska, N. L., Strauss, M. A., Krolik, J. H., et al. 2006, AJ, 132, 1496