Scanning tunneling microscopy and kinetic Monte Carlo investigation
of Cesium superlattices on Ag(111)
Abstract
Cesium adsorption structures on Ag(111) were characterized in a low-temperature scanning tunneling microscopy experiment. At low coverages, atomic resolution of individual Cs atoms is occasionally suppressed in regions of an otherwise hexagonally ordered adsorbate film on terraces. Close to step edges Cs atoms appear as elongated protrusions along the step edge direction. At higher coverages, Cs superstructures with atomically resolved hexagonal lattices are observed. Kinetic Monte Carlo simulations model the observed adsorbate structures on a qualitative level.
pacs:
68.35.-p,68.37.-d,68.37.Ef,68.43.FgI Introduction
Alkali metal adsorption on metal surfaces has been studied intensely since many years (for a review the reader is referred to Refs. rdd_96, ; hpb_89, ). With their single electron at the outermost atomic shell these metals are considered as simple and much research is devoted to the analysis of the interplay between their mutual interaction and the interaction with the hosting substrate. rdd_96 Previous structural studies of Ag(111)-Cs focussed on adsorbate superstructures at higher coverages. For instance, a structure along with evidence of some disordered and possibly incommensurate phases was found. rgr_85 ; cca_85 Bond length changes between the Cs adsorption layer (adlayer) and the Ag(111) substrate surface were studied by surface-extended X-ray absorption fine structure also for higher coverages. gla_88 Leatherman and Diehl provided a structural analysis of Ag(111)-Cs for various coverages and temperatures using low-energy electron diffraction. gle_96 In particular, for very low coverages they found ring-like diffraction patterns which were assigned to disordered or fluid overlayer phases. This fluid phase appears to be a common arrangement of alkali metal films on metal surfaces at low coverage. sal_83 ; wcf_88 ; zyl_91 ; tvh_06 It is usually argued that at low coverages the dipole-dipole repulsion between the adsorbed alkali metal atoms dominates the alkali-substrate interaction resulting in a structure with no long-range order, yet with a typical distance between the adsorbed atoms (adatoms). Besides these structural properties, alkali metal-covered surfaces exhibit intriguing electronic properties resulting from quantum size effects: Quantum well states confined to ultrathin films of alkali metals are investigated experimentally as well as theoretically. sal_88 ; nfi_93 ; tfa_95 ; aca_97 ; mba_97 ; sog_99 ; bhe_00 ; tch_00 ; mni_01 ; jkl_02 ; aka_05 ; cco_05 ; jkr_05
While the dipole-dipole interaction presents a direct coupling between Cs adatoms, the substrate may influence the Cs-Cs interaction in an indirect way. Indirect interaction between two atoms was first investigated theoretically by Koutecký jko_58 and then by Grimley, tgr_67 Newns, dne_69 and Einstein and Schrieffer. tei_73 In an early field ion microscopy experiment evidence for indirect interaction between Re atoms adsorbed on W(110) was reported by Tsong. tts_73 In particular, it was found that the interaction energy exhibits an oscillatory behavior as a function of the separation distance between the adatoms. Lau and Kohn kla_78 then predicted a long-range and oscillatory interaction between atoms mediated by Friedel oscillations of a two-dimensional electron gas. The first scanning tunneling microscopy (STM) experiment evidencing this type of interaction was reported by Brune et al. hbr_90 for carbon atoms adsorbed on Al(111). Similar experiments were then performed for benzene molecules on Cu(111), mka_96 sulfur atoms on Cu(111), ewa_98 copper atoms on Cu(111), jre_00 cobalt atoms on Cu(111) and Ag(111), nkn_02 and for Ce atoms adsorbed on Ag(111). fsi_04 These experiments reveal that the adatom-adatom distance is predominantly influenced by the surface state-mediated interaction. In particular, the mutual distance is reported to be where denotes the Fermi wavelength of the involved surface state. This interaction may lead to superlattices on surfaces fsi_04 or to confinement-induced adatom self-organization in quantum corrals. neg_06 ; vss_06
Here, we report a low-temperature STM experiment on Cs adsorbed on Ag(111) at various coverages. At low coverages, substrate terraces are covered by Cs adatoms which locally exhibit hexagonally ordered domains. Long-range hexagonal order of the adlayer, however, does not exist owing to regions where individual Cs adatoms are not resolved in STM images. Similarly, at and close to step edges individual Cs atoms are not resolved and appear as almost continuous rows running parallel to the step edges. At higher coverages the characteristic smearing of adsorbate structures on terraces and at step edges disappears and individually resolved adatoms form superlattices with long-range hexagonal order. Kinetic Monte Carlo simulations model the experimental situation on a qualitative level. We found that both the surface state-mediated interaction between Cs adatoms and the dipole-dipole interaction are equally important, in particular for low coverages, and have to be included in the model. The simulations reveal that loss of atomic resolution is likely due to the low adsorbate coverage matching an incommensurate superstructure. At higher coverages, as a result of a reduced adatom-adatom distance, the mutual dipole repulsion is strong enough to stabilize a superlattice with long-range hexagonal symmetry and to suppress adatom diffusion.
II Experiment
Experiments were performed using a custom-built scanning tunneling microscope operated at and in ultrahigh vacuum with a base pressure of . The Ag(111) surface as well as chemically etched tungsten tips were cleaned by argon ion bombardment and annealing. Cesium was deposited at room temperature from commercial dispensers sae_gt at a rate of as monitored by a quartz microbalance and judged from the deposition time and corresponding STM images. We define a monolayer (ML) as one Cs atom per Ag atom. All STM images presented in this work were obtained in the constant-current mode with voltages applied to the sample.
III Simulations
We model aspects of our results by using the kinetic Monte Carlo method dco_65 ; wyo_66 which got a firm theoretical background by Fichthorn and Weinberg. fic_91 Recently, the kinetic Monte Carlo method has been used to study the self-organization of adatoms due to surface state-mediated interactions. neg_06 ; vss_06 The substrate lattice is modeled by finite hop rates of adatoms between adjacent lattice sites and . The hop rate is described by an Arrhenius law according to
| (1) |
where is the substrate temperature, Boltzmann’s constant and the attempt frequency. For the hopping barrier between lattice sites and we use where is the diffusion barrier height for an isolated adatom and the describe the interaction of atom () with all the other atoms. fic_03 The total interaction is the sum of the dipole-dipole coupling
| (2) |
where is the dipole moment of an individual Cs adatom, the dielectric constant, and the surface state-mediated interaction phy_00
| (3) |
with denoting the scattering amplitude, the surface state binding energy, the scattering phase shift, and the Fermi wave vector.
Our idea is that regions of the adsorbate lattice that exhibit loss of atomic resolution are due to an enhanced mobility of the adatom. It is thus desirable to access the probability of finding a particle at a given lateral coordinate. Therefore, for comparison with experimental data we use the time-averaged two-dimensional distribution function, , which represents the probability of finding a particle at a position during a time interval , i. e.,
| (4) |
where is the number of particles used in the simulation.
IV Results and Discussion
IV.1 Low coverage:
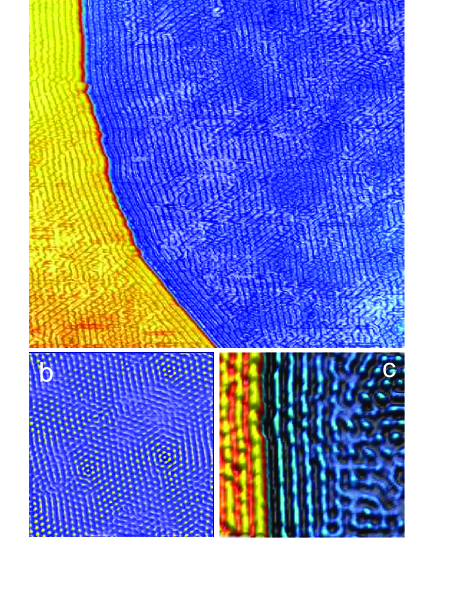
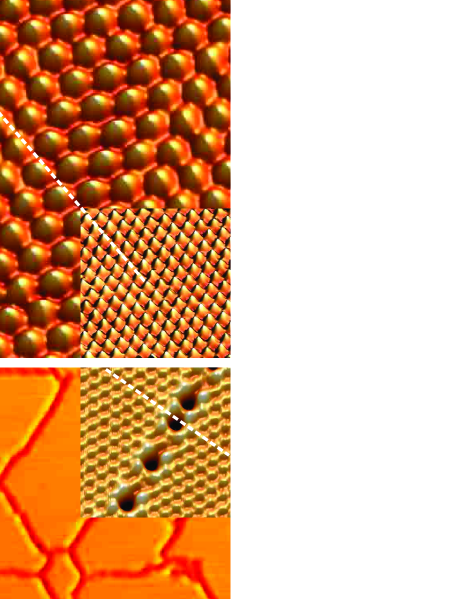
Figure 1 illustrates the main experimental findings at low coverages. The STM image in Fig. 1(a) shows two adjacent terraces of a Ag(111) surface covered with – Cs. On terraces we observe local hexagonal order of Cs atoms. Long-range order is suppressed in regions where Cs adatoms are no longer resolved as point-like features [Fig. 1(b)]. Rather, these regions are characterized by broadened protrusions extending along the symmetry directions of the adsorbate lattice. From atomically resolved STM images of the adsorbate lattice a mutual adatom distance of was determined. At and close to step edges [Fig. 1(c)] adatoms tend to form rows parallel to the step direction separated by . Individual Cs adatoms start to be resolved again at distances exceeding from the step edge.
Below we suggest that the peculiar coexistence of regions with hexagonal order together with regions in which adatoms are not resolved is likely due to an adsorbate coverage matching an incommensurate phase. For our kinetic Monte Carlo simulations several parameters have to be estimated, which are discussed in the following. The results of the kinetic Monte Carlo simulations depend on the transition rates, Eq. (1), which are directly coupled to the parameters of the dipole and the surface state-mediated interactions. These parameters have to be estimated in advance.
In a first step we estimated the dipole moment of an individual Cs adatom. Adsorption leads to a considerable charge transfer from an alkali atom to the substrate. hpb_87 As a consequence the adsorbed atom becomes partly ionic and develops a dipole moment which leads to a decrease of the work function. From the initial linear decrease of the work function the dipole moment of the adsorbed species may be evaluated. hpb_87 The apparent height of the tunneling barrier in STM being related to the work function, we acquired current-distance curves on clean and Cs-covered Ag(111) from which we inferred apparent barrier heights of and , respectively. The difference of the apparent barrier heights is in good agreement with the work function modifications observed on other surfaces covered with alkali metals. hpb_89 ; sal_80 ; jkr_00 Using a work function change of we extract a dipole moment according to lds_66
| (5) |
where is the electron charge and the surface density of alkali metal atoms. As a result we obtain .
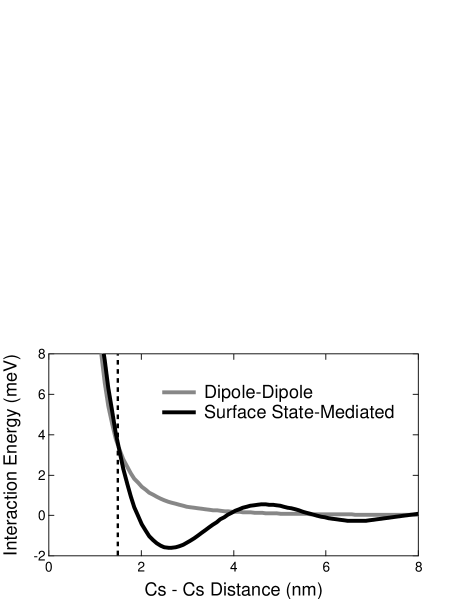
To compare the strength of the dipole-dipole interaction [Eq. (2)] with the interaction mediated by the surface state [Eq. (3)] we also have to determine the parameters , , and . From previously published results ewa_98 ; jre_00 ; nkn_02 ; fsi_04 we infer an amplitude of . The scattering phase shift varies between and ewa_98 ; jre_00 ; nkn_02 ; fsi_04 and within this range our simulations do not depend strongly on the specific choice of . We therefore decided to take . For clean Ag(111) the surface state binding energy is below the Fermi energy. Charge transfer from the Cs layer to the substrate, most likely induces a shift of the surface state binding energy to higher values. To estimate this shift, we resort to a similar adsorption system, namely Cu(111)-Cs, for which a change of the Cu(111) surface state binding energy has been investigated by photoelectron spectroscopy. mbr_07 By extrapolating the photoemission results to low coverages, we find an energy shift of to higher binding energies for a coverage of . However, taking rather than does not alter the results of our simulations. For the parameters estimated above we calculated the interaction energies for the dipole-dipole and the surface state-mediated coupling according to Eqs. (2) and (3). A comparison is shown in Fig. 2. At the adsorbate lattice spacing of observed in the experiment (dashed line in Fig. 2) both interaction energies are similar. Therefore, in our simulations of the low-coverage adatom arrangements we take both interactions into account.
To estimate the diffusion barrier height, , we observed single Cs atoms on the cold surface. Upon positioning the tip above the center of a Cs adatom the feedback loop of the instrument was opened. Next, we measured the time interval from the moment of freezing the feedback loop until the current dropped, which signals that the adatom has moved away from its original position. This procedure resulted in a distribution of time intervals between and . Together with an assumed attempt frequency of (Ref. fic_03, ) we estimate a diffusion barrier height between and at . We find that the choice of and matches the time scale of the experiment quite well. However, a word of caution is necessary in this context. Simulated time scales vary with the factor . Consequently, by modifying , , or both within reasonable limits, experimentally observed time scales may be reproduced. If experimentally observed time scales differ from numerically simulated ones by a factor of more than then it is no longer reasonable to compensate this discrepancy by an adjustment of and . ach_07 In this case new important physical processes have to be included in the menu of hopping events of the kinetic Monte Carlo algorithm. fic_91 It turns out that the inclusion of the adatom mutual interactions according to Eqs. (2) and (3) already leads to correlated transition processes.
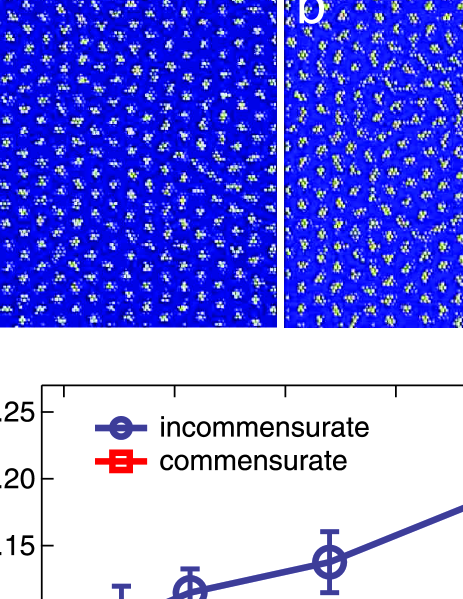
With these parameters at hand we then addressed the experimentally observed coexistence of ordered and less ordered regions. To monitor the time evolution of an initial particle configuration we calculated first the thermal equilibrium of a particle lattice at using canonical Monte Carlo simulations. In the subsequent kinetic Monte Carlo calculations we set the temperature to as measured in the experiment and analysed the time evolution of the particle lattice. Figures 3(a) and 3(b) show the results for particle coverages matching a commensurate [, ] and an incommensurate () superlattice, respectively. The figures show plots of with . Surprisingly, such a slight variation in the coverage leads to considerably different results. Whilst in the commensurate adsorption phase [Fig. 3(a)] is characterized by localized and sharp maxima at sites of a hexagonal lattice with long-range order, in the incommensurate phase [Fig. 3(b)] exhibits regions with maxima which are broader than in the commensurate phase. In particular, at some positions adjacent maxima overlap and appear as elongated and continuous lines following close-packed directions of the hexagonal particle lattice. As a first result we may summarize that particle arrangements that are incommensurate exhibit enhanced particle mobility.
We performed a Voronoï analysis gvo_07 ; plu_05 to investigate the relation between and particle mobility in more detail. As a result we obtain the fraction of particles with a number of nearest neighbors deviating from six. These particles are referred to as defects in the following. This analysis thus provides access to local distortions of the hexagonal symmetry. We define the fraction of these particles according to with denoting the number of defects recorded during the time interval . Figure 3(c) shows the time evolution of for the commensurate (squares) and the incommensurate (circles) phase shown in Figs. 3(a) and 3(b). The fraction increase for is related to thermal relaxation of the initial particle arrangement at low temperature. The relaxation period is finished at and then stays essentially constant for the commensurate phase. For the incommensurate phase, however, an increase of is still observed until . Due to costly computing time we have not performed kinetic Monte Carlo simulations for larger but we expect to become constant also for the incommensurate phase reflecting then thermal equilibrium of the superstructure. From these simulations we may conclude that once the fraction does not exceed – the superlattice remains stable [Fig. 3(a)] while larger values of indicate the onset of lattice melting [Fig. 3(b)] or thermal equilibrium which has not been reached.
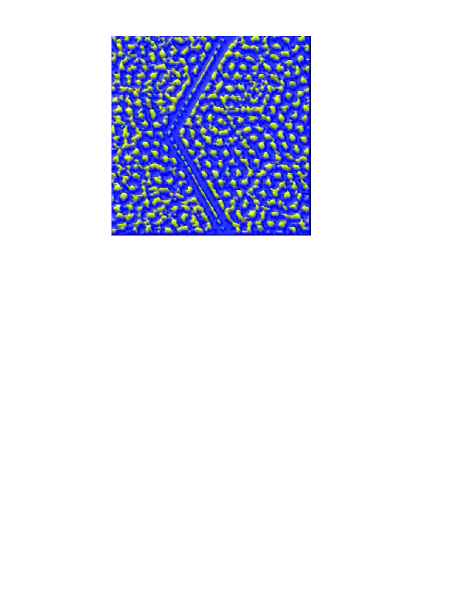
To model the adsorbate arrangement at step edges, the steps are taken into account as scatterers of the surface state. We considered a step edge as an infinitely long and linear chain of Ag atoms each of which gives rise to a surface state-mediated interaction with Cs adatoms according to Eq. (3). Integrating the contribution of each scatterer leads to the total interaction phy_00 ; phy_05
| (6) |
where denotes the distance to the step and the Ag(111) lattice constant. The parameters , , and are the same that we used for modeling the adlayer structure on terraces, while the choice of is in good agreement with the results obtained for Cu atoms adsorbed on Cu(111). jre_02 Figure 4 shows the density plot of for . Two kinds of step edges were included in the simulations, namely a step edge of the type (upper part of Fig. 4) and a step edge (lower part of Fig. 4). Deviating from our simulations of adsorbate structures on terraces we found that the surface state-mediated interaction according to Eq. (6) introduced an additional stabilization of the superlattice. The distribution function, , exhibits overlapping maxima along the step edge directions which is in agreement with Cs adatoms showing elongated rows close to step edges in STM images [Fig. 1(c)]. Additionally, maxima of become more localized again with larger distances from the step edge and reflect then the characteristic particle arrangement on terraces.
According to the Monte Carlo simulations we interpret the experimental observations as a consequence of an enhanced Cs adatom mobility at the low-coverage regime discussed in this section. We can identify the origin of the observed mobility as a property of coverages that match incommensurate adsorbate phases.
IV.2 Higher coverages:
A way to stabilize the adsorption lattice, i. e., to obtain a hexagonal superstructure with long-range order, is the increase of the coverage. Many structural analyses of alkali metal films adsorbed on metal surfaces have previously reported the transition from a disordered phase at very low coverage to well-ordered adsorbate structures at higher coverages (Ref. rdd_96, and references therein). An increased coverage leads to a smaller adatom-adatom distance and will therefore increase the dipole-dipole repulsion between the adatoms. As a consequence, the probability for a Cs atom to hop from one adsorption site to an adjacent one is lowered. Our experiment and calculations corroborate this picture.
Figure 5(a) shows an STM image of Ag(111) covered with of Cs. We observe a hexagonal adlayer with long-range order and a mutual adatom distance of . This adsorbate superstructure corresponds to a commensurate phase and has been reported before by low-energy electron diffraction. gle_96 The inset of Fig. 5(a) shows the atomically resolved Ag(111) lattice to indicate that the adlayer and substrate lattice exhibit the same orientation [see dashed line in Fig. 5(a)]. Regions indicating an enhanced mobility of adatoms are no longer present at this coverage. Given that the commensurate adsorbate phase is observed experimentally at a specific coverage, we performed simulations for an adatom lattice matching the substrate lattice. The superstructure similar to the one observed in the experiments was obtained as the ground state from canonical Monte Carlo calculations. The distribution function for this coverage was then calculated for a variety of time intervals. Even for extended intervals, e. g., , no enhancement of the diffusion processes was observed indicating that the increased dipole-dipole coupling stabilizes the hexagonal adsorption lattice.
The same behavior was observed at higher coverages. Figure 5(b) shows an STM image of Ag(111) covered with Cs. Again, no indication of enhanced diffusion of Cs adatoms was found. The Cs adatoms are arranged in an incommensurate hexagonal superlattice with a mutual distance of and rotated with respect to the Ag(111) lattice by . Moreover, at this coverage domains of hexagonally ordered Cs atoms were observed. Cesium atomic rows of adjacent domains are offset by half an adlayer lattice constant [see inset of Fig. 5(b)]. At the domain boundaries rows of irregulary shaped structures occur whose apparent height depends on the tunneling voltage. The formation of domains may be understood in terms of stress release at the domain boundaries. Similar observations of translational adsorbate domains have been reported for oxygen adsorption on W(110) kjo_93 and on Rh(111). sma_05
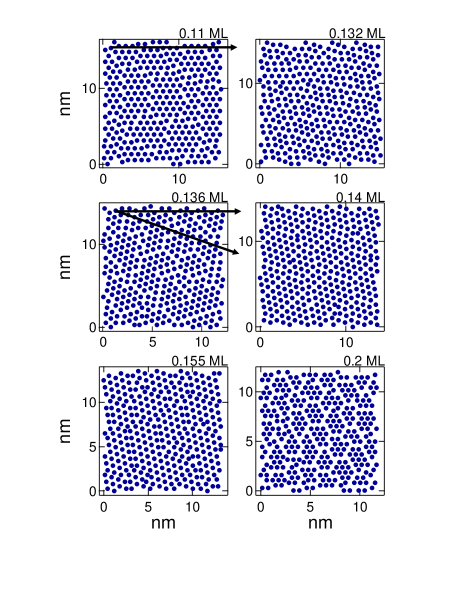
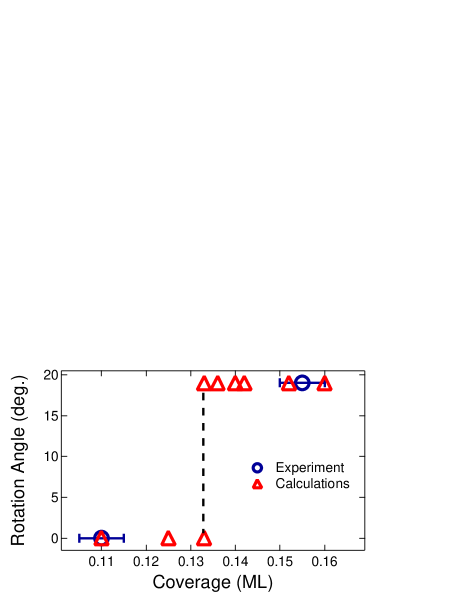
To model these observations within a kinetic Monte Carlo approach we simulated particle arrangements for coverages ranging between and (Fig. 6). After an interval of is elapsed the coordinates of particles with a coverage of are given by the upper left plot in Fig. 6. This coverage corresponds to the commensurate adsorption phase and we see that the superlattice aligns with the crystallographic direction of the substrate lattice (depicted as the horizontal arrow). With increasing coverage we observe that this alignment weakens. At some domains are still oriented along the substrate crystallographic direction while others enclose an angle of indicating that at commensurate and incommensurate phases coexist. This coexistence is in agreement with previous reports based on low-energy electron diffraction. gle_96 At all particle domains exhibit a rotation angle of . This angle is maintained until at the particle lattice is aligned with the substrate lattice again. In particular, the incommensurate phase observed experimentally at with a rotation angle of is well reproduced by our simulations. We summarize calculated and measured rotation angles as a function of the coverage in Fig. 7. We notice that our simulations reproduce the experimentally observed rotation angles for commensurate adsorbate phases. The continuous rotation of incommensurate phases reported for Ag(111)-Cs gle_96 and Cu(111)-Cs, tvh_06 however, is not concerned here.
Besides the rotation angle of commensurate superstructures the simulations indicate the origin for domain formation as observed experimentally at [Fig. 5(b)]. Increasing the particle density in the simulations to and thus being close to the commensurate phase leads to a particle arrangement where the domains have almost disappeared in favor of a nearly homogeneous particle film with long-range hexagonal order. At a particle coverage of the boundaries of adjacent domains overlap leading to an increase of the particle interaction at the boundaries. A further increase of the particle density to induces a decrease of the domain size and leads to a similar particle arrangement as observed for . As a result we obtain that particle coverages giving rise to incommensurate phases exhibit the propensity to form domains, while commensurate phases lead to homogeneous films.
V Summary
Cesium films adsorbed on Ag(111) with submonolayer coverage have been investigated by scanning tunneling microscopy. The resulting adsorbate arrangements are modeled by kinetic Monte Carlo simulations. At very low coverages, long-range hexagonal order of the superstructure does not exist while at higher coverages a stable and hexagonally ordered adsorbate lattice is observed. Modeling of the adsorbate arrangement at very low coverages demonstrates the importance of both dipole-dipole repulsion and surface state-mediated interaction between Cs adatoms. Long-range hexagonal order is inhibited if the coverage matches an incommensurate adsorption phase or a disorder-to-order transition. At higher coverages, the dipole-dipole repulsion between the Cs adatoms becomes large enough to stabilize hexagonal superlattices. While commensurate adsorption phases are characterized by a homogeneous adsorbate films, incommensurate phases exhibit domain-like patterns. The experimentally observed rotation of commensurate adsorbate lattices is modeled by our calculations.
Acknowledgements
We acknowledge funding by the Deutsche Forschungsgemeinschaft through SFB-TR 24 and SFB 668.
References
- (1) R. D. Diehl and R. McGrath, Surf. Sci. Rep. 23, 43 (1996).
- (2) H. P. Bonzel, A. M. Bradshaw, and G. Ertl (Eds.), Physics and chemistry of alkali metal adsorption (Elsevier, Amsterdam, 1989).
- (3) R. B. Grant and R. M. Lambert, Langmuir 1, 29 (1985).
- (4) C. T. Campbell, J. Phys. Chem. 89, 5789 (1985).
- (5) G. M. Lamble, R. S. Brookes, D. A. King, and D. Norman, Phys. Rev. Lett. 61, 1112 (1988).
- (6) G. S. Leatherman and R. D. Diehl, Phys. Rev. B53, 4939 (1996).
- (7) S. Å. Lindgren, L. Walldén, J. Rundgren, P. Westrin, and J. Neve, Phys. Rev. B28, 6707 (1983).
- (8) W. C. Fan and A. Ignatiev, Phys. Rev. B37, 5274 (1988).
- (9) Z. Y. Li, K. M. Hock, and R. E. Palmer, Phys. Rev. Lett. 67, 1562 (1991).
- (10) Th. von Hofe, J. Kröger, and R. Berndt, Phys. Rev. B73, 245434 (2006).
- (11) S.-Å. Lindgren and L. Walldén, Phys. Rev. B38, 3060 (1988).
- (12) N. Fischer, S. Schuppler, R. Fischer, Th. Fauster, and W. Steinmann, Phys. Rev. B47, 4705 (1993).
- (13) Th. Fauster and W. Steinmann, in Electromagnetic Waves: Recent Developments in Research, edited by P. Halevi, Photonic Probes of Surfaces Vol. 2 (Elsevier, Amsterdam, 1995).
- (14) A. Carlsson, B. Hellsing, S.-Å. Lindgren, and L. Walldén, Phys. Rev. B56 1593 (1997).
- (15) M. Bauer, S. Pawlik, and M. Aeschlimann, Phys. Rev. B55, 10040 (1997).
- (16) S. Ogawa, H. Nagano, and H. Petek, Phys. Rev. Lett. 82, 1931 (1999).
- (17) B. Hellsing, J. Carlsson, L. Walldén, and S.-Å. Lindgren, Phys. Rev. B61, 2343 (2000).
- (18) T.-C. Chiang, Surf. Sci. Rep. 39, 181 (2000).
- (19) M. Milun, P. Pervan, and D. P. Woodruff, Rep. Prog. Phys. 65, 99 (2001).
- (20) J. Kliewer and R. Berndt, Phys. Rev. B65, 035412 (2002).
- (21) A. K. Kazansky, A. G. Borisov, and J. P. Gauyacq, Surf. Sci. 577, 47 (2005).
- (22) C. Corriol, V. M. Silkin, D. Sánchez-Portal, A. Arnau, E. V. Chulkov, P. M. Echenique, T. von Hofe, J. Kliewer, J. Kröger, and R. Berndt, Phys. Rev. Lett. 95, 176802 (2005).
- (23) J. Kröger, L. Limot, H. Jensen, R. Berndt, S. Crampin, and E. Pehlke, Prog. Surf. Sci. 80, 26 (2005).
- (24) J. Koutecký, Trans. Faraday Soc. 54, 1038 (1958).
- (25) T. B. Grimley, Proc. Phys. Soc. (London) 90, 751 (1967).
- (26) D. N. Newns, Phys. Rev. 178, 1123 (1969).
- (27) T. L. Einstein and J. R. Schrieffer, Phys. Rev. B7, 3629 (1973).
- (28) T. T. Tsong, Phys. Rev. Lett. 31, 1207 (1973).
- (29) K. H. Lau and W. Kohn, Surf. Sci. 75, 69 (1978).
- (30) H. Brune, J. Wintterlin, G. Ertl, and R. J. Behm, Europhys. Lett. 13, 123 (1990).
- (31) M. M. Kamna, S. J. Stranick, and P. S. Weiss, Science 274, 118 (1996).
- (32) E. Wahlström, I. Ekvall, H. Olin, and L. Walldén, Appl. Phys. A 66, S1107 (1998).
- (33) J. Repp, F. Moresco, G. Meyer, K.-H. Rieder, P. Hyldgaard, and M. Persson, Phys. Rev. Lett. 85, 2981 (2000).
- (34) N. Knorr, H. Brune, M. Epple, A. Hirstein, M. A. Schneider, and K. Kern, Phys. Rev. B65, 115420 (2002).
- (35) F. Silly, M. Pivetta, M. Ternes, F. Patthey, J. P. Pelz, and W.-D. Schneider, Phys. Rev. Lett. 92, 016101 (2004).
- (36) N. N. Negulyaev, V. S. Stepanyuk, L. Niebergall, W. Hergert, H. Fangohr, and P. Bruno, Phys. Rev. B74, 035421 (2006).
- (37) V. S. Stepanyuk, N. N. Negulyaev, L. Niebergall, R. C. Longo, and P. Bruno, Phys. Rev. Lett. 97, 186403 (2006).
- (38) SAES Getters SpA, Viale Italia 77, 20020 Lainate, Italy (http://www.saesgetters.com).
- (39) D. R. Cox and H. D. Miller, The Theory of Stochastic Processes (Methuen, London, 1965).
- (40) W. M. Young and E. W. Elcock, Proc. Phys. Soc. 89, 735 (1966).
- (41) K. A. Fichthorn and W. H. Weinberg, J. Chem. Phys. 95, 1090 (1991).
- (42) K. A. Fichthorn and M. Scheffler, Phys. Rev. Lett. 84, 5371 (2000).
- (43) P. Hyldgaard and M. Persson, J. Phys. Condens. Matter 12, L13 (2000).
- (44) H. P. Bonzel, Surf. Sci. Rep. 8, 43 (1987).
- (45) S.-Å. Lindgren and L. Walldén, Phys. Rev. B22, 5967 (1980).
- (46) J. Kröger, D. Bruchmann, S. Lehwald, and H. Ibach, Surf. Sci. 449, 227 (2000).
- (47) L. D. Schmidt and R. Gomer, J. Chem. Phys. 45, 1605 (1966).
- (48) M. Breitholz, V. Chis, B. Hellsing, S.-Å. Lindgren, and L. Walldén, Phys. Rev. B75, 155403 (2007).
- (49) A. Chatterjee and D. G. Vlachos, J. Computer-Aided Mater. Des. 14, 253 (2007).
- (50) G. Voronoï, J. Reine Angew. Math. 133, 97 (1907).
- (51) P. Ludwig, S. Kosse, and M. Bonitz, Phys. Rev. E71, 046403 (2005).
- (52) P. Hyldgaard and T. L. Einstein, J. Cryst. Growth 275, e1637 (2005).
- (53) J. Repp, PhD Thesis (Berlin, 2002).
- (54) K. E. Johnson, R. J. Wilson, and S. Chiang, Phys. Rev. Lett. 71, 1055 (1993).
- (55) S. Marchini, C. Sachs, and J. Wintterlin, Surf. Sci. 592, 58 (2005).