11email: B. Stelzer, stelzer@astropa.unipa.it 22institutetext: Hamburger Sternwarte, Gojenbergsweg 112, D-21029 Hamburg, Germany 33institutetext: Laboratoire d’Astrophysique, Observatoire de Grenoble, Université Joseph Fourier, B.P. 53, F-38041 Grenoble Cedex 9, France
Further X-ray detections of Herbig stars
Abstract
Context. The interpretation of X-ray detections from Herbig Ae/Be stars is disputed as it is not clear if these intermediate-mass pre-main sequence stars are able to drive a dynamo and ensuing phenomena of magnetic activity. Alternative X-ray production mechanisms, related to stellar winds, star-disk magnetospheres, or unresolved late-type T Tauri star companions have been proposed.
Aims. The companion hypothesis can be tested by resolving Herbig stars in X-rays from their known visual secondaries. Furthermore, their global X-ray properties (such as detection rate, luminosity, temperature, variability), may give clues to the emission mechanism by comparison to other types of stars, e.g. similar-age but lower-mass T Tauri stars, similar-mass but more evolved main-sequence A- and B-type stars, and with respect to model predictions.
Methods. In a series of papers we have been investigating high-resolution X-ray Chandra images of Herbig Ae/Be and main-sequence B-type stars where known close visual companions are spatially separated from the primaries.
Results. Here we report on six as yet unpublished Chandra exposures from our X-ray survey of Herbig stars. The target list comprises six Herbig stars with known cool companions, and three further A/B-type stars that are serendipitously in the Chandra field-of-view. In this sample we record a detection rate of %, i.e. all A/B-type stars display X-ray emission at levels of . The analysis of hardness ratios confirms that HAeBe’s have hotter and/or more absorbed X-ray emitting plasma than more evolved B-type stars.
Conclusions. Radiative winds are ruled out as exclusive emission mechanism on basis of the high X-ray temperatures. Confirming earlier results, the X-ray properties of Herbig Ae/Be stars are not vastly different from those of their late-type companion stars (if such are known). The diagnostics provided by the presently available data leave open if the hard X-ray emission of Herbig stars is due to young age or indicative of further coronally active low-mass companion stars. In the latter case, our detection statistics imply a high fraction of higher-order multiple systems among Herbig stars.
Key Words.:
X-rays: stars – stars: early-type, pre-main sequence, activity, binaries1 Introduction
Theoretical considerations distinguish two major X-ray emission mechanisms for stars: Hot stars have strong winds in which shocks heat the plasma to a few K, giving rise to soft X-ray emission. Cool stars have dynamo-generated magnetic fields that, under the influence of convection, provide a heating agent for the outer atmospheres, resulting in harder ( MK) X-ray emission.
For stars on the main-sequence (MS), there is a critical zone in between these two regimes at spectral types mid-B and mid-A, in which stars have neither strong winds nor convective envelopes, and thus are expected to be no X-ray emitters. Nevertheless, X-ray detections of A- and B-type stars have been reported in several works; see in particular catalogs based on the spatially complete ROSAT All-Sky Survey (Berghöfer et al., 1996; Hünsch et al., 1998). In absence of a physical explanation, the X-ray emission of these stars is generally attributed to unknown, unresolved late-type companions. Stelzer et al. (2003) and Stelzer et al. (2006a) have checked the companion hypothesis by resolving a sample of MS B-type stars with Chandra from their close visual companions. The result was ambiguous, because more than half of the B-type stars were detected with Chandra even after being resolved from all known visual companions. However, the X-ray sources associated with the B-type stars do not show significantly different properties from those coincident with their cooler companion stars. This is fully consistent with the idea that the X-rays originate from even closer spectroscopic companions.
The case is more complex for intermediate-mass stars on the pre-main sequence (pre-MS), the so-called Herbig Ae/Be stars. The relatively low-sensitivity instruments onboard ROSAT and ASCA achieved detection fractions between % (Zinnecker & Preibisch, 1994; Hamaguchi et al., 2005). Contrary to MS A- and B-type stars, HAeBe stars are surrounded by circumstellar material in the form of disks and envelopes, remnants of the star forming process. Lately, it was recognized that magnetic coupling between star and accretion disk leads to important modifications of the X-ray properties of low-mass pre-MS stars: X-ray emission seems to be suppressed in accreting T Tauri stars (Preibisch et al., 2005; Telleschi et al., 2007a), magnetic reconnection of the star-disk field has been held responsible for flares (Favata et al., 2005), and an excess of soft X-rays in some objects was ascribed to emission from either accretion shocks (Kastner et al., 2002; Stelzer & Schmitt, 2004) or to shocks in outflows (Güdel et al., 2007). These mechanisms could play a role also in HAeBe stars that are still in their accretion phase. Indeed, unusually soft X-ray emission was observed for HD 163296 and ascribed to emission from an accretion shock similar to the case of the lower-mass T Tauri stars (Swartz et al., 2005). A possible link between X-ray activity of HAeBe stars and the presence of outflows, typical for stars in the accretion phase, was suggested by Hamaguchi et al. (2005). Indications for the decline of the X-ray luminosity with age in a sample of HAeBe stars observed with ASCA have been interpreted in terms of star-disk magnetic interactions, similar as proposed for protostars (Hamaguchi et al., 2005). Last but not least, X-ray flares from HAeBe stars were observed with ASCA and XMM-Newton (Hamaguchi et al., 2000; Giardino et al., 2004), but the association with the HAeBe stars was not unambiguous.
HAeBe stars are progenitors of MS A- and B-type stars. Since a fraction of % of intermediate-mass stars on the MS is magnetic, the Ap/Bp stars, a similar or higher fraction of HAeBe stars is expected to harbor magnetic fields as remnants from the star forming process. While initial attempts to measure those fields remained unsuccessful, with the advent of new spectropolarimetric instrumentation magnetic field detections of HAeBe stars are starting to accumulate. At present fields have been positively measured for eight HAeBe stars, corresponding to a fraction of % of the samples studied, in accordance with extrapolations of the magnetic field incidence of MS stars. In addition, and in contrast to the A- and B-type stars on the MS, HAeBe stars may also possess a shear dynamo that is supplied by the rotational energy of the star, and was shown to sustain magnetic fields in the initial phase (a few Myrs) of the life of an intermediate-mass star (Tout & Pringle, 1995). However, from the position on fully radiative evolutionary tracks of the HAeBe stars with field detections and the large-scale ordered structure of their fields Alecian et al. (2008) conclude that these fields are primordial rather than dynamo generated. The efficiency of such global fields in generating X-rays is unclear.
Another possible mechanism for X-ray production in HAeBe stars regards a picture in which magnetic fields influence the wind geometry and dynamics by channeling the wind. This scenario, referred to as magnetically confined wind shock (MCWS) model, was originally developed to explain the X-ray emission from the Ap star IQ Aur Babel & Montmerle (1997b). It was also successfully applied to the O-type star Ori C (Babel & Montmerle, 1997a; Gagné et al., 2005) and it could be the cause for the strong and variable X-ray emission of some hot stars in Orion (Stelzer et al., 2005). Its application to HAeBe stars depends on whether wind velocities and X-ray temperatures can be reconciled. This seems to be dubious due to the generally slow HAeBe winds ( km/s) and high X-ray temperatures ( keV) measured e.g. by Skinner et al. (2004) and by Stelzer et al. (2006b). Nevertheless, a MCWS is considered to be the most likely explanation for the X-ray emission from the HAeBe star AB Aur (Telleschi et al., 2007b). AB Aur is the first HAeBe star for which a high-resolution X-ray spectrum was obtained. Its excess of soft emission, diagnosed by the high O VII line flux, is similar to that of cTTS (Güdel & Telleschi, 2007) but, contrary to those latter ones, not accompanied by high densities. Analysis of the He-like triplets indicates that the X-rays from AB Aur originate at a substantial distance from the stellar surface in the wind region. A direct relation between the X-ray source and the wind of AB Aur is also supported by the variability of the X-ray lightcurve which was observed to be periodic with the same time-scale found in UV lines formed in the wind.
Despite the abundant speculations about the possible mechanism, a convincing and unique explanation for the X-ray emission of HAeBe stars has not been identified. Similar to the B- and A-type stars on the MS, T Tauri like companions could be the cause for the observed X-ray emission from HAeBe stars. The high X-ray luminosities of many HAeBe stars (), have often been cited against the companion hypothesis, but Skinner et al. (2004) showed that their range of X-ray luminosities is compatible with the typical emission level of a late-type pre-MS star. The binary fraction of HAeBe stars has been examined in high angular resolution studies (Leinert et al., 1997; Pirzkal et al., 1997), and resulted in an excess of binaries with respect to MS stars. The brightness ratios of the HAeBe binaries suggests that most companions are of significantly lower mass than the primaries, i.e. they are T Tauri stars, and must be strong X-ray emitters by their nature.
Chandra is the only satellite that provides a sub-arcsecond spatial resolution in X-rays, which is reasonably close to infrared (IR) imaging (adaptive optics) observations. This implies that the majority of known visual companions, those at separations larger than , can be resolved for the first time in X-rays. Here we extend our previous archival Chandra study on HAeBe stars with the aim to investigate the possibility that the X-ray emission arises from known T Tauri star companions. In Sect. 2 we introduce the new targets observed with Chandra. The near-IR imaging survey from which the Chandra sample was selected is described in Sect. 3. The X-ray observations and the data analysis are presented in Sect. 4, and results are given in Sect. 5. In Sect. 6 we discuss the new detections in the context of previous results, and Sect. 7 contains concluding remarks. Information on individual stars is found in the Appendix A.
2 The Sample
We based our target selection on the catalog of HAeBe stars and candidates by Thè et al. (1994), and searched the literature for reports on close binaries among them. In addition we use the results of a recent high spatial resolution imaging survey for binaries among HAeBe stars that identified faint IR sources with separations in the range near HAeBe stars (see Sect. 3). From this analysis it results that stars of Table 1 from Thè et al. (1994) have close companions identified in IR adaptive optics images that are resolvable with Chandra (separation ).
Chandra observations for four of these have already been presented (V892 Tau, HD 141569, MWC 863, and V380 Ori; see discussion by Stelzer et al. (2006b)). We selected another five stars from the remaining list of for having well-constrained optical parameters, no evidence for being spectroscopic binaries (SBs), and yielding a good constraint on the X-ray emission (i.e. high bolometric luminosity or small distance). One of the Chandra fields comprises three Be stars (Obs-ID 6399). This observation pointed towards the NGC 7129 reflection nebula that is illuminated by three early B-type stars: the original target for our Chandra study, V373 Cep (alias LkH 234), the Herbig Be star BD+65 1637 (also in the HAeBe star list of Thè et al., 1994) and BD+65 1638. BD+65 1637 was observed within the IR imaging survey described in Sect. 3 but no companion was detected. BD+65 1638 is also not known to be binary. We include these two stars in our sample to enhance the data base for X-ray observations of intermediate-mass stars.
We add to this sample a recent Chandra observation of HR 5999, that fullfills our selection criteria: HR 5999 is a HAeBe star with a close visual T Tauri companion resolvable with Chandra (Stecklum et al., 1995). Possible indications for a closer ( AU) low-mass companion were reported from extensive radial velocity monitoring (Tjin A Djie et al., 1989). Another A-type star in the Chandra field, HR 6000, shares common proper motion with HR 5999 from which it is separated by . HR 6000 is a chemically peculiar star and not known to have companion stars. It adds to the existing data base of X-ray emission from A-type stars.
The stellar parameters for the new Chandra sample are given in Table 1. This sample spans a range of about dex in bolometric luminosity and from K in effective temperature, as illustrated in Fig. 1 which represents the HR diagram for our targets on the evolutionary models by Palla & Stahler (1999).

| The No. | Name | Other Name | SB? | VB ? | SpT | d | Ref | |||
| [pc] | [K] | [mag] | ||||||||
| 42 | MWC147 | HD259431 | N | Y | B6 | (1,2,3,4,5,5,5) | ||||
| 69 | Hen3-1141 | HD144432 | N | Y | A7 | (1,6,7,8,4,4,4) | ||||
| 70 | HR 5999 | HD144668 | Y? | Y | A7 | (9,2,10,11,4,4,4) | ||||
| 79 | AS310 | Y | B0 | (-,12,7,7,5,5,5) | ||||||
| 98 | BD+65 1637 | V361 Cep | B3 | (-,-,13,14,5,5,5) | ||||||
| 99 | V373Cep | LkHa234 | Y | B5/7 | (-,15,15,7,5,5,5) | |||||
| 100 | AS477 | BD+46 3471 | N | Y | A0 | (1,16,7,7,5,5,5) | ||||
| BD+65 1638 | B2 | (-,-,13,14,-,-,-) | ||||||||
| HR 6000 | HD144667 | A1.5 | (-,-,17,11,17,17,17) | |||||||
| (1) - Corporon & Lagrange (1999), (2) - Thomas et al., in prep., (3) - Mottram et al. (2007), (4) - van den Ancker et al. (1998), | ||||||||||
| (5) - Hernández et al. (2004), (6) - Dommanget & Nys (1994), (7) - Maheswar et al. (2002), (8) - Pérez et al. (2004), (9) - Tjin A Djie et al. (1989), | ||||||||||
| (10) - Stecklum et al. (1995), (11) - Hughes et al. (1993), (12) - Ageorges et al. (1997), (13) - Wang & Looney (2007), | ||||||||||
| (14) - Hillenbrand et al. (1992), (15) - Leinert et al. (1997), (16) - Pirzkal et al. (1997), (17) - Garcia Lopez et al. (2006). | ||||||||||
3 High-resolution near-IR imaging
Near-IR imaging for the Chandra sample presented in Sect. 2 had been performed between 1993 and 1996 as part of a high angular resolution survey of visual binaries among HAeBe stars (Bouvier & Corporon, 2001). MWC 147, Hen 3-1141 and HR 5999 were observed with the ADONIS adaptive optics (AO) system at ESO (Beuzit et al., 1997) equipped with the SHARP IR camera (Hofmann et al., 1995). AS 310, V373 Cep, BD+65 1637 and AS 477 were observed with the PUE’O AO system at CFHT (Rigaut et al., 1998) equipped with the Monica IR camera (Nadeau et al., 1994). Both systems deliver nearly diffraction-limited images at with a FWHM of 0.1 and a pixel sampling of at CFHT and at ESO.
Exposure times ranged typically between and s in each filter. To produce the final images, individual exposures were first dark and flat corrected, then registered to subpixel accuracy and eventually added. Astrometric standards from van Dessel & Sinachopoulos (1993) were observed during each near-IR run in order to derive the detector’s orientation and plate scale. The accuracy of the astrometric calibration is typically of order of a fraction of a degree for the position angle and of less than arcsec per pixel for the plate scale.
Results from this AO survey will be published by Thomas et al., in prep. We anticipate here the detection of faint companions to our Chandra sample. The list of Chandra targets with all known visual companions is summarized in Table 2. All binary separations and position angles reported in Table 2 were measured on the near-IR images. Aperture and/or PSF photometry was performed on the resolved multiple systems to measure flux ratios between the components. The photometric accuracy is of typically mag at near-IR wavelengths.
The measured flux ratios for the newly identified companions are large indicating that those objects have much lower mass than the primary Herbig stars if they form coeval systems. Thus they are probably T Tauri stars and it is plausible to expect strong X-ray emission from them.
| Primaries | Companions | ACIS observations | ||||||||
| Designation | Position | Sep | PA | Component | ObsID | Expo | Astrometric correction(d) | |||
| [′′] | [∘] | [mag] | [s] | [′′] | [′′] | |||||
| MWC147 | 06:33:05.19 | 10:19:20.0 | 3.11 | 344.4 | B | 6397 | 9342.6 | |||
| Hen 3-1141 | 16:06:57.96 | 27:43:09.8 | 1.45 | 3.0 | B | 6398 | 12789.6 | |||
| AS 310 | 18:33:21.21 | 04:58:06.7 | 1.31 | 78.3 | B | 6399 | 38198.1 | |||
| 2.22 | 240.5 | C | ||||||||
| 3.74 | 233.4 | D | ||||||||
| 4.34 | 122.0 | E | ||||||||
| 4.88 | 0.9 | F | ||||||||
| 5.00 | 6.1 | G | ||||||||
| V373 Cep | 21:43:06.68 | 66:06:54.6 | 1.87 | 96.6 | B | 6400 | 22662.9 | |||
| BD+65 1637 | 21:42:50.21 | :06:32.2 | ||||||||
| BD+65 1638 | 21:42:58.80 | :06:10.0 | ||||||||
| AS 477 | 21:52:34.10 | 47:13:43.6 | 1.31 | 308.7 | B | 6401 | 26571.2 | |||
| 4.67 | 40.0 | C | ||||||||
| 5.82 | 205.7 | D | ||||||||
| 6.01 | 199.9 | E | ||||||||
| HR 5999 | 16:08:34.29 | 39:06:18.3 | 1.46 | 109.7 | B | 8901 | 9899.3 | |||
| HR 6000 | 16:08:34.56 | 39:05:34.3 | ||||||||
| (d) - No boresight correction could be performed for Obs-ID 6398 because of the absence of any 2 MASS identification in the Chandra image. | ||||||||||
4 X-ray observations and data analysis
All observations were performed with Chandra’s ACIS-S array
with the exception of Obs-ID 8901 (HR 5999) that was carried out with ACIS-I.
The data analysis was performed with the CIAO software
package111CIAO is made available by the CXC and can be downloaded
from
http://cxc.harvard.edu/ciao/download/ version 3.4.
We started our analysis with the level 1 events file provided by the
Chandra X-ray Center (CXC).
Correction for the charge transfer inefficiency (CTI) had been applied during
standard pipeline processing at the CXC.
In the process of converting the level 1 events file to a level 2 events file
for each of the observations we performed the following steps:
We removed the pixel randomization which is automatically applied by the CXC pipeline
in order to optimize the spatial resolution.
We filtered the events file for event grades
(retaining the standard grades , , , , and ),
and applied the standard good time interval file.
Events flagged as cosmic rays were not removed in our analysis. In principle, such events
can lead to the detection of spurious sources. However, if identified on the position of a
bright X-ray source, the flag is often erroneous (as a result of the event pattern used for
the identification of cosmic rays).
For our science goal of detecting and separating the HAeBe stars and their close companions, source detection was restricted to a pixels wide image (1 pixel ) centered on the position of each of the nine primary stars. Source detection was carried out with the wavdetect algorithm (Freeman et al., 2002). This algorithm correlates the data with a mexican hat function to search for deviations from the background. The wavdetect mechanism is well suited for separating closely spaced point sources. We used wavelet scales between and in steps of . Generally, the detection significance was set to to avoid spurious detections. This threshold was lowered to for the stars with the closest companions, Hen 3-1141, AS 477, and HR 5999.
To ensure high accuracy of the X-ray positions the X-ray data were cross-correlated with 2 MASS point sources. To this end, source detection was performed on a more coarsely binned (/pixel) and larger () image. This area comprises the whole primary chip, and some part of the adjacent ACIS chips if they were turned on. For each field the positions of all detected X-ray sources were cross-correlated with the 2 MASS Point Source Catalog (Cutri et al., 2003). Subsequently, the X-ray coordinates were shifted by the detected offsets that are summarized in the last two columns of Table 2. In Obs-ID 6399, after the small boresight correction, the SIMBAD position of the primary AS 310 is south of an X-ray source that coincides with the brightest 2 MASS object in the field. The colors of this object are consistent with an early-type star. A chance coincidence of another near-IR and X-ray bright object ( mag) so close to AS 310, while the star itself remains undetected both in 2 MASS and in the Chandra image, seems rather unlikely. Therefore, we assume that the 2 MASS object represents AS 310, and we computed the positions of its companion candidates with respect to the 2 MASS position.
| Designation | Opt/IR | X-ray Iden. | Offax | S/N | Counts∗ | HR 1 | HR 2 | PSF frac. | ||||
| [′] | [′′] | [%] | [erg/s] | |||||||||
| MWC 147 | A | |||||||||||
| MWC 147 | B | … | ||||||||||
| HEN 3-1141 | A | |||||||||||
| HEN 3-1141 | B | … | ||||||||||
| AS 310 | A | |||||||||||
| AS 310 | B | … | ||||||||||
| AS 310 | C | … | ||||||||||
| AS 310 | D | … | ||||||||||
| AS 310 | E | … | ||||||||||
| AS 310 | F | … | ||||||||||
| AS 310 | G | … | ||||||||||
| V373 CEP | A | |||||||||||
| V373 CEP | B | … | ||||||||||
| BD65 1637 | A | |||||||||||
| BD65 1638 | A | |||||||||||
| BD65 1638 | B | … | ||||||||||
| AS 477 | A | |||||||||||
| AS 477 | B | … | ||||||||||
| AS 477 | C | … | ||||||||||
| AS 477 | D | … | ||||||||||
| AS 477 | E | … | ||||||||||
| HR 5999 | A | |||||||||||
| HR 5999 | B | … | ||||||||||
| HR 6000 | A | |||||||||||
| ∗ in the keV passband; | ||||||||||||
| refers to the distance given in Table 1 and has been corrected for the PSF fraction of counts in the extraction radius given in col. 10. | ||||||||||||
| Periodic variability is due to the satellite dithering. | ||||||||||||
5 Results
Fig. 2 shows the ACIS images centered on the primary stars. The photon extraction areas of all detected X-ray sources are overplotted (circles), as well as the position of the primary and the position of the companions (x-shaped symbols). The separation to each X-ray source detected in this image is measured for the optical/IR positions of the primary (HAeBe) stars and all known visual components. When more than one of the optical components are identified with the same X-ray source the X-ray detection is attributed to the closest one. In practice, this is relevant for cases where not all components are X-ray detected; see Fig. 2 (AS310, V373Cep).
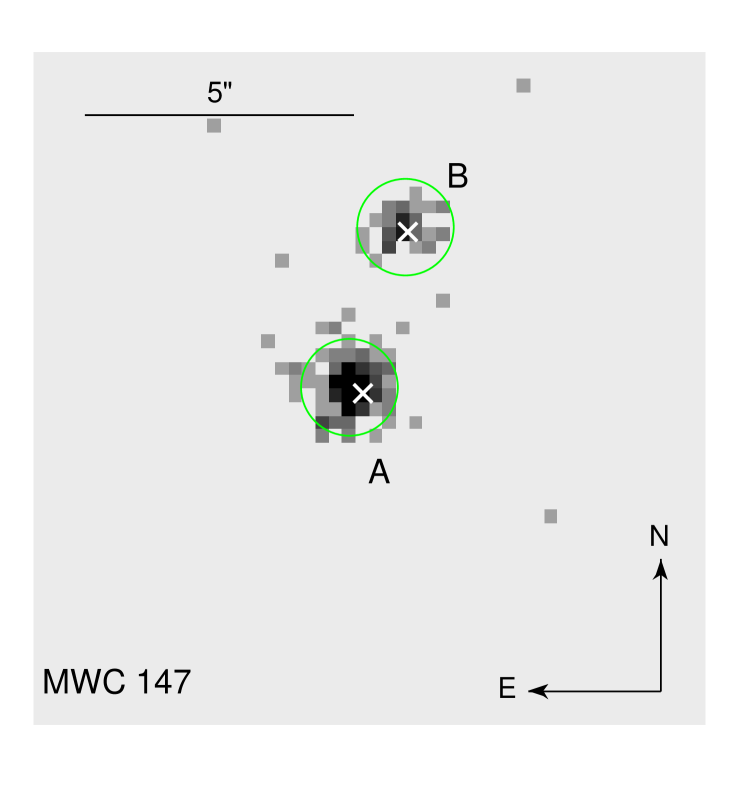
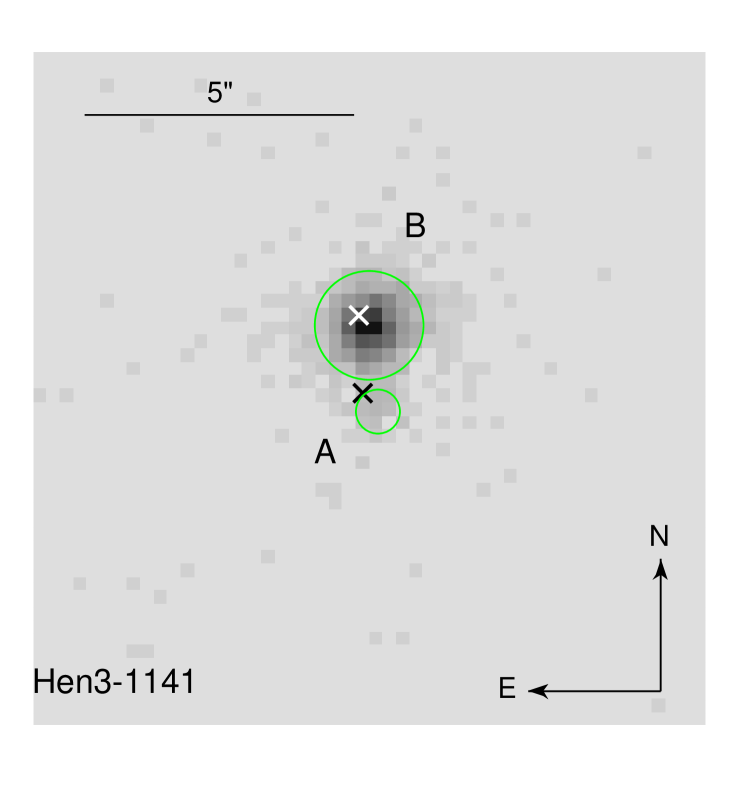
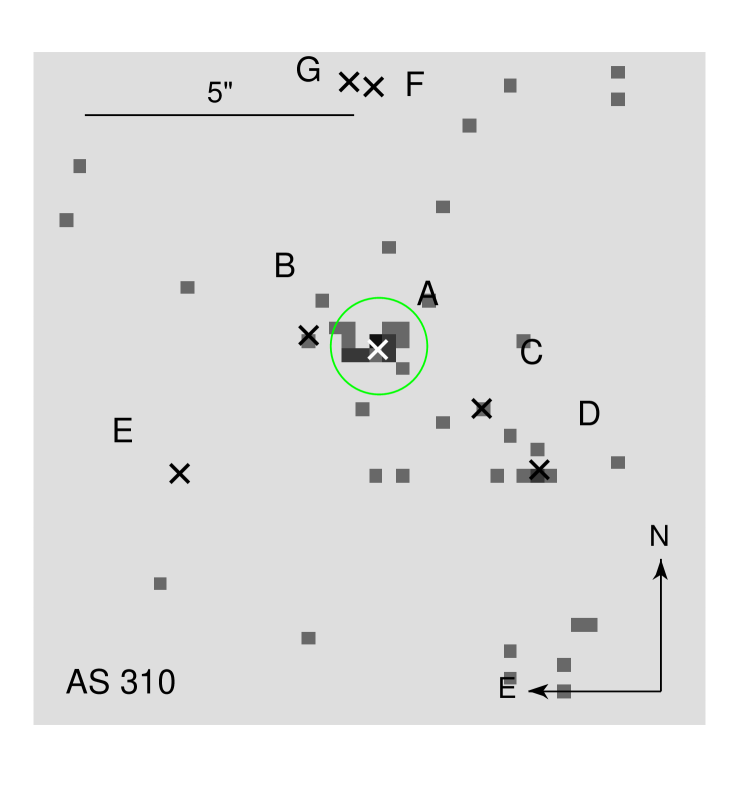
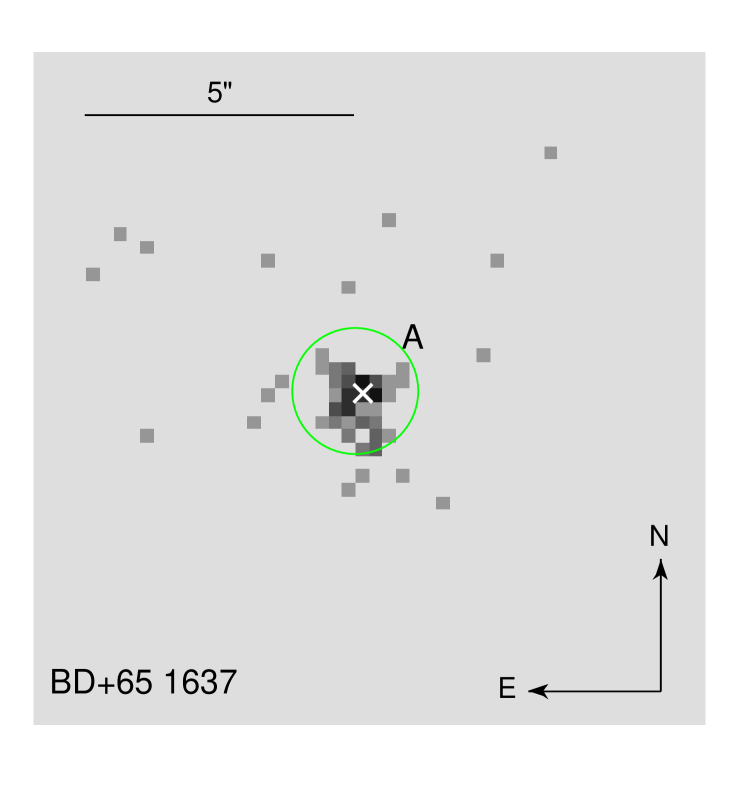
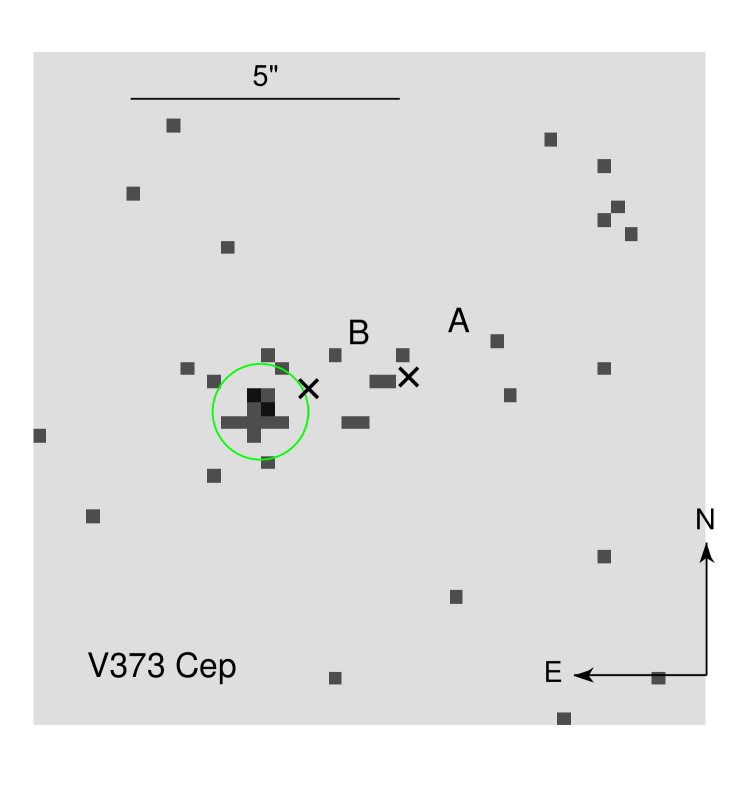
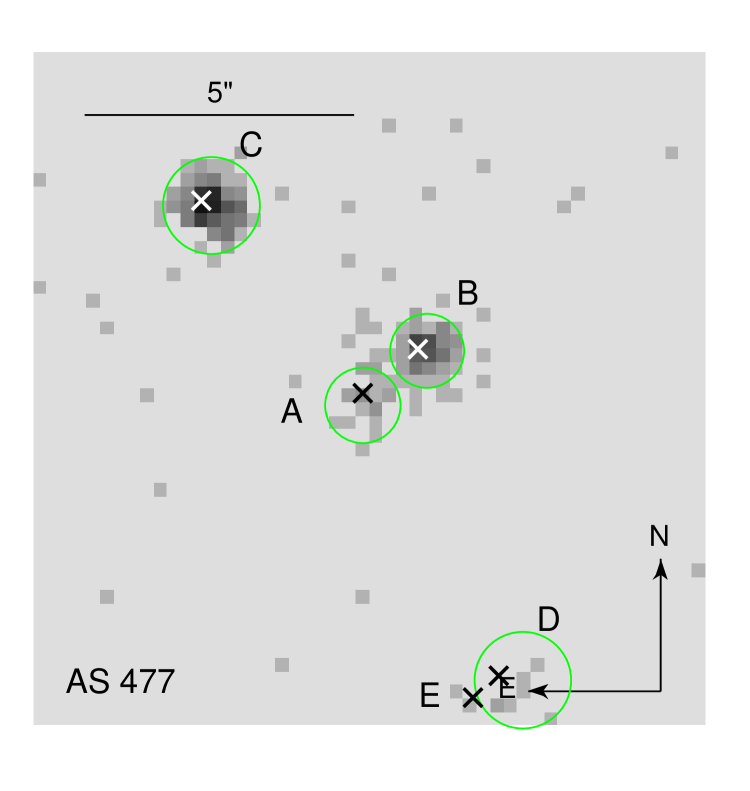
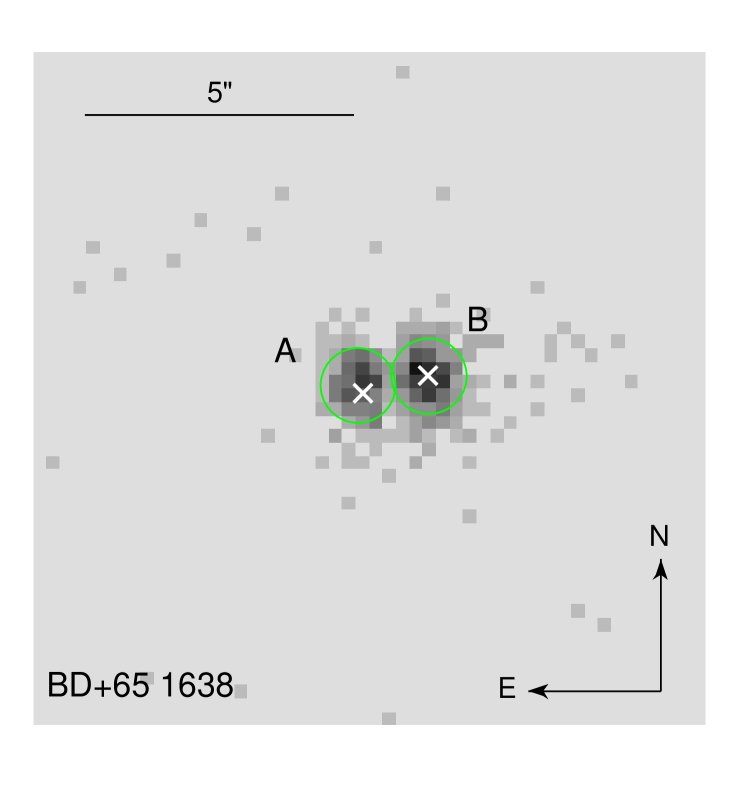
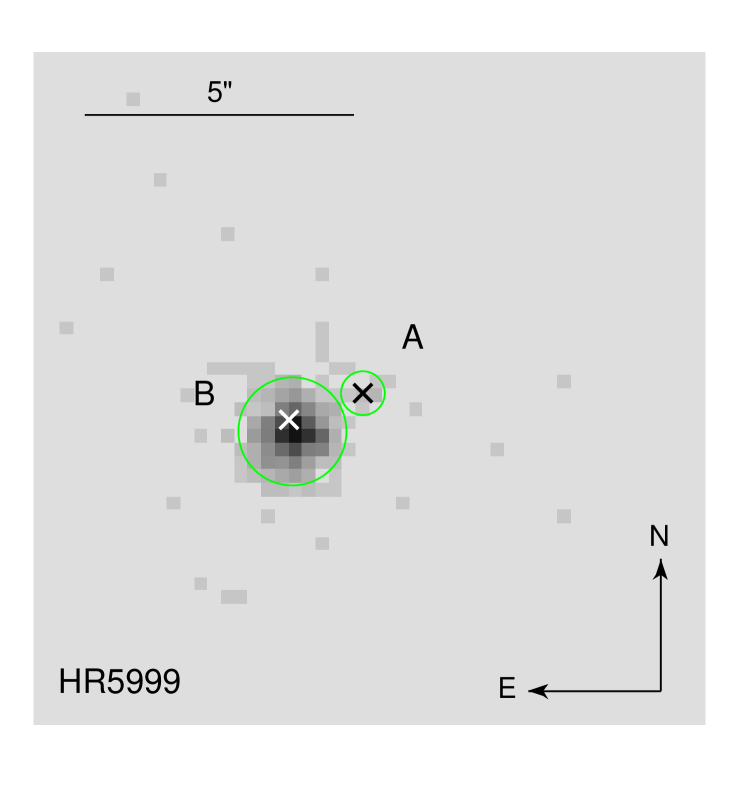
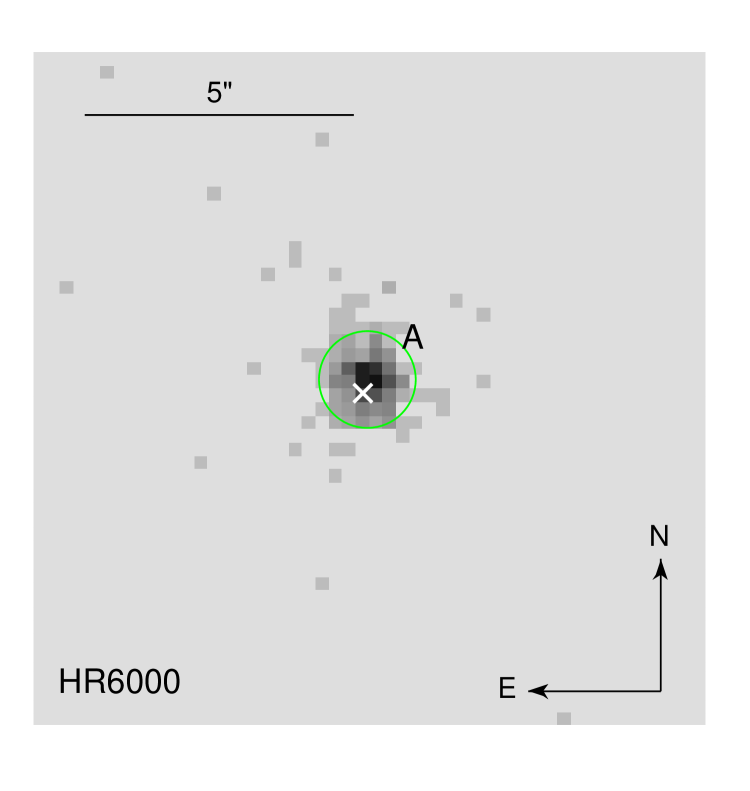
Table 3 summarizes the identification of all X-ray sources with components of our target systems and their X-ray parameters. Cols. 1-5 give the designation of the target, component identifier, a flag for X-ray detections, offaxis angle, and offset between X-ray and optical/IR position. Since very faint sources may escape the automatic detection procedure described in Sect. 4, we analysed the images independent of the wavdetect results. Counts are extracted from a circular area centered on the optical/IR position of each visual component with photon extraction radius corresponding to % of the point-spread-function (PSF). For sources which are not fully separated smaller non-overlapping radii were chosen (see col. 10 of Table 3). We restrict the analysis to the keV energy band. The background is measured in a squared area of side length centered on the optical/IR position of the respective star but excluding all detected sources. After scaling to the source extraction area this background is negligibly small in the chosen spectral range for all images ( cts). The irrelevant influence of the background is also obvious from a look at the images in Fig. 2. The number of net source counts () in the keV passband is given in column 7. Errors were computed with the Gehrels approximation for Poisson distributed data (Gehrels, 1986). Col. 6 represents the signal-to-noise ratio. Furtheron, we consider all stars with detected. To compute upper limits for the undetected components of our target systems we used the method for Poisson-distributed counting data described by Kraft et al. (1991).
Columns and of Table 3 show hardness ratios defined as , where and are the number of counts in a hard band and in a soft band, respectively. is defined for the keV () and the keV () bands, and for the keV () and the keV () bands. Hardness ratios are evaluated only for those stars recovered in the automatic source detection procedure. The remaining ones all have less than photons in total and are unsuitable for a more detailed analysis.
In col. the PSF- and absorption-corrected X-ray luminosity in the keV band is given. The X-ray luminosities were computed with PIMMS222The Portable Interactive Multi-Mission Simulator (PIMMS) is accessible at http://asc.harvard.edu/toolkit/pimms.jsp assuming an iso-thermal emitting plasma with keV and an absorbing column density corresponding to the value derived from according to the extinction law of Ryter (1996) (). In our previous Chandra study of HAeBe stars we have shown that, albeit the assumption of an iso-thermal plasma may not be appropriate, the X-ray luminosities derived from the above assumptions for the spectral parameters are in reasonable agreement with the values obtained from the actual X-ray spectrum (Stelzer et al., 2006b).
The bolometric luminosities (col. 12) are known only for the primary stars. They represent the blackbody radiation from the stellar photosphere, without taking into account excess emission from circumstellar material seen at IR and radio wavelengths; see Table 1. A rough estimate using the flux ratios measured in the AO images suggests bolometric luminosities for the companions that are at least dex lower than those of the primaries. Consequently, the ratios of the companions are higher than those of the HAeBe stars by the same amount, i.e. on the order of as is typical for low-mass pre-MS stars. We renounce on a more detailed analysis of the X-ray properties of the resolved companions as they are not relevant for the search of the origin of the emission from the primary stars.
Finally, col. of Table 3 represents the significance of variability according to a Kolmogorov-Smirnov (KS) test. Two stars are variable at probability according to the KS test. However, from visual inspection of the lightcurves it is evident that the variability of HR 6000 must be attributed to the satellite dithering, and the only truly variable object is AS 477 C. Given the generally short exposure times and faintness of the targets the lack of detectable variability in these observations is not surprising.
6 Discussion
Our high-resolution X-ray imaging study of young intermediate-mass stars comes up with the remarkable detection rate of %. This result confirms earlier findings of a large number of X-ray emitters among HAeBe stars. In our previous Chandra study of HAeBe stars we detected (Stelzer et al., 2006b). While at least of those are known SBs, only one of the new targets is known to be an SB. In the selection of the new sample we have explicitly included stars with negative results from spectroscopic binarity searches (see Table 1).
In Stelzer et al. (2006b) we found that the X-ray luminosities and temperatures of HAeBe stars are similar to those of their resolved visual late-type companions and also to young low-mass stars in the Orion Nebula Cluster (ONC). With respect to MS B-type stars they have on average hotter and more luminous X-ray emission. For all but three of the new targets analysed in this paper less than photons were collected, owing to the large distance of some objects. This makes the sample unsuited for a detailed spectral analysis. We examine instead the hardness ratios.
The boundaries for the energy bands defining the hardness ratios defined in Sect. 5 were empirically chosen such as to yield a wide spread among the targets in the plane. We compute hardness ratios in the same energy bands for the stars presented previously by Stelzer et al. (2003, 2006a, 2006b), and display all samples in Fig. 3. Observations obtained with ACIS-I and ACIS-S are considered separately. The hardness ratios corresponding to an absorbed isothermal spectrum are also shown and explained in the figure caption. The higher efficiency of ACIS-S for the detection of soft photons yields lower values for with respect to ACIS-I for the same spectral shape. The differences in the hardness ratios measured with ACIS-I and ACIS-S become negligible for strongly absorbed spectra due to the absence of soft photons. The Herbig stars, MS B-type stars, and (presumably late-type) companions are represented in different colors in Fig. 3. HR 6000, which is a chemically peculiar and not a HAeBe star, is marked as green circle.
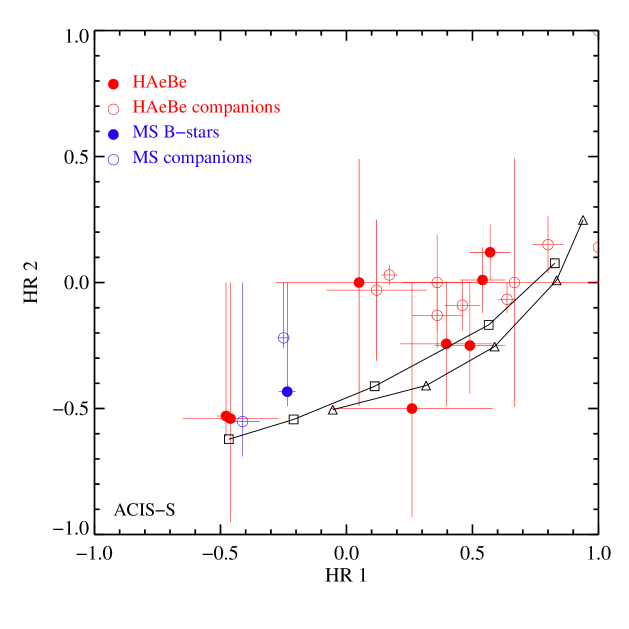
From the distribution of the hardness ratios no clear distinction is evident in Fig. 3 between Herbig stars and their companion stars, while the MS B-type stars have softer X-ray spectra. At face, this might indicate that the X-ray emitters among the Herbig stars are additional unresolved late-type companions. Their X-ray luminosities () are also consistent with the typical range of T Tauri stars. However, as noted already by Stelzer et al. (2006b) and evident from Fig. 3 the companions of the MS B-type stars are also softer than the Herbig stars and their companions, suggesting an evolutionary rather than a mass effect.
It is impossible to assign an X-ray temperature to the stars on basis of their hardness ratios because is degenerate with the column density : A given pair (,) can indicate either low absorption and high temperature, or higher absorption combined with lower temperature. This is demonstrated in Fig. 3 by the curves representing synthesized hardness ratios for different values of (,). However, the softest spectra are evidently little absorbed, and the hardest spectra indicate high column density, in line with the trend of decreasing absorption along the evolutionary sequence. The fact that most data points lie above the models shown in Fig. 3 seems to indicate an excess in hard photons that can not be represented by the simple -T model assumed for calculating the expected colors.
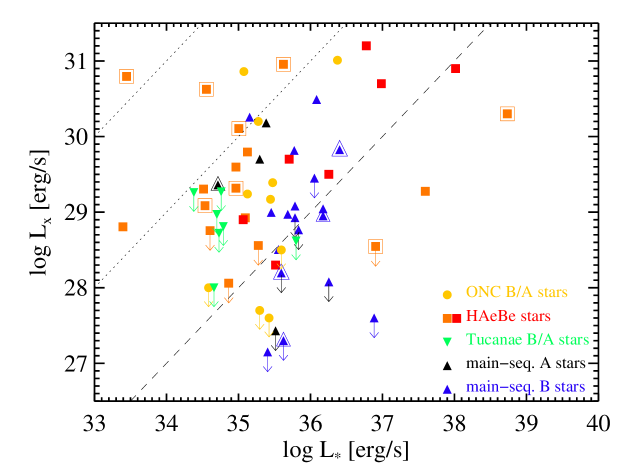
The ratios for most HAeBe stars are between (Fig. 4) confirming historic results. It strikes that all HAeBe stars from our studies for which levels above are measured have been identified as binaries that remain unresolved even with Chandra. From Fig. 4 we infer a possible splitting of the HAeBe sample in ’classical’ HAeBe systems of spectral type late-B/A and early-B type pre-MS stars: The true X-ray emission level of late-B/A Herbig stars – if any – seems to be on the order of . The X-ray production efficiency of these stars is reduced with respect to T Tauri stars, which are generally characterized by . In Fig. 4 we include for comparison intermediate-mass stars of the Myr-old ONC (Stelzer et al., 2005), of the Myr-old Tucanae association (Stelzer & Neuhäuser, 2000), and of the field population (Stelzer et al., 2003, 2006a; Czesla & Schmitt, 2007). About half of the B- and A-type MS stars are found in the same range of as the late-B/A HAeBe stars, while the others are located at levels well below or altogether X-ray dark. This points either at a population of unresolved late-type sub-arcsecond companions to late-B/A HAeBe stars or to a fading of the X-ray emission from late-B/A stars with age.
To satisfy the latter hypothesis, a mechanism that works only at young ages is required. Star-disk magnetic interactions are unlikely to explain all of the X-ray detections among HAeBe stars, as this mechanism is equally valid for low-mass T Tauri stars but not observed to be the major X-ray production process. As outlined in Sect. 1, possible mechanisms for intrinsic X-ray production from HAeBe stars include a fossil magnetic field, MCWS and shear dynamos, all of which require the presence of magnetic fields. Two of the eight HAeBe stars with positively detected magnetic fields have been observed in X-rays at high spatial resolution with Chandra. These two stars are late-B/A HAeBe’s and they are X-ray sources. However, the more relevant number for the understanding of the origin of their X-ray emission is how many X-ray detected HAeBe stars have a null result from magnetic field studies. This number is not easily accessible from the literature because in some publications only the stars with positive magnetic field detections are listed and not the whole observed sample; e.g. Wade et al. (2005) and Hubrig et al. (2004). For some X-ray detected HAeBe stars from the Chandra sample no magnetic field could be detected with spectropolarimetric methods (Wade et al., 2007).
In any case, the fraction of (apparently) X-ray emitting HAeBe stars seems to be much larger than the fraction of (apparently) magnetic HAeBe stars. This questions any field related emission mechanism for the bulk of HAeBe stars in favor of the companion hypothesis, although magnetic fields may play a crucial role in explaining the X-ray emission from some individual objects. As described in Sect. 1, the case of AB Aur provided convincing evidence for X-ray emission from the wind region and magnetic fields are needed to explain its X-ray variability (Telleschi et al., 2007b). For the A1e star HD 163296 the unusually soft X-ray emission was explained by emission from an accretion shock at the end points of magnetospheric funnel flows similar to the case of some lower-mass cTTS (Swartz et al., 2005). However, recent analysis suggests that its X-ray properties may resemble those of AB Aur: cool and hot X-ray emitting plasma but no evidence for high densities as seen in cTTS making accretion shocks as origin of the X-ray production unlikely and suggesting an emission site above the surface of the star (Guenther et al., in prep.). Interestingly, the polarization signatures in some HAeBe stars show evidence for a origin in circumstellar matter rather than on the stellar surface suggesting magnetic fields associated with the wind (Hubrig et al., 2007).
The only HAeBe stars in our high-resolution Chandra studies that showed high X-ray luminosities () and no evidence for unresolved companions are of early spectral type (cf. Fig. 4). If considered intrinsic to the HAeBe stars their X-ray emission scales with bolometric luminosity similar to hot stars (). Nevertheless, it can not be excluded that the bulk of the emission of early-B HAeBe stars comes from unknown cooler companions.
The six HAeBe stars selected for the study presented in this paper have known visual companions resolved with Chandra, while no reports on binarity are known for the three B(e) stars added to the sample because they were serendipitously observed in the same Chandra fields. This implies that, if the X-rays detected in this survey are to be ascribed to cool companion stars all of the six original targets are triple systems. Little is known about the higher order multiplicity of HAeBe stars. In any case, high-resolution imaging studies came up with an enhanced binary frequency of Herbig stars when compared to solar-type MS stars (e.g. Leinert et al., 1997; Bouvier & Corporon, 2001). This is even more evident in a recent spectro-astrometric search for sub-arcsecond companions to HAeBe stars where Baines et al. (2006) reported with % the highest multiplicity fraction observed so far in any sample of these type of stars.
7 Conclusions
In summary, this study remains inconclusive as to the origin of the X-ray sources. Either HAeBe stars are intrinsic hard X-ray sources with similar properties as lower-mass T Tauri stars but scaled down with respect to the stellar luminosity or the majority of the low-mass companions of the HAeBe stars has not yet been identified. From a consideration of the X-ray luminosities we have speculated about a possible division in two types of HAeBe stars. The hotter group of early-B stars might behave similar to early-type stars on the MS, and the cooler group of ’classical’ late-B/A HAeBe stars might involve magnetic field related X-ray emission processes as had been suggested for the prototype of this class, AB Aur. First indications for different X-ray brightness of Herbig Ae and Be stars had been mentioned by Damiani et al. (1994), however on basis of a sample observed by low spatial resolution with Einstein and dominated by upper limits. As a result of our high-resolution, high-sensitivity Chandra imaging several HAeBe stars have now been resolved from late-type companion stars. There is evidence that the intrinsic X-ray emission level of late-B/A Herbig stars – if any – is erg/s, one to two orders of magnitude lower than derived from earlier low-resolution X-ray studies. A more detailed analysis for the viability of the potential emission processes in our targets is not feasible, owing to the insufficient diagnostic power of the existing X-ray observations, the absence or inhomogeneity of the database for wind properties, and a lack of quantitative predictions of some theoretical models. As demonstrated for the case of AB Aur, useful constraints can be placed by means of high-resolution X-ray spectroscopy that provides access to source density and location and by means of X-ray monitoring searching for variability. Furthermore, a comprehensive multiplicity study for intermediate-mass stars in various evolutionary stages is needed and is underway (Thomas et al., in prep.).
Appendix A Individual Systems
A.1 MWC 147
MWC 147 (HD 259531) is a well-studied Herbig Be star in Monoceros ( pc; Herbst et al., 1982). The Hipparos parallax gives a smaller distance of 290pc (Bertout et al., 1999). MWC 147 is strongly accreting. Mass accretion rates from to have been estimated with different diagnostics including radio emission, near-IR line emission and SED fitting (see Kraus et al., 2008, for a summary). A search for magnetic fields did not result in a significant detection (Wade et al., 2007). Mottram et al. (2007) interpreted the observed line depolarization as evidence for accretion from the disk without the mediation by a magnetosphere.
MWC 147 has a faint visual companion at separation (Baines et al., 2006), and no evidence for being a spectroscopic binary (Corporon & Lagrange, 1999). However, Akeson et al. (2000) found that IR interferometric visibility data of MWC 147 cannot be described by a standard accretion disk model but a good fit is obtained if an additional companion at milli-arcsecond separation is assumed.
Our high spatial resolution image with Chandra has shown that the earlier Einstein X-ray source reported by Damiani et al. (1994) includes contributions from both MWC 147 and its companion. The X-ray luminosity measured with Einstein is a factor two lower than the combined X-ray luminosity of MWC 147 A+B obtained with Chandra, part of which can be explained by different assumptions on the column density. MWC 147 has the highest X-ray luminosity in this sample. This might be an indication for shorter distance as suggested by the Hipparcos measurement.
A.2 Hen 3-1141
Hen 3-1141 is a late-A or early-F star, one of the latest in spectral type among the HAeBe stars in Thè’s catalog. In the past it had been erroneously classified as a post-AGB star (Oudmaijer et al., 1992) or a Vega-type star (Walker & Wolstencroft, 1988). Pérez et al. (2004) detected Lithium absorption and P Cyg profiles in the H emission evidencing the presence of winds and thus supporting the pre-MS character of Hen 3-1141. The sky position of Hen 3-1141 suggests membership in Sco OB2 ( pc, although a larger distance of pc was inferred from the Hipparcos parallax. A weak magnetic field was marginally () detected by Hubrig et al. (2004).
A faint object located to the north of Hen 3-1141 detected on near-IR images was confirmed to share proper motion with Hen 3-1141. This companion was classified as a K2 star based on the strength of its Na I doublet. Pérez et al. (2004) argued that the Hipparcos measurement might be influenced by binary motion. For a distance of pc the two components of the binary star are coeval on evolutionary tracks, and we follow the suggestion of Pérez et al. (2004) for an association of Hen 3-1141 with Sco OB2.
No previous reports on X-ray emission are found in the literature. With Chandra we detected X-rays from both the Herbig star and its northern companion.
A.3 AS 310
AS 310 is associated with the H II region S 61. Long known to be a binary (Bastian & Mundt, 1979), Ageorges et al. (1997) discovered four further near-IR sources within of the HAeBe star, probably representing the brightest members of a young star cluster (Testi et al., 1998). One of these objects was resolved in a double source by Thomas et al., in prep. Polomski et al. (2002) detected an extended mid-IR nebulosity coincident with these companions. Source E of Thomas et al., in prep. is also reported by Maheswar et al. (2002), and sources E and F by Polomski et al. (2002).
No previous reports on X-ray emission are found in the literature. The brightest X-ray emission observed with Chandra in the area is associated with the Herbig star, and some of the companions are weakly detected.
A.4 HAeBe stars in NGC 7129
The NGC 7129 reflection nebula at a distance of pc (Hillenbrand et al., 1992; Finkenzeller & Mundt, 1984) is illuminated by the B-type stars BD +65 1637 and BD +65 1638 that have evacuated their environment of molecular material and are surrounded by a cluster of low-mass stars. The star cluster was recently studied with Spitzer (Gutermuth et al., 2004; Muzerolle et al., 2004). A third Herbig Be star, V373 Cep (better known as LkH 234), is located on a molecular ridge at the eastern end of the cluster. LkH 234 is the youngest of the HAeBe stars in NGC 7129.
An optically thick disk around LkH 234 was inferred from the slope of its spectral energy distribution (Fuente et al., 2001). Chakraborty et al. (2004) observed correlated variability of H and He I that is considered as indicator of ongoing accretion (de Winter et al., 1999). Transient redshifted absorption components in Na D lines, uncorrelated with the changes in H and He I lines, were explained with an infalling planetesimal. In this scenario the dust disk is in a relatively evolved stage. Indeed, the outflows detected near LkH 234 could be associated to a nearby deeply embedded infrared companion, IRS 6, located NW of the Herbig star Fuente et al. (2001). In the same vein, none of the five radio emitters within of LkH 234, that are interpreted as thermal radio jets and CO outflows, is powered by the Herbig Be star suggesting it is more evolved and less embedded (Trinidad et al., 2004). Several IR sources were reported in the vicinity of V373 Cep (Weintraub et al., 1994). None of these radio and IR emitters is detected with Chandra.
Previous X-ray surveys had provided a confusing picture of the region. The Einstein IPC could not resolved LkH and BD +65 1637. A strong but largely displaced X-ray source (; ) was assigned to both HAeBe stars (Damiani et al., 1994). No X-ray emission was detected with ROSAT yielding an upper limit of for LkH 234, higher than and therefore consistent with the new Chandra detection. The only ROSAT X-ray source in the region was associated with the third Herbig Be star of NGC 7129, BD+65 1638 (Zinnecker & Preibisch, 1994). With Chandra BD+65 1638 is resolved into a double X-ray source possibly indicating binarity. Both sources are nearly equally bright in X-rays. The stellar parameters of BD+65 1638 are not known and this system deserves follow up.
A.5 AS 477
AS 477, better known as BD +46 3471, has evacuated a cavity in the molecular cloud and was classified a star that has dispersed its circumstellar material (Fuente et al., 2002). The existence of outflow activity is manifest in [OI] Å emission (Corcoran & Ray, 1998), and a wind with moderate mass loss rate of was diagnosed by modeling of emission lines (Nisini et al., 1995; Bouret & Catala, 1998).
Thomas et al., in prep. find four faint IR sources within of AS 477. Component C was earlier reported by Pirzkal et al. (1997) and by Maheswar et al. (2002). There is no evidence for a spectroscopic companion (Corporon & Lagrange, 1999).
Although AS 477 is known to be surrounded by further emission line stars (LkH235…239 within ; Herbig 1960) Zinnecker & Preibisch (1994) assigned the strong ROSAT X-ray source () to AS 477. Chandra has now shown that, although the Herbig star is detected, most of the X-ray emission is produced by the two closest companion stars.
A.6 HR 5999 / HR 6000
The stellar pair HR 5999/HR 6000 is located in the central part of the Lupus 3 dark cloud at a distance of about 150 pc (see e.g. Hughes et al., 1993). HR 5999 (=V856 Sco) with spectral type A7IVe belongs to the class of HAeBe stars (Thè et al., 1994) showing all the required phenomenology such as photometric variability and emission lines. Strong evidence for a disk exists from the IR energy distribution (Hillenbrand et al., 1992). Stecklum et al. (1995) report IR astrometry of a fainter companion around HR 5999 (a 0.5 M⊙ star named Rossiter 3930) at a distance of .
HR 5999 forms a common proper motion pair with HR 6000 (=V1027 Sco, A1.5III) at , corresponding to a projected separation of AU when adopting a distance of pc. We note that the Hipparcos distances are slightly larger ( and pc for HR 5999 and HR 6000, respectively). From optical spectroscopy Andersen et al. (1984) concluded that HR 6000 is a single, slowly rotating (or pole on), chemically peculiar He-weak late-B/early A-type star without any evidence for circumstellar matter. As such it would be an interesting candidate for an intrinsic A-type X-ray emitter, since chemically peculiar stars often do have magnetic fields. However, van den Ancker et al. (1996) interpret its peculiar spectral and photometric properties as evidence for HR 6000 being a young binary system containing a B6V star and a cool T Tauri companion. This scenario would also explain the weak IR excess and the X-ray emission detected from HR 6000.
X-ray emission from HR 5999 and HR 6000 was already detected with the ROSAT PSPC (Zinnecker & Preibisch, 1994). Hamaguchi et al. (2005) report an ASCA detection of HR 5999 and both stars were also observed by XMM-Newton. We investigated this archival XMM-Newton observation and find that the X-ray emission from HR 5999 is more strongly absorbed than that from HR 6000, in accordance with the optical extinction. Since the light paths from HR 5999 an HR 6000 have very similar trajectories, the absorption observed towards HR 5999 must then occur in the vicinity of the star itself. All previous X-ray observations suffered from low spatial resolution. In the Chandra data presented here, HR 5999 is for the first time resolved from its late-type companion, which turns out to be the brighter X-ray source although weak X-ray emission is also detected from the primary Herbig star. HR 6000 can not be resolved with Chandra from its spectroscopic companion, and the origin of its X-ray emission remains unclear.
Acknowledgements.
We would like to thank the referee, M. Güdel, for constructive comments. B.S. acknowledges financial support from ASI-INAF I/088/06/0 and J.R. from DLR under 50QR0803. This research has made use of data obtained with Chandra under proposal numbers 07200005 and 09200162, software provided by the Chandra X-ray Center (CXC), the SIMBAD database (operated at CDS, Strasbourg, France), and the Hipparcos catalogue accessed through the VizieR data base.References
- Ageorges et al. (1997) Ageorges, N., Eckart, A., Monin, J.-L., & Menard, F. 1997, A&A, 326, 632
- Akeson et al. (2000) Akeson, R. L., Ciardi, D. R., van Belle, G. T., Creech-Eakman, M. J., & Lada, E. A. 2000, ApJ, 543, 313
- Alecian et al. (2008) Alecian, E., Catala, C., Wade, G. A., et al. 2008, ArXiv e-prints, 803
- Andersen et al. (1984) Andersen, J., Jaschek, M., & Cowley, C. R. 1984, A&A, 132, 354
- Babel & Montmerle (1997a) Babel, J. & Montmerle, T. 1997a, ApJ, 485, L29+
- Babel & Montmerle (1997b) Babel, J. & Montmerle, T. 1997b, A&A, 323, 121
- Baines et al. (2006) Baines, D., Oudmaijer, R. D., Porter, J. M., & Pozzo, M. 2006, MNRAS, 367, 737
- Bastian & Mundt (1979) Bastian, U. & Mundt, R. 1979, A&AS, 36, 57
- Berghöfer et al. (1996) Berghöfer, T. W., Schmitt, J. H. M. M., & Cassinelli, J. P. 1996, A&AS, 118, 481
- Bertout et al. (1999) Bertout, C., Robichon, N., & Arenou, F. 1999, A&A, 352, 574
- Beuzit et al. (1997) Beuzit, J.-L., Demailly, L., Gendron, E., et al. 1997, Experimental Astronomy, 7, 285
- Bouret & Catala (1998) Bouret, J.-C. & Catala, C. 1998, A&A, 340, 163
- Bouvier & Corporon (2001) Bouvier, J. & Corporon, P. 2001, in IAU Symposium, Vol. 200, The Formation of Binary Stars, ed. H. Zinnecker & R. Mathieu, 155–+
- Chakraborty et al. (2004) Chakraborty, A., Ge, J., & Mahadevan, S. 2004, ApJ, 606, L69
- Corcoran & Ray (1998) Corcoran, M. & Ray, T. P. 1998, A&A, 331, 147
- Corporon & Lagrange (1999) Corporon, P. & Lagrange, A.-M. 1999, A&AS, 136, 429
- Cutri et al. (2003) Cutri, R. M., Skrutskie, M. F., van Dyk, S., et al. 2003, 2MASS All Sky Catalog of point sources. (The IRSA 2MASS All-Sky Point Source Catalog, NASA/IPAC Infrared Science Archive. http://irsa.ipa c.caltech.edu/applications/Gator/)
- Czesla & Schmitt (2007) Czesla, S. & Schmitt, J. H. H. M. 2007, A&A, 465, 493
- Damiani et al. (1994) Damiani, F., Micela, G., Sciortino, S., & Harnden, Jr., F. R. 1994, ApJ, 436, 807
- de Winter et al. (1999) de Winter, D., Grady, C. A., van den Ancker, M. E., Pérez, M. R., & Eiroa, C. 1999, A&A, 343, 137
- Dommanget & Nys (1994) Dommanget, J. & Nys, O. 1994, Communications de l’Observatoire Royal de Belgique, 115, 1
- Favata et al. (2005) Favata, F., Flaccomio, E., Reale, F., et al. 2005, ApJS, 160, 469
- Finkenzeller & Mundt (1984) Finkenzeller, U. & Mundt, R. 1984, A&AS, 55, 109
- Freeman et al. (2002) Freeman, P. E., Kashyap, V., Rosner, R., & Lamb, D. Q. 2002, ApJS, 138, 185
- Fuente et al. (2002) Fuente, A., Martın-Pintado, J., Bachiller, R., Rodrıguez-Franco, A., & Palla, F. 2002, A&A, 387, 977
- Fuente et al. (2001) Fuente, A., Neri, R., Martín-Pintado, J., et al. 2001, A&A, 366, 873
- Gagné et al. (2005) Gagné, M., Oksala, M. E., Cohen, D. H., et al. 2005, ApJ, 628, 986
- Garcia Lopez et al. (2006) Garcia Lopez, R., Natta, A., Testi, L., & Habart, E. 2006, A&A, 459, 837
- Gehrels (1986) Gehrels, N. 1986, ApJ, 303, 336
- Giardino et al. (2004) Giardino, G., Favata, F., Micela, G., & Reale, F. 2004, A&A, 413, 669
- Güdel & Telleschi (2007) Güdel, M. & Telleschi, A. 2007, A&A, 474, L25
- Güdel et al. (2007) Güdel, M., Telleschi, A., Audard, M., et al. 2007, A&A, 468, 515
- Gutermuth et al. (2004) Gutermuth, R. A., Megeath, S. T., Muzerolle, J., et al. 2004, ApJS, 154, 374
- Hamaguchi et al. (2000) Hamaguchi, K., Terada, H., Bamba, A., & Koyama, K. 2000, ApJ, 532, 1111
- Hamaguchi et al. (2005) Hamaguchi, K., Yamauchi, S., & Koyama, K. 2005, ApJ, 618, 360
- Herbst et al. (1982) Herbst, W., Holtzman, J. A., & Phelps, B. E. 1982, AJ, 87, 1710
- Hernández et al. (2004) Hernández, J., Calvet, N., Briceño, C., Hartmann, L., & Berlind, P. 2004, AJ, 127, 1682
- Hillenbrand et al. (1992) Hillenbrand, L. Y., Strom, S. E., Vrba, F. J., & Keene, J. 1992, ApJ, 397, 613
- Hofmann et al. (1995) Hofmann, R., Brandl, B., Eckart, A., Eisenhauer, F., & Tacconi-Garman, L. E. 1995, in Presented at the Society of Photo-Optical Instrumentation Engineers (SPIE) Conference, Vol. 2475, Proc. SPIE Vol. 2475, p. 192-202, Infrared Detectors and Instrumentation for Astronomy, Albert M. Fowler; Ed., ed. A. M. Fowler, 192–202
- Hubrig et al. (2007) Hubrig, S., Pogodin, M. A., Yudin, R. V., Schöller, M., & Schnerr, R. S. 2007, A&A, 463, 1039
- Hubrig et al. (2004) Hubrig, S., Schöller, M., & Yudin, R. V. 2004, A&A, 428, L1
- Hughes et al. (1993) Hughes, J., Hartigan, P., & Clampitt, L. 1993, AJ, 105, 571
- Hünsch et al. (1998) Hünsch, M., Schmitt, J. H. M. M., & Voges, W. 1998, A&AS, 132, 155
- Kastner et al. (2002) Kastner, J. H., Huenemoerder, D. P., Schulz, N. S., Canizares, C. R. ., & Weintraub, D. A. 2002, ApJ, 567, 434
- Kraft et al. (1991) Kraft, R. P., Burrows, D. N., & Nousek, J. A. 1991, ApJ, 374, 344
- Kraus et al. (2008) Kraus, S., Preibisch, T., & Ohnaka, K. 2008, ApJ, 676, 490
- Leinert et al. (1997) Leinert, C., Richichi, A., & Haas, M. 1997, A&A, 318, 472
- Maheswar et al. (2002) Maheswar, G., Manoj, P., & Bhatt, H. C. 2002, A&A, 387, 1003
- Mottram et al. (2007) Mottram, J. C., Vink, J. S., Oudmaijer, R. D., & Patel, M. 2007, MNRAS, 377, 1363
- Muzerolle et al. (2004) Muzerolle, J., Megeath, S. T., Gutermuth, R. A., et al. 2004, ApJS, 154, 379
- Nadeau et al. (1994) Nadeau, D., Murphy, D. C., Doyon, R., & Rowlands, N. 1994, PASP, 106, 909
- Nisini et al. (1995) Nisini, B., Milillo, A., Saraceno, P., & Vitali, F. 1995, A&A, 302, 169
- Oudmaijer et al. (1992) Oudmaijer, R. D., van der Veen, W. E. C. J., Waters, L. B. F. M., et al. 1992, A&AS, 96, 625
- Palla & Stahler (1999) Palla, F. & Stahler, S. W. 1999, ApJ, 525, 772
- Pérez et al. (2004) Pérez, M. R., van den Ancker, M. E., de Winter, D., & Bopp, B. W. 2004, A&A, 416, 647
- Pirzkal et al. (1997) Pirzkal, N., Spillar, E. J., & Dyck, H. M. 1997, ApJ, 481, 392
- Polomski et al. (2002) Polomski, E. F., Telesco, C. M., Piña, R., & Schulz, B. 2002, AJ, 124, 2207
- Preibisch et al. (2005) Preibisch, T., Kim, Y.-C., Favata, F., et al. 2005, ApJS, 160, 401
- Rigaut et al. (1998) Rigaut, F., Salmon, D., Arsenault, R., et al. 1998, PASP, 110, 152
- Ryter (1996) Ryter, C. E. 1996, Ap&SS, 236, 285
- Skinner et al. (2004) Skinner, S. L., Güdel, M., Audard, M., & Smith, K. 2004, ApJ, 614, 221
- Stecklum et al. (1995) Stecklum, B., Eckart, A., Henning, T., & Loewe, M. 1995, A&A, 296, 463
- Stelzer et al. (2005) Stelzer, B., Flaccomio, E., Montmerle, T., et al. 2005, ApJS, 160, 557
- Stelzer et al. (2003) Stelzer, B., Huélamo, N., Hubrig, S., Zinnecker , H., & Micela, G. 2003, A&A, 407, 1067
- Stelzer et al. (2006a) Stelzer, B., Huélamo, N., Micela, G., & Hubrig, S. 2006a, A&A, 452, 1001
- Stelzer et al. (2006b) Stelzer, B., Micela, G., Hamaguchi, K., & Schmitt, J. H. M. M. 2006b, A&A, 457, 223
- Stelzer & Neuhäuser (2000) Stelzer, B. & Neuhäuser, R. 2000, A&A, 361, 581
- Stelzer & Schmitt (2004) Stelzer, B. & Schmitt, J. H. M. M. 2004, A&A, 418, 687
- Swartz et al. (2005) Swartz, D. A., Drake, J. J., Elsner, R. F., et al. 2005, ApJ, 628, 811
- Telleschi et al. (2007a) Telleschi, A., Güdel, M., Briggs, K. R., Audard, M., & Palla, F. 2007a, A&A, 468, 425
- Telleschi et al. (2007b) Telleschi, A., Güdel, M., Briggs, K. R., et al. 2007b, A&A, 468, 541
- Testi et al. (1998) Testi, L., Palla, F., & Natta, A. 1998, A&AS, 133, 81
- Thè et al. (1994) Thè, P. S., de Winter, D., & Pèrez, M. R. 1994, A&AS, 104, 315
- Tjin A Djie et al. (1989) Tjin A Djie, H. R. E., The, P. S., Andersen, J., et al. 1989, A&AS, 78, 1
- Tout & Pringle (1995) Tout, C. A. & Pringle, J. E. 1995, MNRAS, 272, 528
- Trinidad et al. (2004) Trinidad, M. A., Curiel, S., Torrelles, J. M., et al. 2004, ApJ, 613, 416
- van den Ancker et al. (1996) van den Ancker, M. E., de Winter, D., & The, P. S. 1996, A&A, 313, 517
- van den Ancker et al. (1998) van den Ancker, M. E., de Winter, D., & Tjin A Djie, H. R. E. 1998, A&A, 330, 145
- van Dessel & Sinachopoulos (1993) van Dessel, E. & Sinachopoulos, D. 1993, A&AS, 100, 517
- Wade et al. (2007) Wade, G. A., Bagnulo, S., Drouin, D., Landstreet, J. D., & Monin, D. 2007, MNRAS, 376, 1145
- Wade et al. (2005) Wade, G. A., Drouin, D., Bagnulo, S., et al. 2005, A&A, 442, L31
- Walker & Wolstencroft (1988) Walker, H. J. & Wolstencroft, R. D. 1988, PASP, 100, 1509
- Wang & Looney (2007) Wang, S. & Looney, L. W. 2007, ApJ, 659, 1360
- Weintraub et al. (1994) Weintraub, D. A., Kastner, J. H., & Mahesh, A. 1994, ApJ, 420, L87
- Zinnecker & Preibisch (1994) Zinnecker, H. & Preibisch, T. 1994, A&A, 292, 152