VERITAS Distant Laser Calibration and Atmospheric Monitoring
Abstract
As a calibrated laser pulse propagates through the atmosphere, the intensity of the Rayleigh scattered light arriving at the VERITAS telescopes can be calculated precisely. This allows for absolute calibration of imaging atmospheric Cherenkov telescopes (IACT) to be simple and straightforward. In these proceedings, we present the comparison between laser data and simulation to estimate the light collection efficiencies of the VERITAS telescopes, and the analysis of multiple laser data sets taken in different months for atmospheric monitoring purpose.
Keywords:
atmospheric effects — gamma rays: observations:
95.55.Ka1 Introduction
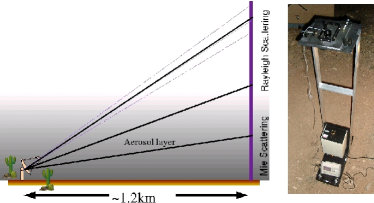
VERITAS is an array of IACTs located at the Fred Lawrence Whipple Observatory on Mount Hopkins in Arizona Holder08 . It consists of four 12m reflectors, each with a camera comprising 499 photomultiplier tubes arranged in a hexagonal lattice covering a field of view of . Calibration of the VERITAS telescopes is done via measurements of individual elements as described in Hanna et al. (2007). A more direct approach to measure the effective light collection area of the VERITAS telescopes is first proposed by Shepherd et al. (2005) using scattered light from a calibrated laser pulse that is detectable by the telescopes and can be simulated easily. As the laser shot travels upward through the atmosphere, the laser light undergoes Rayleigh scattering from dipoles, and Mie scattering from particles similarly sized as the laser wavelength or bigger Kyle . If the telescopes are pointing at high elevation (the highest line in figure 1), Rayleigh scattering would dominate after attenuation from the aerosol layer. For mid-range elevation, the scattered laser light would have gone through a longer distance in the aerosol layer and attenuated more than at the higher elevation. If the telescopes are pointed at low elevation and intercepting scattered light coming from within the aerosol layer (the lowest line in figure 1), Mie scattering becomes important.
Rayleigh scattering can be simulated accurately while Mie scattering depends on the aerosol conditions and properties at the particular time. Therefore multiple measurements over a range of altitudes throughout the observing season are necessary to monitor atmospheric changes and to estimate the effective light collection area of the telescopes.
2 Laser Setup Data Acquistion
A 300 nitrogen laser with 4 ns pulse width and 337nm wavelength is mounted on a movable rack with flexible beam collimation and intensity adjustment (see figure 1). The laser is fired pointing at zenith km away from the VERITAS telescope array. The array is aimed at a range of elevation from to (altitudes 0.5 km to 2.2 km). Both the laser and the array are externally triggered by GPS pulsers such that each recorded event contains an image of the laser shot. The flash-ADC (FADC) recording window is lengthened to 244 samples (488 nanoseconds) to maximize the recording time of the scattered laser light moving across the camera from 3.5 to depending on the elevation.
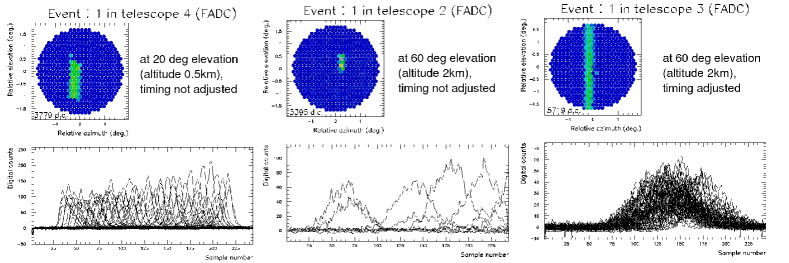
Due to the limited recording time in data acquisition and geometric effects, the length of the laser signal trace increases with altitude (see figure 2). To alleviate this, the pixels are configured to read at different memory depths of the recorded trace for altitude greater than 1.5 km such that all recorded events from any altitude have more than 20 pixels in the image.
3 Analysis Simulation
The laser analysis algorithm is modified from the regular data analysis used in VERITAS described in (Acciari et al., 2008). The FADC trace is convolved with a fixed 125-sample wide window and the location of the integration window is determined by the peak of the integration. If the integration window falls outside of the FADC recording window, the trace is considered truncated and discarded from the analysis. For the remaining traces that do not resemble a background signal and have an integrated digital counts (dc) more than 180, those are added to the image sum. The Linear Image Brightness Density (LIBD) is the image sum divided by the image length.
Rayleigh scattering simulation with GrISU(tah) grisu simulation package provides the expected VERITAS detector output from the Rayleigh-scattered light. The detector output is then analyzed by the algorithm described above. At higher altitude where Mie scattering is less important, the LIBD from the simulation is matched to data by adjusting the light collection efficiency constants in the telescopes model. Combined with tracing of the Rayleigh-scattered light in simulation, we can derive the effective light collection area of the telescopes.
4 Data Results
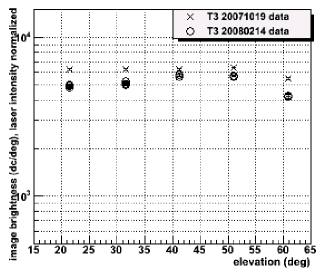
Two sets of data were taken in October 2007 and Feburary 2008. To account for the difference in laser intensity, it is divided from the LIBD. Both nights has comparable LIBD with laser intensity normalized, suggesting little changes in the local atmosphere and the telescopes between the two nights (see figure 3). More frequent distant laser runs are being planned for regular monitoring of the local atmosphere and of the array.
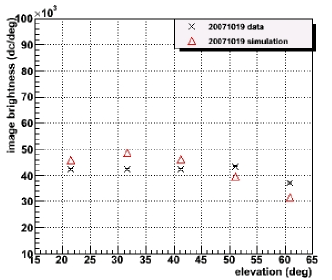
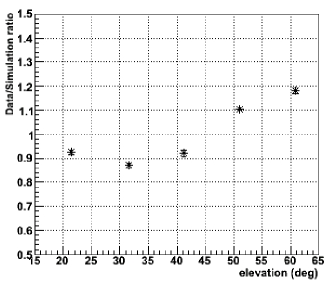
Outside the aerosol layer, Rayleigh scattering dominates over Mie scattering. In figure 4, the LIBD of our measurement and simulation are shown together for comparison. At high elevation, the data is brighter than the simulation; while at low elevation, the scattered light travels a longer distance inside the aerosol layer and undergoes more Mie scattering, lowering the light intensity reaching the telescopes. Figure 5 shows the ratio of LIBD between data and simulation as a function of elevation. This ratio can be affected by the accuracy of the telescopes model used in our simulation and by the amount of Mie scattering that is not accounted for in our simulation. The high elevation points are affected least by Mie scattering unaccounted for in simulation, allowing us to adjust our telescopes model in simulation accordingly.
By comparing data at high elevation and the calculated density of Rayleigh scattered light reaching the telescopes from simulation, we can estimate the effective light collection area of individual telescopes. The recorded LIBD at elevation for one telescope is dc per event, and there were 515 photons per simulated event at the same elevation. Therefore the ratio of how many digital counts per photon for the telescope’s light collecting area is 72 dc . Single photoelectron measurement derived from the nightly flatfielding laser runs Hanna et al. (2007) is dc/photon. Combined with the light collecting ratio, the effective light collection area of a telescope is .
The effective light collection area can also be approximated by using indiviual elements’ measurements. The VERITAS telescopes each have a mirror area of , quantum efficiency at laser wavelength is measured to be 0.18, mirror reflectivies at laser wavelength is 0.92, and camera efficiency is 0.81. These measurements yield an effective collection area of 15 , which is comparable to the area derived from the distant laser measurement.
5 Summary
A calibrated laser pulse fired at zenith at some distance away from IACTs can be used for absolute calibration and for monitoring of both the telescopes’ conditions and the atmosphere at the same time. We presented 2 nights of data that shown similar linear image brightness density, suggesting few changes in the atmosphere and the conditions of the telescopes during that time. With more measurements in the future, we hope to characterize the effect of aerosols on light collection of IACTs. Preliminary estimation of light collection efficiency of one of the telescopes shows our expectation of telescope performance matches with what was recorded, and the effective light collection area is measured to be .
References
- (1) J. Holder et al., these proceedings, (2008)
- Hanna et al. (2007) D. Hanna et al., 30th ICRC, Merida, 702 (2007)
- Shepherd et al. (2005) N. Shepherd et al., 29th ICRC, Pune, 427-430 (2005)
- (4) T. G. Kyle, Atmospheric Transmission, Emission, and Scattering, Pergamon Press, 1991
- Acciari et al. (2008) V. Acciari et al., ApJ, 679, 397 (2008)
- (6) http://www.physics.utah.edu/gammaray/GrISU/