Astronomical site selection: On the use of satellite data for aerosol content monitoring
Abstract
The main goal of this work is the analysis of new approaches to the study of the properties of astronomical sites. In particular, satellite data measuring aerosols have recently been proposed as a useful technique for site characterization and searching for new sites to host future very large telescopes. Nevertheless, these data need to be critically considered and interpreted in accordance with the spatial resolution and spectroscopic channels used. In this paper we have explored and retrieved measurements from satellites with high spatial and temporal resolutions and concentrated on channels of astronomical interest. The selected datasets are OMI on board the NASA Aura satellite and MODIS on board the NASA Terra and Aqua satellites. A comparison of remote sensing and in situ techniques is discussed. As a result, we find that aerosol data provided by satellites up to now are not reliable enough for aerosol site characterization, and in situ data are required.
keywords:
Site testing — Atmospheric effects — Telescopes — EP/TOMS — Aura/OMI — Terra/MODIS — Aqua/MODIS1 Introduction
Most aerosols reaching the Canary Islands are either marine, ClNa, cryogenic emissions or of African (Sahara and Sahel) origin The latter (clays, quartzes, feldspars and calcites), because of their size, can reduce visibility in the optical wavelength range and can therefore affect astronomical observations.
Furthermore, aerosols cause radiative forcing, oceanographic deposits by winds (together with Fe and Al), nutrients and minerals for algae (a coastal increase in chlorophyll—phytoplankton biomass), sanitary effects, etc. Aerosols also play an important role in astronomical site conditions, producing more stable condensation nuclei, delaying precipitation and causing the extinction, absorption, diffusion and reflection of extraterrestrial radiation.
Most of the airmass flux component reaching the Canarian archipelago comes from the North Atlantic Ocean and consists of sea aerosols, which absorbs chloride in the UV. African dust intrusions affect the western and eastern Canary Islands differently. Moreover, the presence of a stable inversion layer and the pronounced orography of the western islands (La Palma and Tenerife) produce different mass flux patterns in the lower (mixing) layers closer to the sea (up to 800 m) and in the median-upper (or free) troposphere layer (above the thermal inversion layer, i.e. above 1500 m), causing a seasonally dependent vertical drainage of airborne particles.
There are remarkable differences between summer intrusions, which can rise to the peaks of the mountains (high level gloom), at 2400 m, and those of winter, more frequent in the lower troposphere (anticyclonic gloom).
Anticyclonic gloom is associated with strong, stationary anticyclonic conditions forced by dust accumulation between the soil and the inversion layer. It can favour the decrease in height of the inversion layer and the formation of clouds that do not easily precipate as rain, hence persisting for a longer time and providing a more stable sea of clouds. The dust is trapped by the sea of clouds (sea of dust) and is prevented from reaching the topmost level in the islands (above 1500 m).
The aerosol index provided by the TOMS (Total Ozone Mapping Spectrometer) is one of the most widely accepted products for detecting the daily aerosol content. TOMS Level 3 data are gridded in squares of 1 (latitude and longitude respectively) and are available online at http://toms.gsfc.nasa.gov. The spatial coverage is global 90∘S-90∘N and the temporal resolution is daily. Moreover, several techniques have been developed in situ to characterize the presence of dust locally at the Canarian observatories. In particular, a parameter related to sky transparency, the atmospheric extinction coefficient in the (551 nm) and (625 nm) bands has been measured at the Observatorio del Roque de los Muchachos (ORM) on La Palma since 1984 by the Carslberg Automatic Meridian Circle (CAMC). The archive is in the public domain at http://www.ast.cam.ac.uk/dwe/SRF/camc_extinction.html and provides a good temporal comparison with the values retrieved with remote sensing techniques from the Total Ozone Mapping Spectrometer on board the Nimbus7 satellite and from other probes (Aura/OMI, Terra/MODIS and Aqua/MODIS, MSG1(Met8)/SEVIRI and ENVISAT/SCIAMACHY). Our main aim is to overlap the geographical area of the ORM with the satellite data; for this reason we have used Level 2 data. Level 0 data are the raw data from the satellite; Level 1 data are calibrated and geolocated, keeping the original sampling pattern; the Level 2 data used in this paper are converted into geophysical parameters but still with the original sampling pattern; finally the Level 3 data are resampled, averaged over space, and interpolated/averaged over time (from http://people.cs.uchicago.edu/yongzh/papers/CM_In_Lg_Scale_Production.doc).
On examination, the Level 2 data have the same spatial resolution as the Instantaneous Field of View (IFOV) of the satellite. Through a software procedure, it is possible to create files containing information on geophysical variables (data describing the solid earth, marine, atmosphere, etc., properties over a particular geographical area) and field values such as seconds, latitude, longitude, reflectivity in different channels, the ozone column, the aerosol index, aerosol optical depth, cloud land and ocean fraction, SO2 and radiance. From remote sensing and in situ data it is possible to trace back to the cloud coverage and climatic trend.
The purpose of this study is the analysis of new approaches to the study of the aerosol content above astronomical sites. Our objective is to calibrate the extinction values in the band (550 nm) (more details in section 3.1) with remote sensing data retrieved from satellite platforms.
The paper is organized as follows: Section 2 describes the problem and background; Sections 3 and 4 concern the comparison of in situ atmospheric extinction data with the aerosol index provided by TOMS (Level 3 data); Sections 5 and 6 deal with the analysis of Level 2 data from other satellites and their validity for site characterization by comparing the satellite results with in situ measurements; and the summary and outlook are given in Section 7.
Two appendices have been included with complementary information. Appendix I describes the format of the satellite data, indicating the official websites for data access, and Appendix II includes a list of acronyms to aid in following the terminology used in the paper.
2 Meteorological and geophysical scenarios
2.1 The trade wind inversion as a determining factor of aerosol distribution
Site testing campaigns are at present performed within the classical scheme of optical seeing properties, meteorological parameters, air transparency, sky darkness, cloudiness, etc. New concepts related to geophysical properties (seismicity and microseismicity), local climate variability, atmospheric conditions related to the optical turbulence (tropospheric and ground wind regimes) and aerosol presence have recently been introduced in the era of selecting the best sites for hosting a new generation of extremely large telescopes (which feature a filled aperture collector larger than 40 m, and which are considered worldwide as one of the highest priorities in ground-based astronomy), telescope and dome designs, and for feasibility studies of adaptive optics (Muñoz-Tuñón 2002; Muñoz-Tuñón et al. 2004; Varela et al. 2002; Varela et al. 2006; Muñoz-Tuñón et al. 2007).
The Canarian Observatories are among the top sites for astronomical observations and have been monitored and characterized over several decades (Vernin et al. 2002). The trade wind scenario and the cold oceanic stream, in combination with the local orography, play an important role in the retention of low cloud layers well below the summits to the windward (north) side of the islands, above which the air is dry and stable (the cloud layers also trap a great deal of light pollution and aerosols from the lower troposphere).
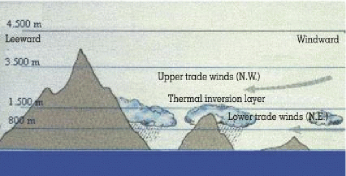
The trade winds and the thermal inversion layer between 1000 and 1500 m (shown in Fig. 1) have been the object of many studies over the last 50 years, either indirectly from observations of the stratocumulus layer (known locally as the “sea of clouds”), which forms at the condensation level (Font-Tullot 1956) or from radiosondes (Huetz-de-Lemps 1969). For much of the year, the trade wind inversion layer separates two very different airmasses: the maritime mixing layer (MML) and the free troposphere layer (TL) (Torres et al. 2001). The presence of the inversion layer is crucial in the airmass flows reaching the islands and in the downflow at high elevations that they undergo. Saharan dust invasions mostly affect the eastern islands, but can occasionally reach the islands of Tenerife and La Palma; normally, however, they do not reach the level of the Observatories (the ORM is 2396 m and the OT 2390 m above mean sea level).
2.2 Airmass intrusions in the Canary Islands
Airmasses are classified into three types according to their origin and permanence over continental landmasses and sea: Atlantic (marine, ClNa), European (anthropogenic emissions from sulphates and carbon) and African (dust, mineral aerosols). The most frequent are chlorides, i.e. clean salts of oceanic origin that do not affect astronomical observations, and that reach or exceed half the total contribution of mass flux over the summits. European airmasses are almost always of anthropogenic origin (sulphates and carbon) and are of scant importance (between 0.8 and 7.2%; see Romero 2003).
A study of the origins and distribution of air flows performed by Torres et al. (2003) distinguished the origins of airmasses that affect the lower (MML) and upper (TL) layers, the latter being at the height of the astronomical observatories. Daily isentropic retrotrajectories (at 00:00 and 12:00 GMT) were used during the AEROCE (Atmosphere/Ocean Chemisty Experiment) at Izaña (2367 m above MSL, 1986–97) and the Punta del Hidalgo Lighthouse (sea level, 1988–97), each airmass being assigned an origin: North American, North Atlantic, Subtropical Atlantic, Europe, Local and Africa, the summer and winter periods being separated.
The airmass provenance in the lower (mixing) layer close the sea (MML) is Northern Atlantic (the mean is 59.6%), European (the mean is 19%) and African (0% in summer and 23% in winter), whereas the troposphere layer (TL) is mainly Northern Atlantic (44.2%) and African (17.4%), with a minimum in April (5.3%) and a maximum in August (34.5%) (Torres et al. 2003).
African summer intrusions are therefore almost absent in the MML and more intense in the TL because of the daily thermal convection reaching the higher atmospheric layers. In winter intrusions into the TL are less frequent. The airmass is carried horizontally by the prevailing wind and is affected by a process of separation, the larger particles ( 10 m) leaving sediments at ground level over a short time and the smaller ones being carried across the Atlantic Ocean to distances of hundreds or thousands of kilometres from their place of origin. This sand creates a large feature (plume) that is visible in satellite images (see, for example, the EP/TOMS or Aura/OMI websites) and extends from the African coast across a band about 20∘ in latitude. During winter, the prevailing wind carries the dust from the south of Canary islands through an average of 10∘ in latitude to the Cape Verde Islands. Considering that the dust plumes reach an extension of about 2000 km, during the winter they rarely reach La Palma. Instead, in summer, winds above 4 km in altitude can take these particles as far north as 30∘ in latitude. In these conditions the dust plume over the ORM is composed mainly of small quartz particles in the range 0,5–10 m and the biggest particles precipitate (dry deposition). Typical dust storms take 3–8 days to disperse and deposit 1–2.4 million tonnes/year. Finally, the clouds of aerosols dissipate through advective processes or through rain (sumid deposition).
3 Database for the analysis: in situ extinction coefficient values and aerosol indexes provided by the TOMS and OMI spectrographs on board satellites
3.1 Atmospheric extinction coefficient measured above the ORM (La Palma)
Atmospheric extinction is the astronomical parameter that determines transparency of the sky. Extinction is associated with the absorption/scattering of incoming photons by the Earth’s atmosphere and is characterized by the extinction coefficient, . Sources of sky transparency degradation are clouds (water vapour) and aerosols (dust particles included). This coefficient is wavelength-dependent and can be determined by making observations of a star at different airmasses. For details of the astronomical technique for deriving the extinction coefficient values we refer the reader to King (1985).
Long baseline extinction values for the ORM have been measured continously at the Carlsberg Automatic Meridian Circle
(CAMC, http://www.ast.cam.ac.uk/d̃we/SRF/camc_extinction.
html) in the band (550 nm) and more recently in the Sloan band (625 nm).
To our knowledge, this is the largest available homogeneous
database for an
observing site.
Extinction values and their stability throughout the night are essential for determining the accuracy of astronomical measurements. As nights with low and constant extinction are classified as photometric, this parameter is considered among those relevant for characterizing an observing site.
On photometric dust-free nights the median of the extinction is 0.19 mag/airmass at 480 nm, 0.09 mag/airmass at 625 nm and 0.05 mag/airmass at 767 nm. The extinction coefficients reveal that on clear days (denoted coronal-pure) the extinction values at 680 nm are below about 0.07–0.09 mag/airmass, while on dusty days (diffuse-absorbing) they are always higher (Jiménez & González Jorge 1998). The threshold that identifies the presence of dust is at 0.153 mag/airmass (Guerrero et al. 1998).
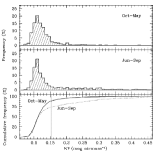
At the ORM, the extinction in is less than 0.2 mag/airmass on 88% of the nights, and extinction in excess of 0.5 mag/airmass occurs on less than 1% of nights. A statistical seasonal difference is also detected (see Guerrero et al. 1998).
Figure 2 shows the cumulative frequency of extinction over the ORM during winter (October–May) and summer (June–September). In summer, 75% of the nights are free of dust, while at other times of the year over 90% of the nights are dust-free (Guerrero et al. 1998). These results are consistent with those provided by Torres et al. 2003.
3.2 Characterization of aerosols in the near-UV
Data from Total Ozone Monitoring Spectrometer (TOMS) and from the Ozone Monitoring Instrument (OMI) are analysed to detect absorbing and non-absorbing aerosols at ultraviolet (UV) wavelengths. A detailed description of these instruments and the products are given at the official Website (http://toms.gsfc.nasa.gov/). Absorbing aerosols include smoke deriving from biomass burning, industrial activity, mineral dust, volcanic aerosols and soot. Non-absorbing aerosols are mostly sulphates. The UV spectral contrast is useful for retrieving values over land and ocean because of its low reflectivity in the spectrometer range. Backscattered radiation at 340, 360 and 380 nm is caused mainly by molecular Rayleigh scattering, terrestrial reflection and diffusion by aerosols and clouds (through Mie scattering). Quantitatively, aerosol detection from TOMS and OMI is given by:
where is the backscattered radiance at the wavelenghts measured by TOMS and OMI (with Mie and Rayleigh scattering, and absorption) and is the radiance calculated from the model molecular atmosphere with Rayleigh scatterers. depends strongly on the absorbing optical thickness of the Mie scatterers. is also called the aerosol index (AI). AI 0 indicates the presence of absorbing aerosols and clouds (AI0.2) and negative AI values indicate non-absorbing aerosols (Herman et al. 1997; Torres et al. 1998). Significant absorption has been set at AI by Siher et al. 2004 and at AI in this work (see explanation in next section and in Fig. 10).
The next section (Results I) concerns the first comparison of the in situ atmospheric extinction coefficient with the aerosol index provided by TOMS using Level 3 data. In Section 5 we present recent instruments on board satellites suitable for aerosol content monitoring and in Section 6 (Results II) we compare the atmospheric extinction coefficient with the aerosol index and aerosol optical depth provided by OMI and MODIS respectively, using Level 2 data.
4 Results I: comparison of AI provided by TOMS with KV from the CAMC
Atmospheric extinction is related to the internationally recognized term aerosol optical depth (AOD) (or thickness) and to the aerosol index. In this section we shall analyse the first results of comparing the atmospheric extinction coefficient with the aerosol index provided by TOMS (Total Ozone Mapping Spectrograph) on board NASA s Earth Probe satellite. We use Level 3 aerosol data, which are available at:
ftp://toms.gsfc.nasa.gov/pub/eptoms/data/aerosol/.
In a previous paper (Varela et al. 2004a) we presented the aerosol index from the sector corresponding to the Teide Observatory (Tenerife) against the atmospheric extinction coefficient recorded at Roque de los Muchachos Observatory (La Palma). The Teide Observatory (OT) is situated 2390 m above sea level in Izaña and the geographical coordinates are 16∘ 30′ 35 West and 28∘ 18′ 00 North. The Observatorio del Roque de los Muchachos is situated on the edge of the Caldera de Taburiente National Park, 2396 m above sea level and the geographical coordinates are 17∘ 52′ 34 West and 28∘ 45′ 34 North. The two observatories are about 133 km apart. We compared the AI from EP/TOMS data centred at the OT and at the ORM sectors (see figure 5 of Varela et al. 2004b).
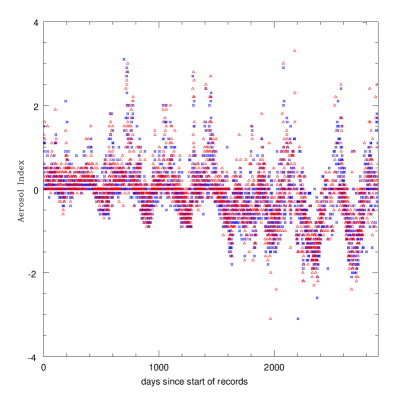
The consistency of AI from both boxes centred on the OT and on the ORM shown in Fig. 3 points to a similar tropospheric aerosol distribution at both observatories.
In the next section (Results II) we show the results of comparing the atmospheric extinction coefficient with the aerosol index provided by OMI on board NASA’s Aura satellite and with the aerosol optical depth provided by MODIS on board NASA’s Terra and Aqua satellites.
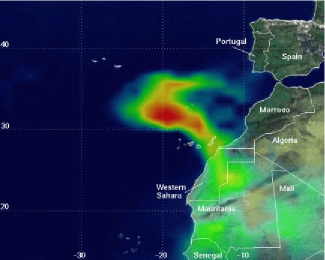
To demonstrate why there is not necessarily any correlation between the AI and atmospheric extinction we have selected an intense invasion of African dust over the Canary Islands that occurred on 2000 February 26. Figure 4 shows the plume of dust as recorded by TOMS on board the Earth Probe. We have used AI values obtained from TOMS for the Canarian Observatories and atmospheric extinction values provided by the CAMC at the ORM during the night before and after this episode. AI reaches its maximum (2.4 at the OT and 2.7 at the ORM) on February 27, precisely on the day when the plume reached Tenerife. Nevertheless, the CAMC measures an extinction value of less than 0.2 mag, with a high number of photometric hours. The reason is that when the plume arrived at La Palma it did not reach the level of the Observatory.
In Fig. 5 we represent the atmospheric extinction in the V band (KV) provided by the Carlsberg Meridian Circle against the aerosol index provided by EP/TOMS from 1996 to 2004.
We have classified four quadrants using KV=0.15 mag/airmass as the threshold for dusty nights and AI=0 as the threshold of the presence of absorbing aerosols.
Figure 5 shows a large number of TOMS data indicating the presence of absorbing aerosols coincident with CAMC values that show low or no atmospheric extinction (bottom right in Fig. 5). This result is due to the presence of a layer of dust below the Observatory level. This dust layer is high and/or thick enough to be detected by the TOMS. This condition appears in 17% of all cases.
The case of agreement between large extinction coefficient and large AI (top right in Fig. 5) is associated with dust presence in the upper troposphere layer (TL). We have verified that this case occurs in only 11% of all measurements, with 58% of these corresponding to the summer months (June–September), when the warmest surface winds sweep dust from the African continent and rise towards the upper layers by convective processes (Romero & Cuevas 2002; Torres et al. 2003).
The opposite case, i.e. low extinction coefficient and low aerosol index (bottom left in Fig. 5) happens in 59% of cases.
In the top left quadrant in Fig. 5, we find low AI values of aerosol index but large KV (13% of the data points). A possible explanation is given by Romero & Cuevas 2002, who argue that the cause could be local and concentrated dust in a small area intercepting the light from a star (and therefore measured by CAMC) but that is not representative of the average values from a 1 region provided by TOMS; or is due to the presence of high fine dust layers above the Observatory that are not detected by TOMS. Here we propose cirrus or other clouds as the explanation; in fact, 78% of the points located in the top-left quadrant correspond to the winter months when the possibility of the presence of medium-high clouds is greater.
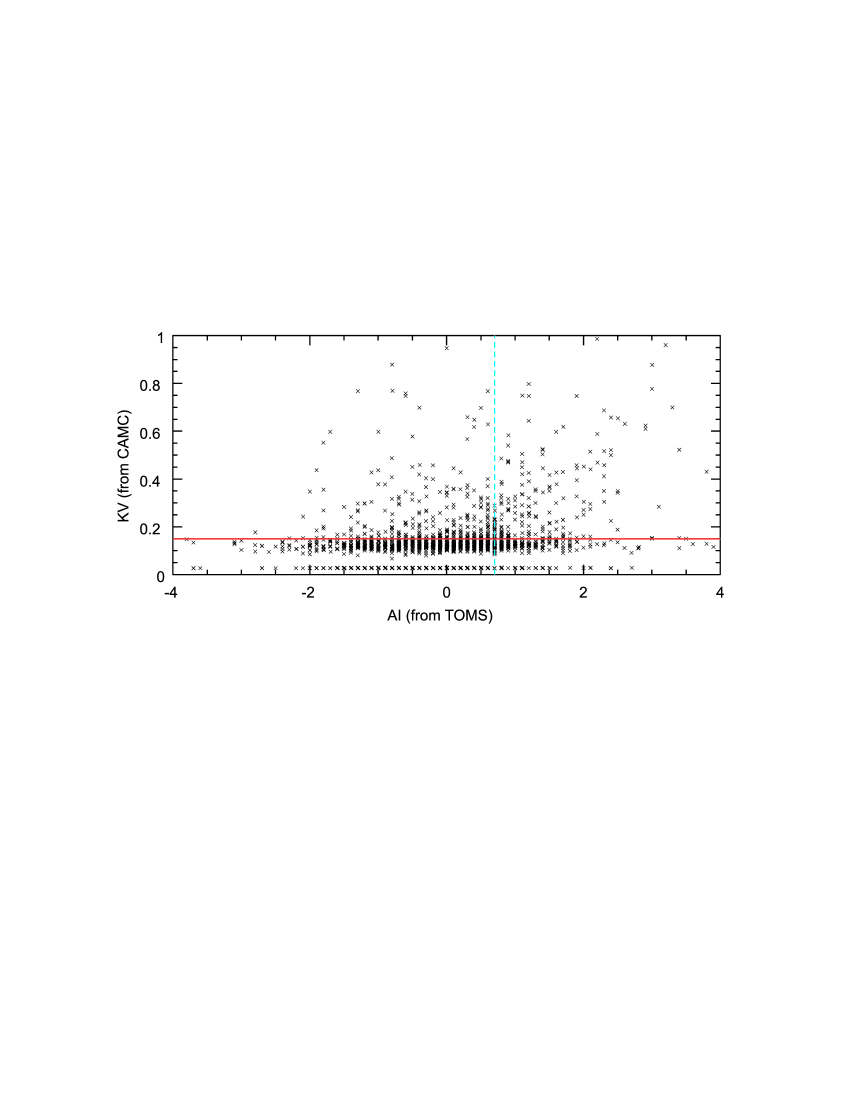
In the four cases (four quadrants), the correlation coefficient and the square of the coefficient of the Pearson correlation is smaller than 0.1, so there is no correlation at all between both parameters. The maximum correlation is found in the upper-right quadrant (mathematically, this is the first quadrant), i.e. AI positive and extinction coefficient larger than 0.15. When this interval is narrowed to AI larger than 0.7 and KV larger than 0.2 mag/airmass (only 4% of cases), this correlation increases slightly. Only when the summer period is considered under these last conditions can the correlation reach 0.55.
This last result coincides with Siher et al. 2004 (see Fig.2 in this paper), correlating AI TOMS data recorded by Nimbus7 and the atmospheric extinction coefficient at the ORM during summertime dusty events (AI0.7 and KV0.2). The correlation found is 0.76. It is important, however, to emphasize that this relatively high (0.76) correlation occurs for a subsample (4%) of the total cases that occur when AI0.7 and KV0.2. As result of the lack of statistical meaning in this result, the yearly average extinction derived from TOMS (figure 6 in Siher et al. 2004) does not reflect the real values measured in situ at the Observatory.
This correlation occurs in summertime, when the warmest winds can drive the dust to the level of the Observatory.
The non-correlation between AI satellite remote sensing data and in situ extinction data is also reported by Romero & Cuevas 2002 (see figure 3 in this paper), who compare the aerosol index (AI) provided by TOMS against the optical aerosol depth (AOD) obtained with a multifilter rotating shadow band radiometer (MFRSR) at Izaña Atmospheric Observatory (OAI) (close to the Teide Observatory, 133 km the ORM), an institution belonging to the Instituto Nacional de Meteorología (INM), now called Agencia Estatal de Meteorología (AEMET). The MFRSR measures global and diffuse radiation in six narrow band channels between 414 nm and 936 nm (with bandwidths between 10 and 12 nm).
Again, in Romero & Cuevas 2002 a low correlation coefficient is attained when the AOD is larger than 0.1 at 414.2 nm and the AI is larger than 0.5—coinciding with dust invasions taking place owing to convective processes from the African continent towards high levels—and will then be detected by both TOMS and the MFRSR. Otherwise, in dust-free conditions, there is no correlation between the in situ measurements (AOD) and AI.
The prevailing trade winds, the inversion layer presence and the abrupt orography of the western Canary islands (La Palma and Tenerife) play an important role in the downflow of dust at high elevations.
The low spatial resolution of the EP/TOMS for astronomical site evaluation explains the absence of correlation; this spatial resolution cannot distinguish local effects since it averages over a surface equivalent to an entire island (a 1 region given for TOMS Level 3 data made available in GSFC TOMS archives, i.e. 111 km 139 km); neither does it distinguish the vertical dust drainage. This effect is known as anticyclonic gloom, in many cases, even in such dust storms episodes, the airborne dust particles do not necessarily reach the level of the Observatory (more explanations in Section 2 of this paper).
It is possible to retrieve high resolution data from TOMS instrument also with the spatial resolution of the IFOV (35 km 35 km) or TOMS Level 2 data (see Bertolin 2007) in order to show that the correlation between CAMC KV and EP/TOMS AI for the ORM site on La Palma shows a little improvement when data are analysed at higher spatial resolution.
The next step in our study is to explore the use of other instruments on board different satellites that operate in bands of astronomical interest (the visible and NIR) with higher spatial resolution than TOMS and with long-term databases (longer than a few years). These instruments will provide updated high resolution images for astronomical site evaluation (to date, only TOMS data have been used for aerosol content characterization above an astronomical observatory).
5 Recent instruments on board satellites for aerosol content monitoring for astronomical site evaluation
5.1 Updated images
We have explored the use of other detectors on board different satellites that operate in bands of astronomical interest (the visible and NIR) with higher spatial resolution than TOMS.
The new generation of satellites TerraAqua/MODIS, Aura/OMI, MSG1/SEVIRI, etc.—acronyms described in Appendix II—provide better-resolution images that can be used to demonstrate the existence or otherwise of any correlation between the presence of aerosols and atmospheric extinction. Similarly to the case mentioned above (February 2000), we examine 2007 March 10, when a thick plume of dust blew over the Canary islands from the west coast of Africa.
The Moderate Resolution Imaging Spectroradiometer (MODIS) on NASA’s Aqua satellite took the picture shown in Fig. 6 for this day (with much better resolution than TOMS, see Table 1). The MODIS Aerosol (MOD04L2) product monitors the ambient aerosol optical thickness over the oceans globally and over a portion of the continents and contains data that have a spatial resolution (pixel size) of 10 km 10 km (at nadir). More information about grids and granule coverage is available in the official MODIS website (http://modis.gsfc.nasa.gov/). We can see that the eastern islands are more affected by the dust plume than the western ones. Also, the abrupt orography and the inversion layer play an important role in retaining the dust below the summits (where the observatories are located) of the highest western islands (Tenerife and La Palma). This effect is the above-mentioned anticyclonic gloom.
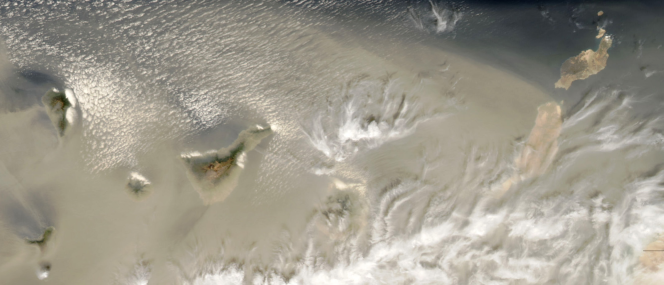
This situation has been verified by data provided by the CAMC that indicate no atmospheric extinction at all:
-
•
Extinction Coefficient in r′= 0.083 (good quality dust-free night) i.e. KV = 0.12 mag/airmass.
-
•
Number of hours of photometric data taken=10.22
-
•
Number of hours of non-photometric data taken=0.00
In the next section we summarize data retrieved from the new generation of satellites. Despite the much better spatial and spectral resolution of the recent satellite aerosol measurements (AI and AOD), they are not at the moment sufficient for the aerosol content monitoring of an astronomical observatory. In situ data are also required, in particular at those astronomical sites with abrupt orography (ORM, Mauna Kea or San Pedro Mártir). Spatial resolution of the order of the observatory area is needed.
5.2 Updated data
In order benefit from satellite data for local site characterization, we have gathered and studied NASA and ESA satellite data planned to retrieve information about aerosol, clouds, ozone and other trace gases (N2, O2, H2O, CO2, CH4) that are found in the terrestrial atmosphere. In this paper we have centred our analysis on the aerosol content.
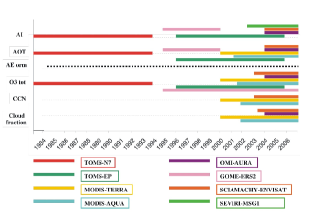
An overview of selected satellites, parameters and sampled periods is given in Fig. 7, which includes other parameters (ozone, cloud condensei nuclei (CCN) and cloud fraction) to be analysed in a future paper.
To ensure that the retrieved remote sensing data fields from different satellites (such as aerosol values or geolocation parameters) are precisely over the ORM site coordinates to compare with the atmospheric extinction by CAMC, we decided to work with Level 2 data, which have a projected effective pixel size given by the instantaneous field of view (IFOV). We have also selected the longer term database (to retrieve more data for the KV comparison). The satellites/instruments and parameters used in this work are summarized in Table 1.
The previous parameters selected and retrieved are the aerosol index (AI) provided by OMI (Ozone Monitoring Instrument) on board Aura—with visible and ultraviolet channels and with a spatial resolution from 13 km 24 km to 24 km 48 km—and the aerosol optical depth (AOD) provided by MODIS (Moderate Resolution Imaging Spectroradiometer) on board Terra (from 2000) and Aqua (from 2002)—with its 36 spectral bands, from 0.47 to 14.24 m, including two new channels 0.405 and 0.550 m, with a spatial resolution of 10 km 10 km. A detailed description of the instruments, parameters and data access url is given by Varela et al. 2007. Data from ERS-2/GOME and MSG1/SEVIRI have not been included on this work because databases are too short-term for statistical analysis, but they do offer valuable potential as instruments for the future when the database increases. The ENVISAT/SCIAMACHY database has not been used in this analysis because it does not provide higher spatial resolutions than OMI and MODIS.
| SATELLITE/INSTRUMENT | HORIZONTAL RESOLUTION | PARAMETER | PERIOD |
|---|---|---|---|
| Terra/MODIS | 1010 km2 | Aerosol Optical Depth (AOD) | from 2000 |
| Aqua/MODIS | 1010 km2 | Aerosol Optical Depth (AOD) | from 2002 |
| Aura/OMI | From 1324 km2 to 2448 km2 | Aerosol Index (AI) | from 2004 |
In Appendix I we indicate the official websites to retrieve datasets and the data formats. The correlation analysis between AI and AOD with KV is given in Section 6.
5.3 Using Aura/OMI data
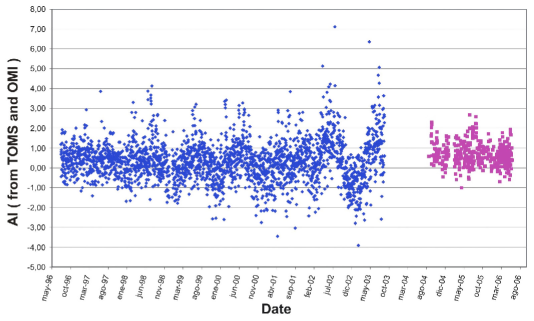
Here, we show the results of comparing AI provided by TOMS and OMI. OMI on the EOS (Earth Observing Systems) Aura platform continues the TOMS record for total ozone and other atmospheric parameters and can distinguish between aerosol types, such as smoke, dust and sulphates.
Figure 8 shows the AI values provided by EP/TOMS and OMI/Aura over the Roque de los Muchachos Observatory on La Palma. Note the dispersion in the TOMS data. This improvement shown in the OMI data (much less dispersion) derives from better horizontal and vertical spatial resolution compared with its predecessor, TOMS in Earth Probe. Moreover, TOMS data from 2002 should not be used for trend analysis because of calibration errors (http://jwocky.gsfc.nasa.gov/nes/news.html).
5.4 Using Terra/MODIS and Aqua/MODIS data
MODIS on board the NASA Terra and Aqua satellites provides not AI values but an equivalent parameter, the aerosol optical depth (AOD).
In Fig. 9 we show AOD for Terra and Aqua; we see that there exists a good relation between the maximum and minimum AOD values. The consistency of both data sets is excellent.
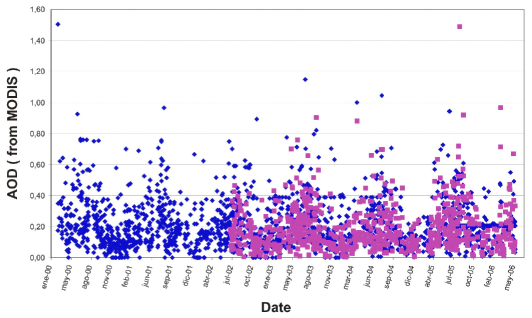
The AI threshold for dusty nights is 0.6; we now have to determine the AOD threshold for dusty events, but AI and AOD are not in a 1:1 ratio (they depend on refractive index, particle size distribution and height of the atmospheric layer).
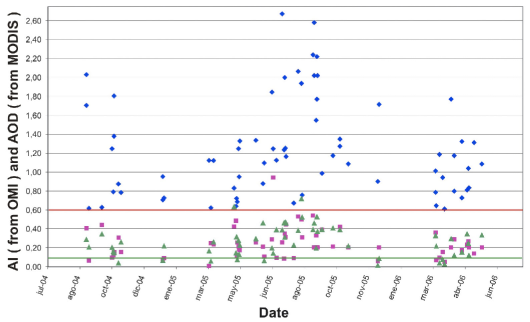
To determine the AI and AOD threshold for dusty days we used information provided in a collaboration between the Spanish Environment Ministry, the Upper Council of Scientific Researches (CSIC) and the National Institute of Meteorology (INM) for the study and analysis of the atmospheric pollution produced by airborne aerosols in Spain. They provide us with the days in which calima (dust intrusion) occurred in the Canary islands. As we later demonstrate in the plots, in our opinion, these events happened lower altitudes than those of the observatories so they do not influence the measurements of atmospheric extinction. In Fig. 10 we show AOD for Terra and Aqua and AI for OMI. AI values are larger than 0.6, and most of AOD data points for Terra and Aqua fall above a limit greater than 0.10. This limit is consistent with that provided by Romero & Cuevas (2002). Therefore, AI0.6 (0.1 units smaller than provided by Siher et al. 2004) and AOD0.1 will be the thresholds for dusty episodes.
6 Results II: comparison of AI provided by OMI and AOD provided by MODIS with KV from the CAMC
In this section we analyse the correlation between the aerosol index (AI) and the aerosol optical depth (AOD) provided by the satellites and the atmospheric extinction coefficient (KV) measured by in situ techniques (CAMC).
6.1 AI from OMI vs KV
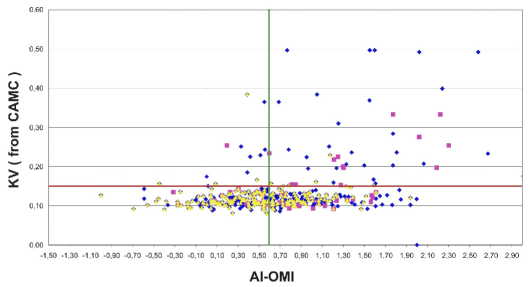
In this subsection we argue about the correlation between atmospheric extinction in (551nm) and the aerosol index measured for OMI in the same channels of TOMS (331 and 360 nm) represented in Figure 11. In order to determine whether there exists a correlation between both parameters we also consider the presence or otherwise of clouds and the situation for days with calima.
In Fig. 11 we observe an interesting situation not revealed in the same graph for the aerosol EP/TOMS index (Fig. 5). Once we put the atmospheric extinction (KV) threshold (red line) and the limit for absorbing aerosols (green line), the situation reveals four quadrants. In the first (the upper right) we have a situation with absorbing aerosol and values of atmospheric extinction over the limit of photometric dusty nights. In the second quadrant (upper left) there are no points that fall inside; this is very important because it means that non-absorbing aerosols do not influence the extinction above this threshold. In the third quadrant (bottom left) there are still non-absorbing aerosols but for clear nights, and this means that this type of sulphate and/or marine aerosol does not influence the extinction as we expect. In the last quadrant (bottom right) absorbing aerosols are again seen in the presence of low extinction values. An explanation could be the presence of weakly absorbent particles, such as carbonaceous grains or clouds, or a more complex situation with a mixture of cloudy and aerosol scenarios, or the presence of absorbing aerosols below the level of the observatory. The lack of correlation indicates that AI from OMI should not be used for atmospheric extinction characterization at the Roque de los Muchachos Observatory.
We added pink points as dust episodes of calima retrieved at the ground level, yellow being those that correspond to cloud presence (reflectivity at 331 nm greater than 15%). This plot is very informative because from the pink points we can see that these calima episodes are mainly below the threshold of dusty nights, this means that they do not affect the measurements of extinction because the calima is at a lower level with respect to the altitude of the observing site, such dusty events reaching the Roque and being detected only on some occasions. We also note that the clouds are almost all below this limit.
This means that values above the threshold of dusty nights are dust absorbing particles at the height of the observatory. We see that in this zone of the plot there are almost no clouds and some calima events that reach the astronomical site. Thanks to strong convective motions, they may be driven along the orographic contours of the caldera that borders Roque de los Muchachos. In fact, the spatial resolution of OMI ranges from 13 km 24 km to 24 km 48 km and can contain part of the caldera.
6.2 AOD from Terra/MODIS vs KV
The MODIS Aerosol Product monitors the ambient aerosol optical depth over the oceans globally and over a portion of the continents. The aerosol size distribution is also derived over the oceans, and the aerosol type is derived over the continents. Therefore, MODIS data can help us to understand the physical parameters of aerosols affecting the Canarian Observatories. Daily Level 2 data are produced at 10 km 10 km spatial resolution. Aerosols are one of the greatest sources of uncertainty in climate modelling. They vary in time and in space, and can lead to variations in cloud microphysics, which could impact on cloud radiative properties and on climate. The MODIS aerosol product is used to study aerosol climatology, sources and sinks of specific aerosol types (e.g. sulphates and biomass-burning aerosols), interaction of aerosols with clouds, and atmospheric corrections regarding remotely sensed land surface reflectance. Above land, dynamic aerosol models will be derived from ground-based sky measurements and used in the net retrieval process. Over the ocean, three parameters that describe aerosol loading and size distribution will be retrieved. There are two necessary pre-assumptions in the inversion of MODIS data: the first concerns the structure of the size distribution in its entirety and the second one log–normal modes that will be needed to describe the volume–size distribution: a single mode to describe the accumulation mode particles (radius m) and a single coarse mode to describe dust and/or salt particles (radius m). The aerosol parameters we therefore expect to retrieve from the aerosol Level 2 product are the ratio between the two modes, the spectral optical thickness and the mean particle size.
The quality control of these products will be based on comparison with ground and climatology stations.
The parameters that we have used from Level 2 in our work are: latitude and longitude as geolocation values, and AOD (aerosol optical thickness at 0.55 m for both Ocean [best] and Land [corrected] in a valid range from 0 to 3), aerosol type land that contains 0 = mixed, 1 = dust, 2 = sulphate, 3 = smoke, 4 = heavy absorbing smoke, and cloud fraction land and ocean in percentage.
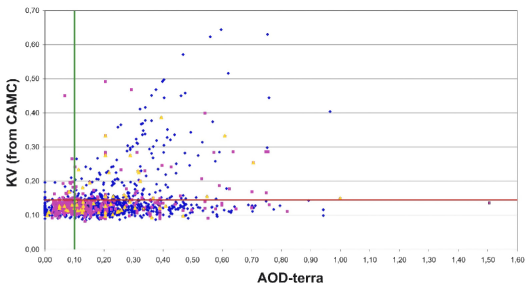
In Fig. 12 we show AOD measured by MODIS on board Terra against KV.
In this plot we find two tails of data within a certain dispersion of values, and once more the majority of points that fall under the threshold of KV smaller than 0.15. The flatter tail groups together most of the AOD values lower than 0.2, i.e. non-absorbing () or weakly absorbing aerosols (marine particles, clouds above ocean and mixed scenarios with salt, sulphate particles and clouds).
In Fig. 12 we distinguish among terrestrial aerosols (composed of a mixture of dust and smoke sulphates) and marine particles marked respectively by blue and pink points and we distinguish the presence of dust events coming from Africa (yellow points) using the data provided by INM at ground level.
We see that pink values are situated in the tails of the plots and are present mainly at lower KV and AOD values, where we expect sulphate sea-salt aerosols and CCN; only in some cases are they detected at higher AOD with small KV values, perhaps because these aerosols and clouds are below the level of the observatory. The second tail covers two quadrants corresponding to small AOD but large KV due to the presence of weakly absorbent aerosols at the level of the Observatory or to a mixture of particles and clouds, and to large AOD and large KV, mostly terrestrial aerosols at the level of the observatory. The calima (yellow points) is also below the KV threshold, perhaps because of their closeness to ground level, except for some cases in which it can reach the level of the observatory.
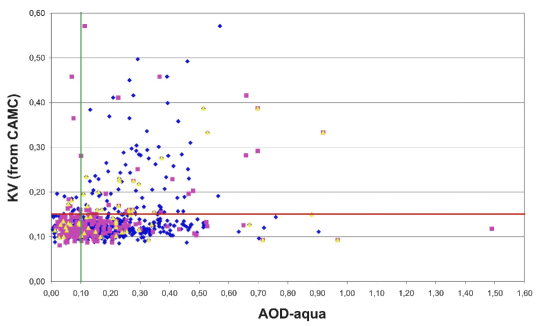
6.3 AOD from AQUA vs KV
We now perform the same analysis for the MODIS instrument on board the Aqua satellite that retrieves the same aerosol Level 2 data. In the Fig. 13 we show all the Aqua data in order to see the correlation between AOD and KV. In this case also there is evidence of the two tails with a wide dispersion in the data, here, most of the points being below the KV threshold.
We plot terrestrial (blue) and marine (pink) aerosols, the yellow points indicating days with calima. The comments are very similar to those made previously, i.e. the marine aerosols are more clustered at small AOD values in a lower tail, whereas the terrestrial values are somewhat uniformly distributed with some points at large KV indicating absorbing aerosols or clouds at the level of the observatory. Most of points fall below the threshold for dusty nights just as the majority of calima days. The interesting fact is that only the episodes of dust with large KV follow a good linear relation with the AOD.
7 Summary and Outlook
From this study we may draw the conclusions listed below.
We have compared the AI measurements provided by the TOMS on board Earth Probe satellite (Level 3) with the atmospheric extinction coefficient provided by the CAMC at the ORM (2400 m above MSL). The main causes of the lack of correlation between both parameters are:
-
•
The TOMS Level 3 data considered in this paper have a resolution of 1, so the AI is averaged over areas whose size covers the entire islands of La Palma and Tenerife. High resolution Level 2 data should be used for a better fit (IFOV of 35 km 35 km).
-
•
The TOMS is very sensitive to the presence of highly reflective clouds because it uses channels centred on the UV to measure AI. Moreover, AI incorporates absorbing particles in ranges that do not affect atmospheric transparency in the visible range.
-
•
TOMS measurements are retrieved at local noon while CAMC values are averaged over night hours.
For this reason the EP/TOMS database is not useful for the characterization of the presence of dust above either the Canarian astronomical observatories (2400 m above mean sea level) or for other high mountain sites (Mauna Kea and San Pedro Mártir).
We have explored the use of other detectors on board different satellites that operate in bands of astronomical interest (the visible and NIR) and with better spatial resolution than TOMS. The selected parameters were the aerosol index provided by Aura/OMI—with visible and ultraviolet channels and with a spatial resolution from 13 km 24 km to 24 km 48 km—and the aerosol optical depth (AOD) provided by Terra (from 2000) and Aqua (from 2002) in MODIS—with its 36 spectral bands, from 0.47 to 14.24 m, including two new channels at 0.405 and 0.550 m, with a spatial resolution of 10 km 10 km. In order ot obtain the best spatial, spectral, radiometric and temporal resolutions, we have decided to work only with Level 2 data that have the same resolution as the IFOV satellite.
We conclude that the OMI instrument detects aerosol presence with more precision than TOMS and does not detect non-absorbing particles with high atmospheric extinction values (larger than 0.15 mag/airmass). This fact coincides with expectations because non-absorbing aerosols such as sulphates or marine aerosols do not give high extinction values (threshold greater than 0.15 mag/airmass). We can see that most of points fall at lower extinction values below the threshold for dusty nights, suggesting presence of non-absorbing or weakly absorbing (e.g. carbonaceous) aerosols.
In order to obtain the limits for dusty episodes on the AOD scale, we have checked the calima days from the records of the Instituto Nacional de Meteorología de Canarias Occidental, following NAAPS, ICOd/DREAM or SKIRON models, and we obtain a threshold near AOD0.1 units and AI0.6 for dusty episodes.
We study where the calima events and cloud presence fall in the plot of correlation between atmospheric extinction and AI. Dust episodes measured at ground level are mainly below the threshold for dusty nights on the atmospheric extinction scale (KV0.15 mag/airmass), meaning that the presence of calima affects low altitudes, and that only in a few cases does it reach the Roque. We also see that all clouds detected for their high reflectivity (greater than 15%) are below the threshold for dusty nights; in only two cases are they above 0.15 unit in mag/airmass and in such cases they do not correspond to calima events.
Study of Terra/MODIS data has shown that a great number of points fall in a range below 0.40 units for AOD and 0.15 mag/airmass for KV, and that two tails are evident: the first one has high AOD values for low KV and the second has high AOD and high KV, showing a large linear correlation among both parameters. Is important to underline that there are only a few points with low AOD values and high KV (data are decontaminated of cloud presence). Chlorides and marine aerosols can be well identified and normally do not affect the KV and correspond to AOD 0.2, so this means that marine and sulphate aerosols are not absorbent as we expect. We can see that the most of points corresponding to dust (calima) events fall below the threshold of 0.15 mag/airmass because they are detected near the surface; only in certain cases can they reach the level of the observatory, carried by wind or convective motions, providing AOD larger than 0.1 units and KV larger than 0.15. These measurements correspond mostly to terrestrial aerosols.
The study of the Aqua data produces results almost identical to those of Terra. In this case there are also values at high AOD and low KV and values at low AOD and KV. This wide dispersion explains the lack of correlation between both parameters. The most populated tail falls below the threshold of 0.15 unit in mag/airmass.
Marine aerosols are more clustered at low AOD values ( 0.20) and low KV (0.15), whereas terrestrial aerosols fall in the AOD0.2 zone. Dusty (calima) days correspond mostly to the presence of terrestrial aerosols and are present near ground level (inside the area of 10 km 10 km), so they appear at low KV. Only in some cases do they reach higher altitudes and become detectable from the astronomical observations (large KV); this is the only case that presents a linear correlation between both parameters. We therefore also need in situ data to distinguish between both situations. We must explore other clues for the vertical aerosol drainage analysis (winds, humidity, etc.).
At present, the AI and AOD values provided by the NASA satellites are not useful for aerosol site characterization, and in situ data are required to study drainage behaviour, in particular at those astronomical sites with abrupt orography (ORM, Mauna Kea or San Pedro Mártir). Spatial resolution of the order of the observatory area will be required in these cases.
Moreover, in order to obain much better spatial resolution we are now exploring the use of SEVIRI-MSG2 (1.4 km 1.4 km) (December 2005–12) for Europe and Africa, and in the future, ATLID(LIDAR)-EARTHPROBE (with a horizontal sampling interval smaller than 100 m) (2012–15) for global coverage. The CALIPSO satellite will be used for measuring the vertical structure (drainage) and properties of aerosols (the horizontal and vertical spatial resolution are 5 km and 60 m respectively).
Ground measurements will be complemented by LIDAR data (INTA) of 30 m resolution (NASA MPL-NET-AERONET) and by the IAC airborne particle counter (from Pacific Scientific Instruments) installed at the ORM in February 2007 (with six channels: 0.3, 0.5, 1, 3, 5, 10 m) and by the INM Multifilter Rotating Shadowband Radiometer (MFRSR) programmed to be installed at the ORM in the near future (consisting of six narrow passbands between 414 nm and 936 nm) that will provide the size, density and vertical distribution of the aerosols.
Tests with AERONET in situ data during daytime could be very interesting to make a comparison with remote sensing satellite data.
Acknowledgments
We express our deepest thanks to the TOMS, OMI and MODIS groups from NASA Goddard Space Flight Center for aerosol index and aerosol optical depth measurements, and to the Carlsberg Meridian Circle of the Isaac Newton Group on La Palma for the coefficient extinction data. Our acknowledgments go to the Main directorate of Quality and Environmental Evaluation of the Environment Ministry, the Superior Council of Scientific Researches (CSIC) and the National Institute of Meteorology (INM) of the Environment Ministry for the information on the atmospheric pollution produced by airborne aerosols in Spain. This study is part of the site characterization work developed by the Sky Quality Group of the IAC and has been carried out within the framework of the European Project OPTICON and under Proposal FP6 for Site Selection for the European ELT. Many thanks are also due to the anonymous referee, whose comments and suggestions helped us to improve the article.
Appendix I
Format of satellite data
In this appendix we describe the format of the data for the different satellites used in this work and we indicate the urls from which to retrieve the datasets.
I.1 N7/TOMS (1984-1993)
Level 2 data are available at http://daac.gsfc.nasa.gov/data/dataset/TOMS/Level_2/N7/ and were ordered with ftp-push. NASA loaded the data onto our ftp url. These are raw data in hdf5 format that must be seen with HDFview and afterwards processed with computer programs. Level 3 aerosol data are available at ftp://toms.gsfc.nasa.gov/pub/nimbus7/data/aerosol and are already available in ftp format. These are daily average data with a resolution of 1.25∘ in longitude and 1∘ in latitude. These data are in ASCII format with 288 bins in longitude, centred on 179.375 W to 179.35 E, every bin has a 1.25∘ step. In latitude there are 180 bins centred on 89.5 S to 89.5 N with a step of 1∘. The values are in 3 digit groups, missing data being tagged 999 and the other numbers being multiplied by 10.
I.2 EP/TOMS (1996-2005)
Level 2 data are available at http://daac.gsfc.nasa.gov/data/dataset/TOMS/Level_2/EP/. The format and the data processing is the same as for Nimbus7. Level 2 data are produced with a spatial resolution of 39 km 39 km at nadir. Level 3 aerosol data are immediately available at ftp://toms.gsfc.nasa.gov/pub/eptoms/data/aerosol.
It is important to underline that the aerosol monthly average datasets are computed using only positive values (i.e. absorbing aerosol indices) of the aerosol index for each month. Values of zero are used in the averaging whenever the aerosol index is negative. The final monthly average datasets contain aerosol index values greater than or equal to 0.7.
I.3 Aura/OMI (2004-NOW)
Level 2 data with a spatial resolution of 13 24 km at nadir are available at
http://daac.gsfc.nasa.gov/data/dataset/OMI/Level2/
OMT03/.
They can be ordered via ftp-push in the same way as the others. To obtain information about effective cloud pressure and
fraction data go to http://daac.gsfc.nasa.gov/data/dataset/OMI/Level2/
OMCLDRR/.
OMTO3 provides aerosol index, total column ozone and aerosol optical thickness, as well as ancillary information produced from the TOMS Version 8 algorithm applied to OMI global mode measurements. In the global mode each file contains a single orbit of data covering a width of 2600 km. Compared to TOMS, OMI’s smaller field of view results in a larger “sea glint” per unit field of view and a correspondingly larger error in derived ozone under these conditions. The OMTO3 aerosol index is not valid for solar zenith angles greater than 60∘. Because the OMI solar zenith angles are typically higher than the solar zenith angles for TOMS at the same latitude, the OMI AI becomes invalid at somewhat lower latitudes than TOMS. This may show a cross-track dependence in the OMI AI and is not corrected by the radiance measurement adjustments (error in the AI up to 4%). Compared to TOMS, the OMTO3 Aerosol Index is 0.5 NVALUE high. Users of the aerosol index are advised to make this correction for consistency with the TOMS data record. For users not interested in the detailed information provided in OMTO3 dataset several gridded products are being developed. Initially, DAAC will grid OMTO3 data in a format identical to that used for TOMS (1∘ 1.25∘ lat/long) and will make it available through the TOMS website. However, to take advantage of the higher spatial resolution of the OMI products DAAC intends to produce higher resolution gridded products for all OMI datasets, including OMTO3.
I.4 Terra/MODIS (2000-NOW)
Level 2 data are available at
http://daac.gsfc.nasa.gov/data/dataset/MODIS/
02_Atmosphere/01_Level_2/01_Aerosol_Product/index.html.
We can order them with ftp-push. These are raw data in hdf5 format and so we must
follow a similar procedure to the one we use
with TOMS. Daily Level 2 (MOD04-Terra) aerosol data are produced at the spatial resolution of 10 10 km at nadir.
We can also retrieve data via ftp (they are already available on the web) through the url
ftp://g0dps01u.ecs.nasa.gov/MODIS_terra_Atmosphere/
MOD04_L2.004.
Level 3 data are available at http://disc.sci.gsfc.nasa.gov/data/dataset/MODIS/
02_Atmosphere/02_Level_3/.
These are different atmospheric data, daily, weekly and monthly averaged in a global 1∘ 1∘ grid.
The method to order this dataset is ftp-push: The aerosol information is stored in MOD08_D3, MOD08_E3 and MOD08_M3.
Note that in MODIS there is no aerosol index but only the aerosol optical thickness.
I.5 Aqua/MODIS (2002-NOW)
The same as for Terra/MODIS. The urls are:
http://daac.gsfc.nasa.gov/data/dataset/MODIS-Aqua/02_Atmosphere/01_Level_2/01_Aerosol_Product/
index.html
(the ftp address ftp://g0dps01u.ecs.nasa.gov/MODIS_
Aqua_Atmosphere/MYD04_L2.004) for Level 2 data and
http://disc.sci.gsfc.nasa.gov/data/
dataset/MODIS-Aqua/02_Atmosphere/02_Level_3/ for the Level 3 data.
Appendix II
AEMET Agencia Estatal de Meteorología
AEROCE Atmosphere/Ocean Chemistry Experiment
AERONET Aerosol Robotic NETwork
AI Aerosol Index
AOD Aerosol Optical Depth
AQUA Earth Observing System Post Meridian (PM)
ASCII American Standard Code for Information Interchange
ATLID ATmospheric LIDAR
AURA Earth Observing System Chemistry mission
CALIPSO Cloud-Aerosol Lidar and Infrared Pathfinder Satellite
CAMC Carlsberg Automatic Meridian Circle Telescope
CCN Cloud Condensation Nuclei
CSIC Consejo Superior de Investigaciones Científicas
ELT Extremely Large Telescopes
ENVISAT ENVIronmental SATellite
EP Earth Probe
ERS European Remote Sensing Satellites
ESA European Space Agency
EUMETSAT EUropean METeo SATellite
ENVISAT ENVironmental SATellite
FP6 Sixth Framework Programme
FTP File Transfer Protocol
GMT Greenwich Mean Time
GOME Global Ozone Monitoring Experiment
GSFC Goddard Space Flight Center
HDF Hierarchical Data Format
HTTP Hyper Text Transfer Protocol
IAC Instituto de Astrofísica de Canarias
IAU International Astronomical Union
ICoD/DREAM Dust Loading model forecast from Insular Coastal Dynamics
IFOV Istantaneous Field of View
INM Instituto Nacional de Meteorología
INTA Instituto Nacional de Técnica Aerospacial
IP Internet Protocol
L2 Level 2 data
L3 Level 3 data
KV Atmospheric extinction coefficient in V-band
LIDAR Light Detection And Ranging
MFRSR MultiFilter Rotating Shadowband Radiometer
MML Maritime Mixing Layer
MODIS Moderate Resolution Imaging Spectroradiometer
MPLNET MicroPulse Lidar NETwork
MSG Meteosat Second Generation
MSL Mean Sea Level
N7 Nimbus-7
NAAPS Navy Aerosol Analysis and Prediction System
NASA National Aeronautics and Space Administration
NEODC NERC Earth Observation Data Center
NERC Natural Environment Research Council
NIR Near Infra Red
NRT Near Real Time
NUV Near Ultra Violet
O3 Ozone
OAI Izaña Atmospheric Observatory
OMI Ozone Monitoring Instrument
OMTO3 OMI Total Column Ozone
OPTICON Optical Infrared Coordination Network for Astronomy
ORM Roque de Los Muchachos Observatory
OT Teide Observatory
SCIAMACHY Scanning Imaging Absorption SpectroMeter Atmospheric Chartography
SEVIRI Spinning Enhanced Visible and InfraRed Imager
SKIRON Weather Forecasting Model operated by University of Athens
TERRA Earth Observing System Anti Meridian (AM)
TL Troposphere Layer
TOMS Total Ozone Mapping Spectrometer
UK United Kingdom
UV Ultra Violet
References
- Bertolin, C. (2007) Bertolin, C. 2007, Utilizzo dei dati di Earth Probe per lo studio dell’estinzione atmosferica dovuto ad aerosol, Phd. Thesis, Univ. of Padova.
- Font-Tullot, I. (1956) Font-Tullot, I. 1956, Servicio Meteorológico Nacional (INM), Serie A, No.26.
- Guerrero, M.A. (1998) Guerrero, M.A., García López, R., Corradi, R.M.L., Jiménez, A., Fuensalida, J.J., Rodríguez-Espinosa, J.M., Alonso, A., Centurión, M. & Prada, F. 1998, New Astronomy Reviews, Special Issue on Site Properties of the Canarian Observatories, C. Muñoz-Tuñón Ed., Elsevier, 42, 529.
- Herman, J.R. (1997) Herman, J.R., Bhartia, B.K., Torres, O., Hsu, C., Seftor, C. & Celarier, E. 1997, J. Geophys. Res., 102, 16911.
- Huetz-de Lemps, A. (1969) Huetz-de Lemps, A. 1969, Publ. Des Lettres et des Sciences Humaines de Paris (Sorbonne). Ed. Societé d’Edition et d’Enseignement Superieur, Serie Recherche, 54, 15.
- Jiménez, A. & González Jorge, H. (1998) Jiménez, A., González Jorge, H. 1998, New Astronomy Reviews, Special Issue on Site Properties of the Canarian Observatories, C. Muñoz-Tuñón Ed., Elsevier, 42, 521.
- King, D.L. (1985) King, D.L. 1985, RGO/La Palma Technical note no. 31.
- Muñoz-Tuñón, C. (2000) Muñoz-Tuñón, C. 2002, , IAU Technical Workshop on Astronomical Site Evaluation in the Visible and Radio Range, J. Vernin, Z. Benkhaldoun & C. Muñoz-Tuñón Eds., ASP Conference Series, 266, 498.
- Muñoz-Tuñón, Vernin, & Sarazin, M. (2004) Muñoz-Tuñón, C., Vernin, J., & Sarazin, M. 2004, Proceedings of SPIE 2nd Bckaskog Workshop on Extremely Large Telescopes, Bckaskog, Vol.5382, 607.
- Muñoz-Tuñón, C., Varela, A.M. (2007) Muñoz-Tuñón, C., Fuensalida, J.J. & Varela, A.M. 2007, Rev.Mex.AA (Serie de Conferencias), 31, 36.
- Romero, P.M. & Cuevas, E. (2002) Romero, P.M. & Cuevas, E. 2002, Proceedings of 3a Asamblea Hispano Portuguesa de Geodesia y Geofísica, February 3-8, Valencia, 1.
- Romero, P.M. (2003) Romero, P.M. 2003, Proceedings of 1er Encuentro sobre Meteorología y Atmósfera de Canarias, November 12-14, Puerto de la Cruz, Tenerife, Centro de Publicaciones, Secretaría General Técnica, Ministerio de Medio Ambiente, 194.
- Siher et al (2004) Siher, E.A., Ortolani, S., Sarazin, M.S. & Benkhaldoun, Z. 2004, Proceedings of SPIE Conference on Astronomical Instrumentation and Telescopes, Glasgow, Vol.5489, 138.
- Torres et al (1998) Torres, O., Bhartia, P.K., Herman, J.R. & Ahmad, Z., J. Geophys. Res., 1998, 112, 17099.
- Torres C., Cuevas E., Guerra J.C. & Carreño (2001) Torres C., Cuevas E., Guerra J.C. & Carreño, V. 2001, V Simposio Nacional de Predicción del INM, November 20-23, Madrid, 2001.
- Torres, C., Cuevas, E. & Guerra, J.C. (2003) Torres, C., Cuevas, E. & Guerra, J.C. 2003, Proceedings of 1er Encuentro sobre Meteorología y Atmósfera de Canarias, November 12-14, Puerto de la Cruz, Tenerife, Centro de Publicaciones, Secretaría General Técnica, Ministerio de Medio Ambiente, 74.
- Varela, A.M. et al. (2007) Varela, A.M., Bertolin, C., Muñoz-Tuñón, C., Fuensalida, J.J. & Ortolani, S. 2007, Proceedings of SPIE Conference on Remote Sensing of Clouds and the Atmosphere XII, Florence, Vol.6745, 674508-1.
- Varela, A.M. et al (2004a) Varela, A.M., Fuensalida, J.J., Muñoz-Tuñón, C., Rodríguez Espinosa, J.M., García-Lorenzo, B. & Cuevas, E. 2004a, Proceedings of SPIE Conference on Astronomical Instrumentation and Telescopes, Glasgow, Vol.5489, 245.
- Varela, A.M. et al (2004b) Varela, A.M., Fuensalida, J.J., Muñoz-Tuñón, C., Rodr guez Espinosa, J.M., García-Lorenzo, B. & Cuevas, E. 2004b, Proceedings of SPIE Conference on Remote Sensing of Clouds and the Atmosphere IX, Gran Canaria, Vol.5571, 105.
- Varela, A.M. et al. (2006) Varela, A.M., Muñoz-Tuñón, C., García-Lorenzo, B. & Fuensalida, J.J. 2006, Proceedings of SPIE Conference on Ground Based and Airborne Telescopes, Orlando, Vol.6267, 62671X-1.
- Varela, A.M. et al (2002) Varela, A.M., Muñoz-Tuñón, C., Gurtubai, A., & Saviron, C. 2002, IAU Technical Workshop on Astronomical Site Evaluation in the Visible and Radio Range, ASP Conference Series, J. Vernin, Z. Benkhaldoun, C. Muñoz-Tuñón Eds., 266, 454.
- Vernin, J. et al (2002) Vernin, J., Benkhaldoun, Z. & C. Muñoz-Tuñón Eds. 2002, IAU Technical Workshop on Astronomical Site Evaluation in the Visible and Radio Range, ASP Conference Series, Vol. 266.