The ACS Nearby Galaxy Survey Treasury II. Young Stars and their Relation to H and UV Emission Timescales in the M81 Outer Disk
Abstract
We have obtained resolved stellar photometry from Hubble Space Telescope (HST) Advanced Camera for Surveys (ACS) observations of a field in the outer disk of M81 as part of the ACS Nearby Galaxy Survey Treasury (ANGST). Motivated by the recent discovery of extended UV (XUV) disks around many nearby spiral galaxies, we use the observed stellar population to derive the recent star formation histories of five 0.5 kpc-sized regions within this field. These regions were selected on the basis of their UV luminosity from GALEX and include two Hii regions, two regions which are UV-bright but H-faint, and one “control” region faint in both UV and H. We estimate our effective SFR detection limit at yr-1, which is lower than that of GALEX for regions of this size. As expected, the Hii regions contain massive main sequence stars (in the mass range 18-27 , based on our best extinction estimates), while similar massive main sequence stars are lacking in the UV-bright/H-faint regions. The observations are consistent with stellar ages 10 Myr in the Hii regions, and 16 Myr in the UV-bright/H-faint regions. All regions but the control have formed 104 of stars over the past 65 Myr. Thus, our results, for at least one small area in the outer disk of M81, are consistent with an age difference being sufficient to explain the observed discrepancy between star-forming regions detected in H and those detected exclusively in UV. However, our data cannot conclusively rule out other explanations, such as a strongly truncated initial mass function (IMF).
Subject headings:
galaxies: individual (M81) — galaxies: spiral — galaxies: evolution — galaxies: stellar content — HII regions1. Introduction
It has been shown that surface density of gas in spiral galaxies is generally an excellent tracer of the surface density of star formation, in what has become known as the Schmidt-Kennicutt law (Kennicutt 1998a). Tracking H emission in spiral galaxies out to large radii, Kennicutt (1989) and Martin & Kennicutt (2001) found a truncation that seemed to indicate the edge of the star-forming disk. This cutoff was interpreted in terms of the Toomre Q parameter (Toomre, 1964), wherein galaxy disks are unable to form stars below a critical density for instability (see also Quirk, 1972). However, recent observations from GALEX (Thilker et al., 2005; Gil de Paz et al., 2005; Boissier et al., 2007; Zaritsky & Christlein, 2007; Thilker et al., 2007) show that UV emission, commonly associated with recent star formation, does not show this same truncation in all spiral galaxies. UV emission can frequently be found in an extended disk far beyond the drop in H emission. Limited H emission is also detected in the outer disks of many of these spirals (Ferguson et al., 1998), and in similar conditions in low-density dwarf galaxies (van Zee et al., 1997). These observations raise the question of what conditions in extended UV (XUV) disks give rise to UV emission without significant Hii regions.
The relative amounts of H and UV emission are frequently used to age-date star forming regions (e.g., Stewart et al., 2000): very short lived O and early-type B stars (15 ) are required to ionize Hii regions, but significant UV emission with photon energies 13.6 eV can be produced over longer timescales (100 Myr). While XUV emission may represent current star formation, if the observed H-to-UV ratios in fact indicate a recent decline in star formation, conditions in the outer disks must have been more favorable to star formation in the period 10 Myr to 100 Myr ago than at the present.
UV-emitting stars outside star-forming regions have also been observed in nearby galaxies. An FUV census of stars in the Large Magellanic Cloud (Parker et al., 1998) indicated that only 40% of O stars in the LMC are in extended Hii regions, while 60% are in the field. These field stars are located further from OB associations than would be expected from typical velocity dispersion measurements (Parker et al., 2001), indicating they may have formed in situ.
It is possible that O and early B stars are currently forming in low-density regions, but because of lower emission measures, the H emission falls below the detection limit of current observations. Alternatively, if the Hii regions are “density-bounded” rather than “radiation-bounded,” ionizing photons could leak out (Oey & Kennicutt, 1997), suppressing the formation of Hii regions while leaving the UV/FIR emission intact. In extreme cases, enough ionizing photons may leak out to bring the H emission of the entire region below detectable levels, thus resulting in star-formation regions invisible in H. “Leakage” of photons from Hii regions may simultaneously be a mechanism for producing diffuse ionized gas (Hoopes et al., 2001).
Discrepancies between UV and H emission are most noticeable in outer disks, where the average star formation rate (SFR) is very low. Very massive stars may therefore be absent, due to statistical sampling of the initial mass function (IMF). Theory predicts that lower-mass clusters, such as the ones found in outer disks, do not form the most massive stars (e.g., Weidner & Kroupa, 2006). This effect was translated to galactic scales by Kroupa & Weidner (2003), who showed that the IMF of an entire galaxy depends on the mass function of star clusters within the galaxy, since the proportion of massive stars formed in each cluster depends on the mass of the cluster. The star formation rate of the galaxy, which determines cluster masses in this model, therefore can have an effect on the total galactic IMF (Weidner & Kroupa, 2005). Köppen et al. (2007) examined the effects of this dependence on metallicity and found consistency with observations. In this picture, the fraction of massive stars is less than that expected from an invariant, fully sampled IMF; therefore a linear relation between H emission and SFR, as is often used in deriving SFR in extragalactic observations, will systematically under-predict the SFR by as much as 3 orders of magnitude (Pflamm-Altenburg et al., 2007).
Rather than statistical underpopulation of the high mass end of the IMF, the discrepancy between UV and H emission may be due instead to true variations in the underlying IMF—stars massive enough to ionize hydrogen may not be forming at all in low density regions. Krumholz & McKee (2008) calculated that massive stars can only form when fragmentation of the cloud is suppressed, at gas column densities 1 g cm-2. This formalism can explain the differences in UV and H thresholds by directly linking the variation of the IMF to the gas density. In their simulations, they note a region in which the most massive star formed was 15 . In this case, the H emission would be less than 1% of the value expected for a standard IMF, but the UV emission would be reduced by only 50%. Therefore, a threshold would be observed in H radiation from low-density regions, but not in UV, exactly as observed in some spiral galaxies.
Recent observations of XUV emission have suggested the absence of very massive stars in low-density regions. Gil de Paz et al. (2007b) performed optical spectroscopy on Hii regions in the XUV disks of M83 and NGC 4625 and found that the spectra are best matched by models in which the photoionization is produced by single stars in the range 20-40 . Other evidence suggests that star formation in low-density regions is not an isolated phenomenon, and may even extend beyond the outer disks of high-redshift spiral galaxies. Hatch et al. (2008) detected diffuse UV intergalactic light surrounding a galaxy at . After considering and ruling out several other hypotheses for the source of the UV emission, including scattered light and stars stripped from the galaxy, they conclude that the most likely explanation is in situ star formation at large galactocentric radius, comparable to XUV disks seen nearby.
Determining whether XUV regions are consistent with known timescales for UV and H emission will reveal if the XUV phenomenon requires an explanation other than aging. Resolved stellar population studies can directly address this question by identifying the individual stars responsible for UV emission in low-density regions. As part of the ACS Nearby Galaxy Survey Treasury (ANGST, Dalcanton et al., 2008), we have obtained deep photometry of resolved stars in an outer field of M81 (Williams et al., 2008, hereafter Paper I), where the extension of a spiral arm shows UV emission. We have isolated stars in UV-bright regions and used the resulting color-magnitude diagrams (CMDs) to derive star formation histories. In §2, we describe the data and reduction; in §3, we describe our methods for determining the star formation histories and present our results; we discuss their implications in §4, and we conclude with §5.
2. Data and Photometry
The Hubble Space Telescope (HST) Advanced Camera for Surveys (ACS) observations of the M81 Deep Field were taken 2006 November 16-22. The field was observed in 9 full-orbit exposures (for a total of 24,132s) in (wide ), and 11 full-orbit exposures (for a total of 29,853s) in (equivalent to Johnson ). We also obtained a short (2100s) set of exposures in (equivalent to Sloan ). Each exposure was calibrated and flat-fielded using the standard HST pipeline. See Paper I and Dalcanton et al. (2008) for further details of the observations and data reduction.
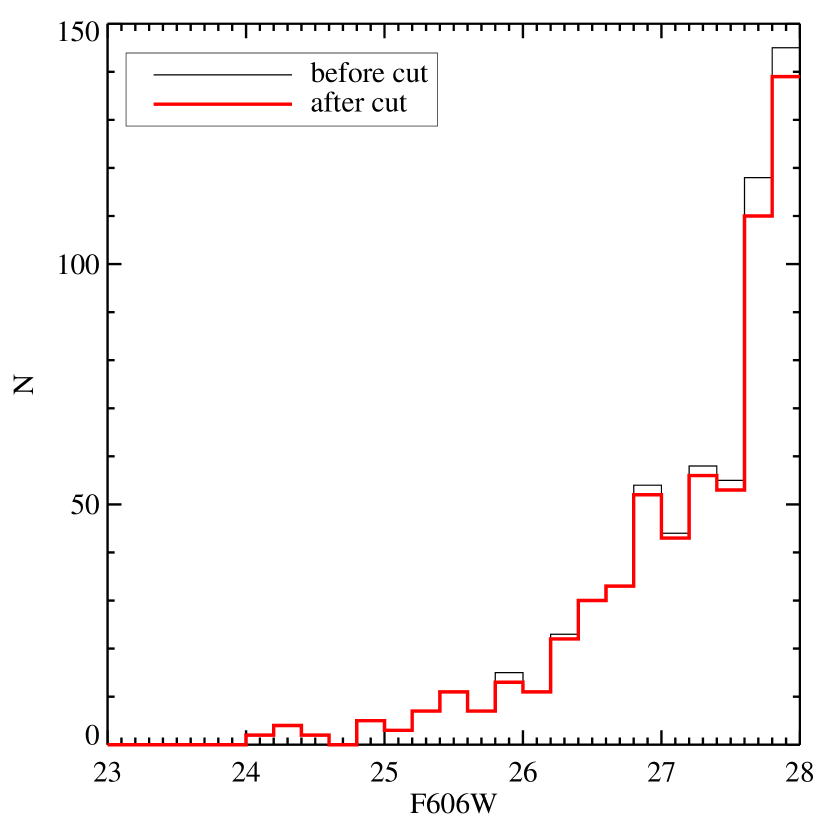
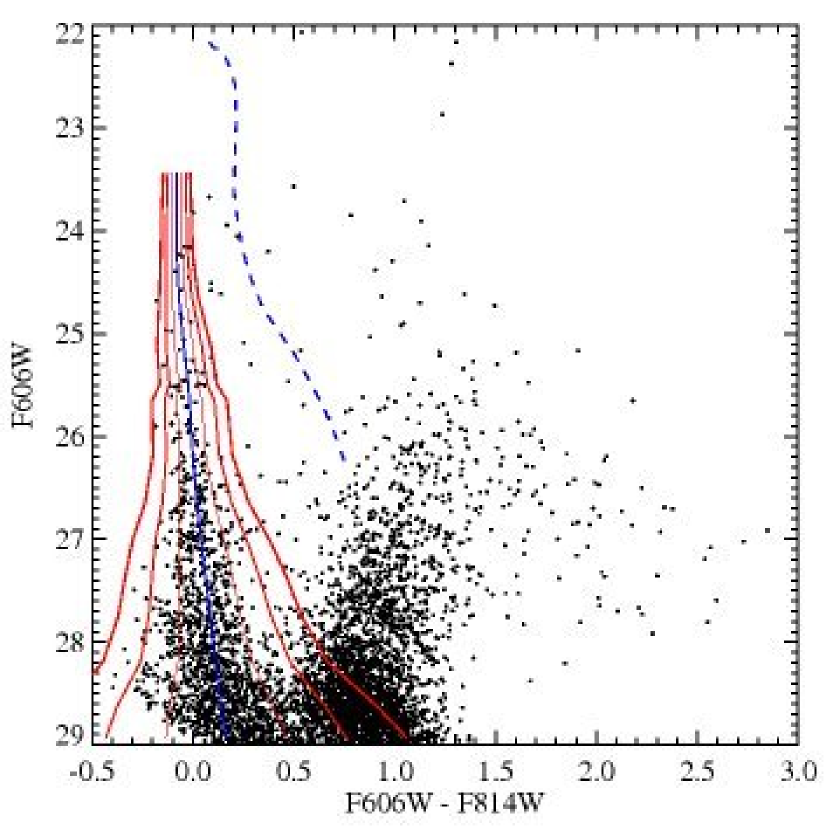
For photometry, we use DOLPHOT, a modified version of HSTphot (Dolphin, 2000) optimized for ACS. DOLPHOT fits the ACS point spread function (PSF) to all of the stars in each exposure, determines the aperture correction from the most isolated stars, combines the results from all exposures, and converts the count rates to the Vega magnitude system. As in Paper I, we require that stars in the final sample are classified as stars, not flagged as unusable, have , and have . The sharpness cuts exclude non-stellar objects (such as background galaxies) that escaped the earlier cuts. We also require . The crowding parameter, in magnitudes, is defined as how much brighter a star would have been measured if nearby stars had not been fit simultaneously. The cutoff value used in this paper is different from that in Paper I, which used a value of 0.1. We choose a higher value because an overly restrictive cut on crowding removes stars in clusters, which are precisely the young stars that we wish to detect. The value of 0.6 was selected by examining the crowding parameters for bright blue stars in our regions of interest which were otherwise excluded by the cut of 0.1. A value of 0.6 includes the stars that clearly fall on the main sequence while excluding stars with unreliable, unphysical colors (e.g., stars which are much bluer than the main sequence). Figure 1 shows a CMD of all stars detected by DOLPHOT in our five selected regions, highlighting stars that were rejected by the quality cuts described above. We confirm that we are not excluding any young stars that would affect our determination of recent star formation. Also shown is the main sequence luminosity function (MSLF) for the combination of all selected regions, both before and after the quality cuts are applied. The cuts do not significantly affect the shape of the MSLF. Details on the selection of main sequence stars will be given in §3.2.

DOLPHOT was also used to perform artificial star tests, in which individual stars are inserted into the original images and their photometry is re-measured. Artificial stars are labeled as “detected” if they were found by DOLPHOT and met the quality cuts described above. We inserted artificial stars to characterize the completeness of our sample in terms of magnitude, color, and position. The M81 Deep Field photometry is 50% complete at a magnitude of and .
GALEX FUV and NUV images of M81 were obtained from the GALEX Ultraviolet Atlas of Nearby Galaxies (Gil de Paz et al., 2007a). Regions were selected based on their UV luminosity (Figure 2). We selected four regions which are UV-bright, two of which show corresponding Hii regions, as indicated in the H image generously supplied by J. Lee, R. Kennicutt, M. Prescott, and S. Akiyama. The image was taken with the 90Prime wide-field imager on the Steward Observatory 90” telescope. The -band continuum was subtracted from the H narrowband filter to isolate the H emission; however, the H image has not been fully calibrated and thus absolute H fluxes are unavailable. Regions “UV1” and “UV2” are UV-bright but have no H emission. The final region (“noUV”) is a control, faint in both UV and H, but also located along the spiral arm extension seen in the VLA 21 cm Hi map from Adler & Westpfahl (1996) (obtained through the NASA/IPAC Extragalactic Database).
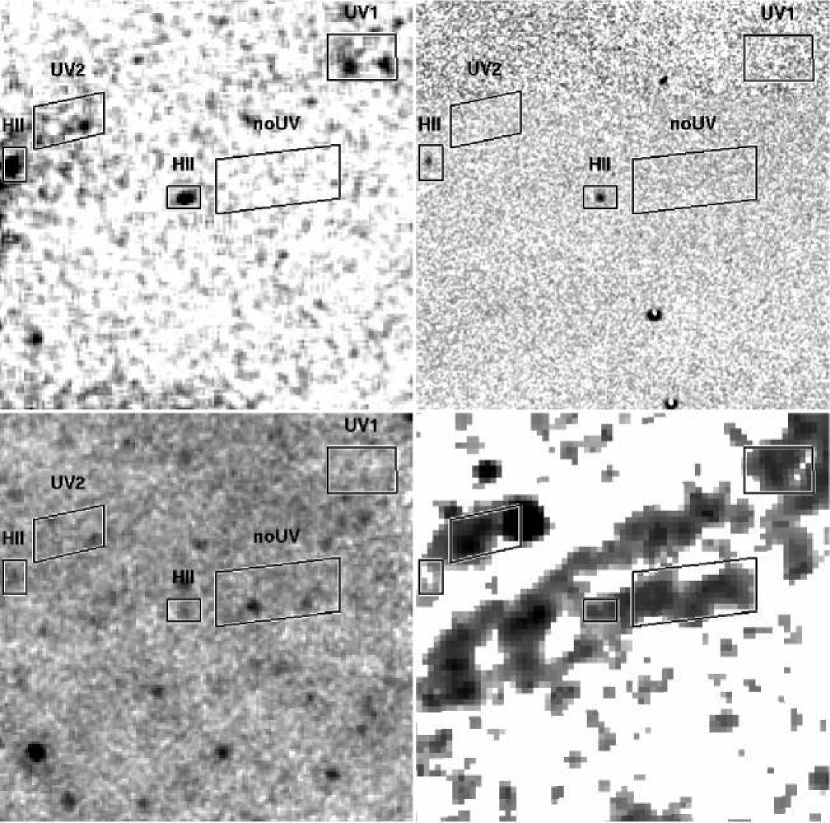
Figure 3 shows three-color () images of the selected regions with NUV contours overlaid. The Hii regions appear as diffuse green light around the brightest stars, which is due to the H emission line that falls in the filter. Blue stars in the UV1 and UV2 regions are responsible for the UV emission, while the noUV region contains only red, older stars.

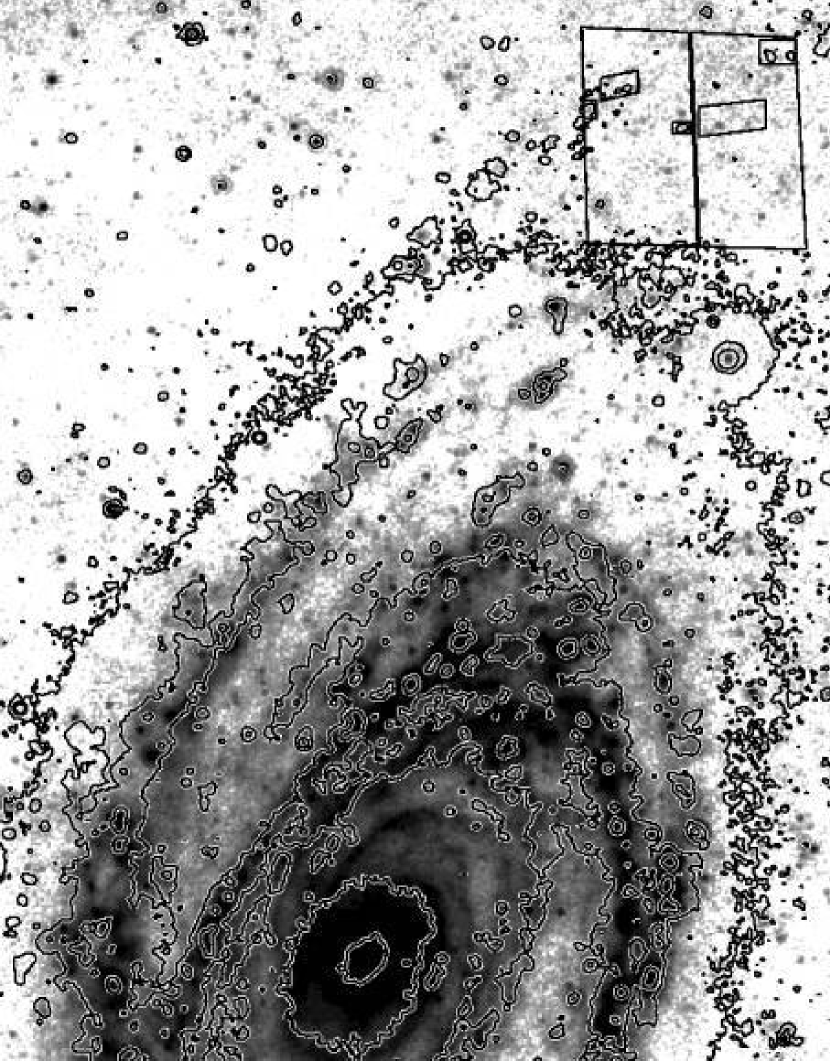
To estimate the amount of dust present in this field of M81, a 24 m Multiband Imaging Photometer for Spitzer (MIPS) image was obtained from the archive of the Spitzer Infrared Nearby Galaxy Survey (SINGS, Kennicutt et al., 2003). The 24 m image of a larger portion of M81 is shown in Figure 4, with the ACS field of view and selected regions outlined, and with NUV contours overlaid. The dust emission is near background level across the field. The bright region that falls within the noUV field is due to a close pair of dusty, interacting background galaxies. The rich Galactic cirrus structure in the area of M81 (Appleton et al., 1993) may also cause variations in extinction across the field. Dust extinction will be discussed further in §4.5.
Individual stars in each of these regions were isolated from our photometry catalogs. The CMDs of all regions are shown in Figure 5. The two Hii regions were combined into one CMD to provide enough stars to determine the combined star formation history, since each Hii region contains only a few stars. The Hii regions contain the most massive (i.e., brightest) main sequence stars, while the noUV region contains no candidate main sequence stars brighter than . A few blue helium-burning (BHeB) stars, i.e., massive stars burning helium in their cores at the bluest edge of their “blue loops,” are also present in the UV-bright regions, in between the main sequence and the red giant branch. The isochrones overlaid on the CMDs give an idea of the ages of the stars and their corresponding evolutionary stages. Isochrones are from Marigo et al. (2008) and are scaled for distance (, Tikhonov et al., 2005) and extinction (, the values derived from our analysis in §3 for the Hii, UV1, UV2, and noUV regions respectively). Masses of main sequence stars are marked.
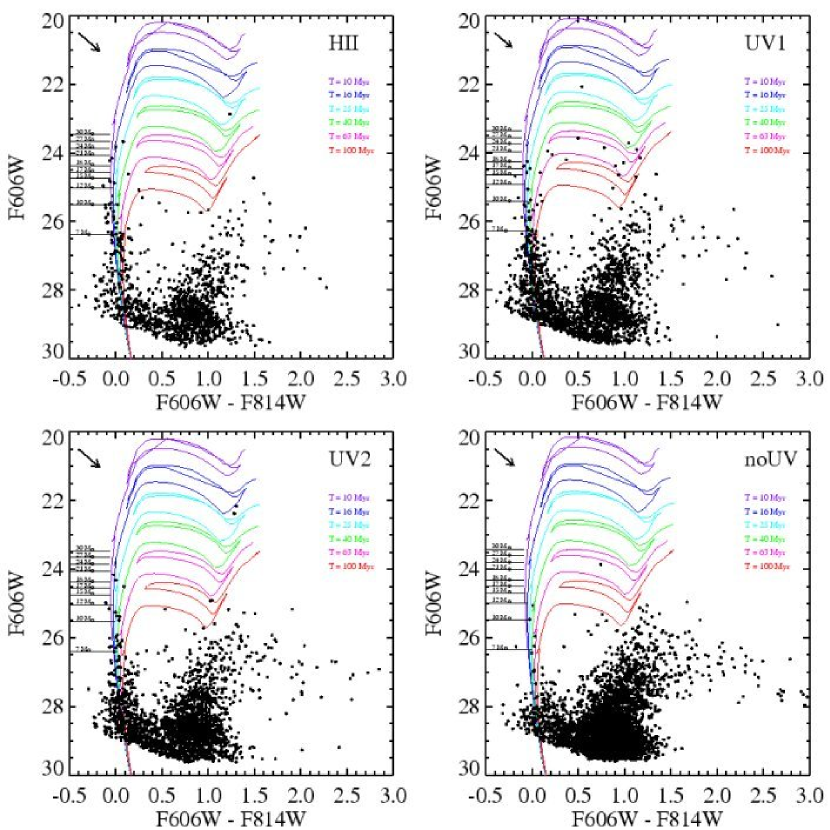
Note that in this paper we use to mean when applied to our photometry or isochrones. The conversion between extinction and reddening for the ACS filter set is taken from Sirianni et al. (2005), using the value for an O5 spectrum since the youngest stars are most likely to be affected by dust. Comparisons with in the Johnson filter set are reasonable, as .
3. Star Formation History Analysis
3.1. Description of technique
Deriving the star formation history (SFH) by comparing the observed CMD to a set of model CMDs is a well-established technique (Gallart et al., 1999; Hernandez et al., 1999; Holtzman et al., 1999; Dolphin, 2002; Skillman et al., 2003; Harris & Zaritsky, 2004; Gallart et al., 2005). While there are many different codes available, the basic procedure is the same: stellar evolution models are used to predict the properties of stars of different masses for a range of ages and metallicities. From the predicted luminosity and temperature, the magnitudes of the stars are determined for a given filter set. For each age and metallicity, stars are placed on a synthetic CMD following the mass distribution of an assumed IMF. These CMDs are then linearly combined, with distance and extinction either fixed or included as additional free parameters, until the best fit to the observed CMD is found. The ages and metallicities of the CMDs that went into the best fit tell us the ages and metallicities of the underlying stellar population, while the weights given to the CMDs provide the SFR at each age.
We use MATCH, described in Dolphin (2002), to derive the SFH for each region. This code finds the maximum-likelihood fit to the CMD assuming Poisson-distributed data. We assume an IMF with a slope of -2.35 (Salpeter, 1955) and a binary fraction of 0.35. MATCH only allows a single value for the slope of the IMF, but given that our CMD includes only stars with masses 1 , adopting a single Salpeter slope is likely to be a valid assumption. Synthetic CMDs are constructed from the theoretical isochrones of Marigo et al. (2008) for ages in the range 4 Myr - 14 Gyr. The isochrones younger than yr are taken from Bertelli et al. (1994), with transformations to the ACS system from Girardi et al. (2008). Age bins are spaced logarithmically since the CMD changes much more rapidly at young ages than at old ages.
We adopt the metallicity from Zaritsky et al. (1994), who found at the radius of the deep field. This value agrees with the results from Paper I, wherein we derived the SFHs of the entire field and found for the entire history and for ages 50 Myr. In this paper the metallicity is set at to be consistent with the observed values, while also allowing us to interpret our results with Starburst99 models (discussed in §4.2). We choose to set the value rather than allowing it to vary because the small number of stars does not allow as robust a constraint on metallicity as has resulted from the work cited above. While the chosen metallicity may be too high for the oldest stellar populations, the Paper I results indicate that this region of M81 was enriched to near this value for at least the past 1 Gyr. Uncertainty in the metallicity does not have a substantial effect on the recent SFH, since the optical color of the main sequence is not strongly metallicity-dependent. Additionally, the metallicity changes very little on the timescale of OB star lifetimes, so comparisons of the recent SFH are not substantially affected. In Figure 6 we show the location of the BHeB stars, which are sensitive to metallicity, for isochrones. Given our limited precision due to the small number of stars, the correspondence between the model location of the BHeB and the observed stars indicates that our choice of is reasonable.
As additional free parameters, the distance modulus is allowed to vary in the range (the value reported by Tikhonov et al. (2005) using the Tip of the Red Giant Branch distance method) and extinction is allowed to vary in the range . The Schlegel et al. (1998) value for Galactic extinction is , but we expect the total value to be somewhat higher due to local extinction within the disk of M81. Completeness is accounted for by including the results of the artificial star tests: we supply MATCH with the input and output magnitudes of the artificial stars and whether they were detected above the quality cuts of our photometry. The completeness does not vary across the arm extension, so we use the full sample of artificial stars that were placed within the arm extension ( stars) when deriving the SFH for each region to characterize our errors as accurately as possible. To minimize the effects of incompleteness, we only consider the portion of the CMD complete at 50% () in determining the SFH.
We binned the CMD with bins of width 0.1 mag in color and 0.2 mag in magnitude. These bins are larger than those used in Paper I, since the selected regions have relatively small numbers of stars compared with the larger regions studied in Paper I. For a small number of stars, choosing bins that are too small results in so few stars in each bin that the accuracy of the fitting suffers. Our choice of bin size reduces this problem while ensuring that the number of bins in the CMD is substantially larger than the number of free parameters in the fit.
We performed extensive testing to assess the accuracy of the derived SFH (see Paper I for further details). Monte Carlo simulations were run as follows: for each region, we sampled stars from the best fitting model CMD determined by MATCH. These stars were then given as the input to MATCH, and the resulting SFH was compared to the SFH from which they were drawn. This process was repeated 100 times, and the scatter in difference between the input and output SFHs was incorporated into the error bars in our reported SFHs for each region. Monte Carlo simulations assess uncertainties due to Poisson sampling of underpopulated regions in the CMD, but they are not sensitive to systematic uncertainties in the models themselves. However, the main sequence is a sufficiently well-understood phase of stellar evolution that we expect model uncertainties to be small. For main sequence stars, uncertainties caused by convective core overshooting and rotation are likely to affect our results, but mostly in a systematic way, changing the age scale by multiplicative factors without significantly affecting the ratios between different age bins (see, e.g., Hirschi et al., 2004).
We can estimate our detection limits for star formation by simulating SFHs with a constant SFR over the past 100 Myr, for several different values of the SFR. For each constant SFH, we sample stars from the resulting model and run MATCH to see if the SFH is recovered. We find that MATCH accurately recovers the SFH in all age bins down to SFRs of yr-1. For a typical region size of 0.3 kpc2, this corresponds to a surface density of yr-1 kpc-2.
With resolved stellar populations, we can detect lower SFRs than GALEX. Our limiting SFR of yr-1 corresponds to the GALEX SFR limit for a region of size 0.07 kpc2, approximately the size of one of the individual Hii regions. Our effective detection limit is thus lower than that of GALEX for regions larger than 0.07 kpc2. For comparison, GALEX has a surface brightness limit corresponding to a SFR of yr-1 kpc-2 (Martin et al., 2005). Moreover, given a set of stars, MATCH will detect the same SFH regardless of whether these stars are spread over 0.1 kpc2 or 1 kpc2. Unlike GALEX, our method is more sensitive at lower surface densities, since the completeness of the CMD is better in less crowded regions.
3.2. Comparing the star formation histories
The output of MATCH is the SFR and metallicity for a series of age bins, as well as the distance modulus and extinction for the entire solution. As stated above, metallicity was fixed at , and distance modulus was allowed to vary only within a very narrow range, so the SFR and extinction are our primary free parameters.
MATCH reports mean extinction values of for the Hii and UV2 regions, for the UV1 region, and for the noUV region. These values are higher than the Schlegel et al. (1998) value of , presumably due to additional extinction within the disk of M81 itself. The mean extinction values in the selected regions are slightly higher than those reported in Paper I ( for the full field and for the arm region), but it is to be expected that extinction is higher in star formation regions than when averaged across the entire field. Errors in the model zeropoints could also mimic extinction up to 0.05 magnitudes, but this effect is small compared with the observed mean extinction values.
Since H and UV emission are both insignificant for ages 100 Myr (Leitherer et al., 1999, see §4.2), we focus on the recent SFH (ages 100 Myr). The age bins in this range had boundaries at 4, 10, 16, 25, 40, 63, 100 Myr. Figure 7 shows the full SFH (SFR vs. age) for the past 100 Myr for each of our selected regions. The Hii regions show a strong burst of star formation between 10-16 Myr ago, and possible star formation within the past 10 Myr (the error bars are consistent with SFR values from zero to near that in the 10-16 Myr bin).

To give an informal estimate of our sensitivity to recent star formation, we can calculate the number of massive stars expected to remain on the main sequence for the SFRs reported by MATCH. A SFR of yr-1 in the 10-16 Myr time bin produces 5000 of stars. Assuming a Salpeter IMF for stars in the mass range 0.1-120 , 21 stars more massive than 12 are expected, of which 6 remain 10 Myr later (stars 15 have lifetimes less than 10 Myr). For a SFR of yr-1 in the 4-10 Myr bin, 6 stars in the mass range 12-30 are expected to remain on the main sequence to the present. These numbers are sufficient that we expect to be sensitive to the presence of stars 4-16 Myr old at the SFRs derived by MATCH. Note also that these recent bursts should produce large numbers of lower mass stars, and are thus partially constrained by our deep CMD.
The UV1 region, at the upper right of the field, shows higher levels of star formation than the Hii regions at earlier ages (16-25 Myr ago), but with a much lower SFR in the 10-16 Myr age bin and no star formation during the past 10 Myr. The UV2 region, adjacent to one of the Hii regions but with no detectable H emission, shows a near-zero SFR in the past 16 Myr. Unlike in the Hii regions, the error bars are consistent with no star formation in the 10-16 Myr bin for UV1 and UV2. The data empirically suggest that a small age difference of only a few Myr could be responsible for the variations in the H/UV flux ratio, although the exact times are of course governed by our choice of boundaries on the time bins in the solution. The UV-faint region has primarily an older population of stars, with only residual star formation in the past 100 Myr. Using a metallicity of increases the SFR in the 25-40 Myr age bin for all regions, but does not significantly affect the other age bins.
Error bars in Figure 7 are the quadrature sum of the systematic errors from uncertainties in distance and extinction and the 68% confidence interval from Monte Carlo tests. The general shapes of the SFHs are preserved in the Monte Carlo tests, with a declining recent SFR in UV1 and UV2 contrasting with the rising SFR in the Hii regions. The recent SFR increase in the Hii regions is less pronounced when averaged over many iterations, with fewer of the stars in the simulated CMDs estimated to be less than 16 Myr old. This is likely due to a loss of resolution in the model CMDs from which the Monte Carlo simulations are drawn, as the models are binned at 0.2 magnitude intervals. The high recent SFH depends on a very few upper main sequence stars which statistically may not be reproduced in all Monte Carlo simulations, but which clearly exist in the real data.
Another view of the history of these regions is seen in Figure 8, which shows the cumulative star formation from the past 100 Myr to the present. Regions UV1 and UV2 show most (95-100%) of the stellar mass in place by 16 Myr ago. The noUV region is consistent with a similar history, but the error bars are much larger and allow for a range of possibilities, and the total mass of stars formed in the past 100 Myr is extremely low. In the age range 4-40 Myr, the other regions formed 8-14 times more stellar mass total than the noUV region. Only in the Hii regions did a substantial fraction (40-80%) of the recent star formation occur in the past 16 Myr.

Comparison of the observed and simulated MSLFs confirm that the main sequence is being reproduced accurately on average, down to stellar classes that are well sampled at recent ages. Although MATCH fits the entire CMD, the very recent SFH is largely determined from the population of stars along the main sequence. We identify the locus of main sequence stars from the Marigo et al. (2008) isochrones (), using all stars at or below the main sequence turnoff for each age. We apply a distance modulus of and the MATCH-derived extinction value for each region.
The mean main sequence color is determined in magnitude bins of size 0.4, and we take these points as the locus of the main sequence in the CMD. Photometric errors determine the range of observed values around this locus to be considered as main sequence stars. For all detected possible main sequence stars (where the star passed our quality cuts and ), we calculate the color error of , where the “true” magnitude and color of main sequence stars is assumed to be the locus defined above. The 0.4-mag bin width was chosen so that the limit of the photometric errors formed a smooth boundary around the main sequence. All stars that fall within this boundary are considered to be main sequence stars, although some of these stars may in fact have recently turned off the main sequence. Figure 6 shows the location of the main sequence on the observed CMD, with a mean extinction value of .
We compare the observed MSLF with those measured from Monte Carlo simulations. Each simulation samples stars from the model CMD corresponding to the SFH derived in Figure 7. For each of these simulated CMDs, we identify main sequence stars in the same manner as for the observed CMDs. Figure 9 shows the MSLF for each region alongside the mean MSLF from the Monte Carlo simulations. There is some scatter, but the general shape of the luminosity functions remains the same in the sampled populations, indicating that the derived SFHs are consistent with the observed stellar populations. We find the total numbers of stars above the magnitude limits of and for each distribution (since the Monte Carlo MSLFs are means, the sum is not always an integer). The sums, shown on Figure 9, are consistent between the observed and sampled luminosity functions. This agreement is particularly important since the difference in SFH for the selected regions can hinge on a very small number of upper main sequence stars, but it must also be consistent with the well populated lower main sequence visible in deep observations. Values of slightly less than one for the mean number of upper main sequence stars also explains the discrepancy between the derived and simulated SFRs in the most recent age bins of the Hii regions, since many SFRs of zero are added into the average when an upper main sequence star is not drawn from the sample.

We compare the results of the Monte Carlo tests for the selected regions to determine in what percentage of cases an artificial CMD from one region could give rise to a SFH similar to another region (i.e., a test of the uniqueness of the SFH). For each region, we define the minimum and maximum SFRs in each bin as the lower and upper limits found by the Monte Carlo tests, respectively (an even stricter test than the 68% confidence limits that went into the SFH error bars). We then find what percentage of the Monte Carlo results from one region fall within the minimum and maximum limits of the other regions, for both the H timescale (4-16 Myr), and the UV timescale (16-100 Myr). For the H timescale, only 4% of the Hii region sample SFHs are consistent with the UV1 limits, and 5% are consistent with the UV2 limits. For the UV timescale, the Hii region SFH falls within the UV1 limits only 1% of the time, and the UV1 region SFH falls within the Hii region limits 2% of the time, so we have 98% confidence that these SFHs are unique on this timescale. Comparing the Hii regions with the UV2 region, these numbers are 2%, 10%, and 90% respectively. Comparing the UV1 and UV2 regions with each other gives 12% and 18% SFH matching and 82% confidence.
3.3. Consistency with full field
The SFH of the full M81 Deep Field is presented in Williams et al. (2008). The SFHs derived for the selected regions in this paper are fully consistent with the SFH for the full field. For the arm region only, which is where the recent star formation has taken place and which encompasses all the of the selected regions, the SFH has 1.5 /yr in the age bin 10-16 Myr, while the Hii regions have 1 /yr. Over the history of the galaxy (1-14 Gyr), the SFR average is 4-8 times the recent SFR observed in the Hii regions. Since the recent SF comes from two Hii regions, this would be consistent with, e.g., 8-16 Hii regions of comparable size present throughout the arm extension region over the history of the galaxy, or a smaller number of larger regions with a higher SFR.
4. Discussion
The SFHs we derived for the subregions of the M81 Deep Field indicate that stars were forming in the Hii regions less than 16 Myr ago, while star formation ceased in the UV-only regions at least 16 Myr ago. The UV-only regions had SFRs that were higher 20 Myr ago and declined more recently, while the Hii regions experienced a significant increase in SFR 10-16 Myr ago. In this section we employ other methods of estimating SFH and stellar population age and compare them with the SFHs derived using MATCH, and we discuss caveats of our analysis.
4.1. Consistency with CMD
We can check the derived SFH of each region with the more traditional analysis method of overlaying isochrones on the CMDs (Figure 5). While instructive, this age-dating method is sensitive only to the most massive star seen on the main sequence and does not require consistency with the full main sequence population. The magnitudes of turnoff stars of different masses are marked on the plot. Table 4.1 shows the ages of these turnoff stars and expected magnitudes for and . We see that stars of mass 12 are present on the main sequence in all UV-bright regions, but not the UV-faint field, indicating that UV emission in the M81 Deep Field is produced by stars with mass 12 . The Hii regions contain stars above the location of the main sequence turnoff for 18 stars at 7 Myr, indicating that the most recent star formation may have taken place more recently than 10 Myr ago. The UV regions contain main sequence stars just below this mass. If the brightest blue stars in the Hii regions are actually main sequence stars shifted redward by photometric errors and/or differential extinction (discussed in §4.5), rather than stellar evolution off the main sequence, these stars have a mass range of 18-27 , or possibly even higher for differential extinction values up to . The most massive star that seems certain to be on the main sequence is at 19 . For comparison, Gil de Paz et al. (2007b) find in their XUV disks that the spectra of Hii regions are consistent with emission from 20-40 stars. The smaller Hii regions in the M81 deep field appear to contain stars at the lower end of this mass range, placing them towards the bottom of the continuum of Hii region size, from giant Hii regions in spiral arms to small, faint Hii regions in outer disks (Dong et al., 2008, and references therein).
| Age | Mass | |
|---|---|---|
| (Myr) | () | (mag) |
| 4.0 | 30.0 | 23.5 |
| 4.5 | 26.8 | 23.7 |
| 5.0 | 24.0 | 23.9 |
| 5.6 | 21.5 | 24.1 |
| 7.1 | 18.2 | 24.4 |
| 7.9 | 16.7 | 24.6 |
| 8.9 | 15.4 | 24.7 |
| 15.8 | 11.9 | 25.0 |
| 22.4 | 9.7 | 25.5 |
| 39.8 | 7.0 | 26.4 |
References. — Marigo et al. (2008)
To explore possible effects due to statistical undersampling of high mass stars in low mass clusters, we estimate the maximum mass star expected in a cluster for the total mass of stars formed in each time bin. We employ the cluster mass–maximum star mass relation from Elmegreen (2000), but with the addition of an upper mass limit of 150 (Weidner et al., 2004). This combination approximates the nonlinear relation between cluster mass and maximum star mass from Weidner & Kroupa (2006). Table 4.1 shows the mass formed in each time bin (“cluster mass”) and corresponding maximum star mass for each region. This approximation is somewhat crude, given that the use of logarithmically spaced time bins means that the stars formed over a longer period of time in older time bins, and that the total mass formed is not necessarily a good approximation of the mass of an individual cluster. The mass of the most massive star is also probably overestimated in some cases, as the selected regions are likely the combination of multiple clusters. However, it does demonstrate that at the SFRs predicted for these outer disk regions, the IMF is not expected to be fully sampled, as many of the maximum masses predicted are lower than the upper mass limit of 150 . Nonetheless, we do expect the IMF to be fully sampled up to the largest mass we currently see in the regions (27 ).
| Hii | UV1 | UV2 | noUV | |||||
|---|---|---|---|---|---|---|---|---|
| Age | Cluster | Star | Cluster | Star | Cluster | Star | Cluster | Star |
| (Myr) | () | () | () | () | () | () | () | () |
| 4-10 | 1879 | 71 | 0 | 0 | 298 | 18 | 2 | 0 |
| 10-16 | 4933 | 145 | 2129 | 78 | 0 | 0 | 33 | 4 |
| 16-25 | 231 | 15 | 4911 | 145 | 4920 | 145 | 362 | 21 |
| 25-40 | 3193 | 105 | 2162 | 79 | 1892 | 71 | 467 | 25 |
| 40-63 | 478 | 26 | 2497 | 88 | 139 | 10 | 0 | 0 |
| 63-100 | 0 | 0 | 7990 | 150 | 1755 | 67 | 458 | 25 |
Note. — Cluster mass estimates at older ages may be lower limits, if a significant number of stars have diffused out of the region used for analysis. All cluster masses are based on a Salpeter IMF ().
4.2. Consistency with spectral synthesis models
Our SFHs suggest empirically that stars with age 16 Myr are responsible for H emission. We now investigate whether these implied ages are consistent with predicted H and UV luminosities from spectral synthesis modeling. We use Starburst99 (Leitherer et al., 1999) to simulate a stellar population evolving over 100 Myr. We use the same IMF as assumed by MATCH, a slope of -2.35 in the mass range 0.1-120 . The output of Starburst99 includes H luminosity in ergs s-1, which is calculated from the number of ionizing photons produced per second (assuming an ionization-bounded Hii region). We find the total FUV and NUV luminosity by convolving the full spectral energy distribution at each time step with the GALEX throughput for the FUV and NUV filters (calculated by dividing the GALEX effective area tables for each filter by the total area of the 50cm-wide telescope mirror).
Figure 10 shows the predicted H and UV luminosity and H/UV ratio for the first 40 Myr of the Starburst99 simulation, along with the main sequence turnoff mass as a function of age from the Marigo et al. (2008) isochrones. These models assume LMC metallicity () to agree with the metallicity measured in Zaritsky et al. (1994) and that which was used to derive the SFH. Using instead changes the UV emission by less than 10% for ages 50 Myr, and increases the H emission by less than a factor of two. Solar metallicity results in similarly small changes in the opposite direction. The NUV luminosity is about a factor of 2 higher than the FUV luminosity due to the greater throughput of the NUV filter in GALEX.

Of the total number of ionizing photons emitted by a stellar population over 100 Myr, 99.6% are emitted in the first 10 Myr, and 99.9% are emitted in the first 16 Myr (i.e., only 0.3% between 10-16 Myr.) The determination of the “lifetime” of an Hii region depends on the definition—at which of these time points do we consider the Hii region to be effectively extinct? Lifetime also depends on burst strength (i.e., how many stars formed in a given time)—a burst with more massive stars may well have a longer H lifetime than a smaller burst with fewer massive stars. Our data imply that H emission can be detected, albeit at very faint levels, from stars of age 10-16 Myr. In contrast, UV has a more gradual decline. Only 55% of the total NUV emission is gone by 10 Myr, 66% by 16 Myr, 76% by 25 Myr, 85% by 40 Myr, and 93% by 63 Myr. The values for FUV are only 1-3% lower. The peak at 4 Myr is due to Wolf-Rayet stars, which have strong UV flux (Leitherer et al., 1999).
To apply these models to our regions, we use our derived SFHs to determine the stellar mass produced in each age bin. To obtain the expected H and UV emission for each measured SFH, we integrate the Starburst99 fluxes for each time step that fell within an age bin, then divide by the total stellar mass (number of time steps in the sum ) to get H and UV luminosity per solar mass in each age bin. This method is essentially equivalent to assuming a constant SFR in each age bin, since the time steps from Starburst99 are linearly spaced. The cumulative emission for each age bin results from summing over the emission from all earlier age bins; the result for the most recent bin gives the total H and UV luminosity expected from each region at the present time.
The H/UV flux ratios suggest that the different SFHs measured in Figure 7 are indeed sufficient to produce a notably higher H/UV flux in the Hii regions. It is only in the most recent 16 Myr that the H luminosity of the Hii regions has risen to outstrip the other regions. In contrast, the UV luminosity in UV1 has actually been higher than in the Hii regions throughout most of the past 100 Myr, due simply to the greater number of stars formed overall. Despite the higher UV luminosity in UV1 than in UV2, both regions have H/UV ratios that have remained similar over the past 100 Myr, falling significantly below those of the Hii regions only in the past 16 Myr. For simplicity we show only the H/FUV emission in Figure 11; the H/NUV ratio is 2 lower at all ages.

We have assessed the uncertainty in these cumulative distributions by calculating the expected luminosities assuming that all the star formation within a time bin took place at either the beginning or end of the interval—i.e., the lower limit on the FUV luminosity from stars 25-40 Myr old assumes that all stars in this bin are in fact 40 Myr old, and the upper limit assumes all the stars are 25 Myr old. While there was some overlap in the allowed ranges between the Hii and UV regions, especially UV2, the H luminosity of the Hii regions would have to be near the bottom of its allowed range and the UV regions would have to be near the top of their allowed ranges to make the H/UV ratios similar.
4.3. Consistency with FUV/NUV colors
Measured UV magnitudes and colors from the five regions are presented in Table 3. Fluxes were integrated over the polygon defining each region using the polyphot task in the Image Reduction and Analysis Facility (IRAF), subtracting the sky value given in the image header. Fluxes were converted to AB magnitudes using the supplied GALEX zeropoints, and we report Poisson counting errors, including uncertainties in the region flux and the sky level. We have not corrected for Galactic extinction.
| Region | ||||
|---|---|---|---|---|
| Hii (left) | ||||
| Hii (center) | ||||
| UV1 | ||||
| UV2 | ||||
| noUV |
The GALEX magnitudes indicate that the two Hii regions have different FUV-NUV colors. Thus, our combination of the regions into one SFH may not be reasonable if the colors indicate that they have very different SFHs. On the other hand, the color difference may indicate different amounts of dust in the two regions. FUV-NUV colors of larger regions or entire galaxies have been used as an extinction estimate, particularly when deriving the extinction in UV bands (e.g., Gil de Paz et al., 2007a).
We can test for different amounts of dust in the two regions, which would artificially widen the main sequence of the combined regions and interfere with our ability to derive an accurate SFH. Inspection of the 24 m image shows very little variation in the amount of dust present in the two Hii regions (Figure 2). We confirm this by running MATCH on the two regions separately, and we find mean extinction values that are consistent across both regions and the value previously derived for the combined SFH to within 0.025 magnitudes.
Figure 12 shows the CMDs and SFHs for the two Hii regions separately. The Hii region at the left edge of the field has a combination of older and very young stars, indicated by the a SFH showing star formation at ages up to 60 Myr. The SFH of the Hii region at the center of the image indicates that the recent star formation is confined to the past 16 Myr. The main sequence in the CMD is extremely narrow, consistent with a single burst of star formation. The SFHs of the two regions reveal that the main reason behind the differing FUV-NUV colors is a difference in stellar age. As can be seen in Figure 10, FUV as measured in the GALEX bandpasses declines more rapidly than NUV, and therefore an older stellar population will have a redder FUV-NUV color than a younger stellar population.


We used Starburst99 to predict the FUV-NUV colors of the Hii regions, and found a redder color for the left Hii region than the center Hii region, agreeing with the measurements. The colors predicted by the models were 20-30% redder than the measured colors for both regions. However, there are sufficient uncertainties that go into deriving actual numbers for the FUV-NUV colors from the models that we do not think this indicates a serious conflict.
Finally, we note that adding the SFHs of the two regions gives a good approximation of the total SFH derived for the Hii regions combined (Figure 7).
4.4. Possible IMF variations
Based on the above, we find that an age difference is sufficient to explain the presence of UV and absence of H emission in selected regions in the outer disk of M81. The SFHs derived from the CMDs of these regions are consistent with star formation that ended at least 16 Myr ago for the UV-bright/H-faint regions and as recently as 10 Myr ago for the Hii regions. From the distribution of blue stars in the selected regions (Figure 3), it appears that stars in the Hii regions are still in clusters and have corresponding H emission, while stars in the regions with no H are more dispersed, consistent with being older populations.
With these few regions alone, however, we cannot conclusively rule out the possibility of a truncated or undersampled IMF. The derived SFH assumes the Salpeter IMF, so if the IMF is truncated at some upper mass limit, the derived SFH would indicate no star formation at the most recent times. The lack of very bright main sequence stars would be then interpreted as an aging effect. We experimented with varying the slope of the IMF between -2.25 and -2.45, but it made no significant difference in the derived SFHs. Changing the IMF to -1.35 reduced all SFRs by 40% while keeping the relative SFRs intact. A slope of -3.35 resulted in inferred SFRs that were nearly 17 times higher then for a slope of -2.35. Since our CMDs do not extend to low-mass stars (1), the change in the IMF at low masses, modeled as either a broken power law (Kroupa et al., 1993) or a lognormal (Chabrier, 2003), does not factor into our results. The robustness of the relative age differences in the SFH to small changes in the IMF slope indicates that our conclusions do not depend on the assumption of the Salpeter slope for the IMF.
We can also estimate the effect a truncated IMF would have on our results. Sampling the IMF should mimic the stochastic effects of massive stars being unlikely to form in regions with low SFR. However, if there is also a rigid upper mass limit above which stars could never form, the fitting code would assume that the absence of massive stars on the main sequence means the population must have aged. The SFH would then claim an older age for the stellar population than is actually the case. Short of modifying the fitting code to account for a truncated IMF, we can examine this effect by thinking of the stellar population not in terms of age, but in terms of mass. A 10 star will be in roughly the same location on the CMD regardless of whether it is 5, 10, or 20 Myr old, while a 15 star will turn off the main sequence after 10 Myr. Thus, if the SFH indicates that the youngest stars in a population are 10 Myr old, what that really means is that the most massive stars on the main sequence are 15 . Our SFH for the Hii regions is therefore consistent with a range of solutions, anywhere from current star formation with a truncated IMF of maximum mass 15 , to a slightly older population with a slightly higher upper mass limit, to a 10 Myr old population with a Salpeter IMF at high masses. Including the mass estimates from visual comparison of the observed CMDs with the magnitudes of turnoff stars, any truncation must be at greater than 20 . Including the possibility of a truncated IMF, with the upper mass limit as a free parameter, in future versions of synthetic CMD-fitting codes could allow for a distinction between the IMF-dependent solutions.
4.5. The effects of dust
MATCH cannot distinguish between foreground (Milky Way) extinction and local dust in the regions we are observing; hence our higher value for than obtained by Schlegel et al. (1998) presumably indicates that there is some extinction in M81 itself. Perusal of the 24 m image (Figure 2) does not show substantial warm dust in the outer disk. However, there may be cold dust which is not being warmed by current star formation, but which still produces extinction and/or reddening.
In the presence of dust, there are additional errors introduced by extinction that are not captured by the artificial star tests. MATCH attempts to correct for extinction by including a global extinction value (within user-specified limits) as a free parameter in the SFH derivation for each region, in addition to another parameter for differential extinction in young stars. For young stellar populations in particular, the distribution of dust may be uneven, e.g., when radiation from young stars has dissociated the dust on one side of a molecular cloud. Thus some stars may have more dust in the line of sight than others, effectively broadening the main sequence. The brightest blue star in the Hii regions is 0.2 mag redder than the main sequence; if the red color is due to extinction and this star is in fact still on the main sequence, this implies an extinction value of . Therefore, we allow MATCH to apply extinction values up to for young stars (age 100 Myr).
The observed color and width of the main sequence allow us to independently constrain the effects of extinction. The “true” magnitude and color of main sequence stars is assumed to be the main sequence derived from the Marigo et al. (2008) isochrones discussed in §3.2. The color errors for our main sequence stars appear to be unbiased in our artificial star tests, with a mean uncertainty in the measured color of . We thus expect the observed stars to be distributed evenly about the “true” main sequence. After applying an extinction value of (the mean of the values from the selected regions), the isochrones’ main sequence is well-centered on the distribution of observed main sequence stars (Figure 6), indicating that this extinction value is reasonable. We also plot the boundary defined by our measurement errors. This boundary encompasses nearly all of the spread of the main sequence, indicating that additional differential extinction is unlikely.
Although inspection of the distribution of main sequence stars appears to confirm a mean extinction value of , we also examine the effect of different extinction values on the SFH. If MATCH overestimated the extinction, stars would be interpreted as brighter and bluer than they really are, and the true stellar population might not be as young as we inferred. Stars which MATCH puts on the main sequence would in fact be older BHeB stars. We ran MATCH while constraining the extinction for each region to be 0.05-0.15 magnitudes lower than its derived value, and found substantial star formation in the 10-16 Myr bin only in the Hii regions, and no star formation in the 4-10 Myr bin in any region. The relative differences between the regions are thus preserved, even with this unreasonably large dust uncertainty.
If MATCH instead underestimated the amount of dust extinction, young stars would be interpreted as redder, and therefore older, than they really are. In such a case, stars that are currently interpreted as being BHeB stars would in fact be main sequence stars, indicating that the stellar population is in fact younger than 10 Myr. As predicted, constraining the extinction in MATCH to be 0.05-0.15 magnitudes higher than the best fit in each region enhanced recent star formation in all three UV-bright regions. The Hii regions had significant star formation in the 4-10 Myr bin, and the UV1 region had star formation in 10-16 Myr bin but little to none in the 4-10 Myr bin. Thus, regardless of the degree of extinction, the derived SFH predicts that the Hii regions are younger than the other regions.
4.6. The effects of cluster dissolution
Diffuse UV emission is not a phenomenon isolated to XUV disks. Work on determining the source of diffuse UV emission in nearby galaxies (e.g., Cole et al., 1999; Tremonti et al., 2001; Chandar et al., 2005) ruled out scattered light as a possibility, concluding that B stars are the most likely producers of the diffuse light. Combining this result with studies of the cluster luminosity function, which suggests that 70-90% of clusters disperse in the first 10 Myr (Lada & Lada, 2003; Bastian et al., 2005), leads to the suggestion that the “infant mortality” of star clusters is a likely source for the diffuse UV emission (Pellerin et al., 2007). A similar process may be taking place in XUV disks, with the rapid dispersal of star clusters favoring extended UV emission over H emission in regions with low SFR.
If stars have dispersed out of the region in which they formed, the SFR derived from the resolved stellar population would be artificially low for ages greater than the cluster dissolution time, 10 Myr. We can estimate this effect by considering the time it would take for a star to migrate out of a cluster after becoming unbound. Bastian & Goodwin (2006) estimate that stars escape with a velocity on order of the initial velocity dispersion of the cluster, a few km s-1. Since these clusters are small, we assume a velocity of 1 km s-1, which corresponds to 0.001 kpc Myr-1. If a typical star must travel at least 0.1 kpc to escape from one of the Hii regions, it would take 100 Myr to reach this distance. Since the areas selected around the UV regions are larger, the required dispersal time for those regions is even greater. Thus, cluster dissolution is unlikely to have a substantial effect on our SFHs, though it is possible that we are missing some stars from the left-hand Hii region, since the star cluster is near the edge of the ACS chip. Even if the velocities were as high as 4 km s-1, and were all directed radially outwards, it would still take 25 Myr for the stars to diffuse out of our smallest regions. This timescale is longer than the timescale over which we see substantial differences between the UV and H selected regions.
5. Conclusions
We have selected 0.5 kpc-sized regions in the outer disk of M81 based on their UV and H emission. With deep resolved stellar photometry, we have derived the SFHs in these regions by fitting the observed CMDs to synthetic CMDs based on theoretical isochrones. Our results indicate that Hii regions have a younger population of stars than regions which are UV-bright but H-faint; however, the age differences between these regions could be as small as a few Myr. The most massive main sequence stars remaining in this portion of the outer disk are found in the Hii regions. With our best estimates of extinction, the masses of these stars are in the range 18-27 . The SFH indicates that stars were forming in the Hii regions 10-16 Myr ago, and possibly even more recently. Star formation in the other UV-bright regions seems to have ceased several Myr earlier than in the Hii regions.
Using the derived SFHs and Starburst99 to estimate the expected H and UV emission from these regions, we conclude that age differences are sufficient to explain the observed H/UV ratios. However, we cannot currently rule out the effects of a truncated IMF. Distinguishing whether an upper limit on the IMF is due to undersampling for low SFRs/cluster masses or a strict density limit as in Krumholz & McKee (2008) will likely be determined by galactic, rather than extragalactic, studies.
We do not find evidence for widespread “leakage” of ionizing photons as a mechanism for suppressing the formation of Hii regions in the M81 outer disk. Where there are stars massive enough to ionize hydrogen, Hii regions are visible in both the H image and in our image, which includes the H emission line in its bandpass. However, we note that the number of regions observed is very small, and thus we cannot draw global conclusions about the presence or absence of “naked” O stars in XUV disks.
Considering the possible effects of dust on our derived SFHs, we find that while the absolute SFRs derived are by no means precise, the relative differences between the Hii regions and UV-bright/H-faint regions were preserved across all of our tests incorporating the effects of extinction. Our results demonstrate that resolved stars have the power to unveil details about the recent star formation even in small, low-density regions.
More conclusively disentangling the effects of age, density, and the IMF on star formation will require more than a single field of resolved stars. In a future paper, we will repeat this analysis for a large number of star formation regions across the entire disk of spiral galaxies observed as part of ANGST, thus bringing sufficient statistics to bear on the problem. We will be able to test the prediction of Zaritsky & Christlein (2007) that the ratio of Hii regions to UV-only regions will be approximately equal to the ratio of H to UV lifetimes, 16/100 Myr.
The outcome of these studies will have implications for the conversion of H and UV luminosities to SFRs on galactic scales. It has become common practice to convert observed luminosities at different wavelengths to SFR (Kennicutt, 1998). Recently the advent of multiwavelength surveys has allowed a more accurate description of the SFR by combining multiple star formation indicators: directly observing light from massive stars in UV, measuring the production of ionizing photons in H, and including the light gone into heating dust in the mid- to far-infrared (e.g., Calzetti et al., 2005; Iglesias-Páramo et al., 2006; Buat et al., 2007). Resolved stellar populations will be useful in calibrating SFR indicators for application to unresolved stellar populations in more distant spiral galaxies.
References
- Adler & Westpfahl (1996) Adler, D. S., & Westpfahl, D. J. 1996, AJ, 111, 735
- Appleton et al. (1993) Appleton, P. N., Siqueira, P. R., & Basart, J. P. 1993, AJ, 106, 1664
- Bastian et al. (2005) Bastian, N., Gieles, M., Lamers, H. J. G. L. M., Scheepmaker, R. A., & de Grijs, R. 2005, A&A, 431, 905
- Bastian & Goodwin (2006) Bastian, N., & Goodwin, S. P. 2006, MNRAS, 369, L9
- Bertelli et al. (1994) Bertelli, G., Bressan, A., Chiosi, C., Fagotto, F., & Nasi, E. 1994, A&AS, 106, 275
- Boissier et al. (2007) Boissier, S. et al. 2007, ApJS, 173, 524
- Buat et al. (2007) Buat, V. et al. 2007, ApJS, 173, 404
- Calzetti et al. (2005) Calzetti, D. et al. 2005, ApJ, 633, 871
- Chabrier (2003) Chabrier, G. 2003, PASP, 115, 763
- Chandar et al. (2005) Chandar, R., Leitherer, C., Tremonti, C. A., Calzetti, D., Aloisi, A., Meurer, G. R., & de Mello, D. 2005, ApJ, 628, 210
- Cole et al. (1999) Cole, A. A., Nordsieck, K. H., Gibson, S. J., & Harris, W. M. 1999, AJ, 118, 2280
- Dalcanton et al. (2008) Dalcanton, J. J., et al. 2008, ApJ, submitted
- Dolphin (2000) Dolphin, A. E. 2000, PASP, 112, 1383
- Dolphin (2002) —. 2002, MNRAS, 332, 91
- Dong et al. (2008) Dong, H., Calzetti, D., Regan, M., Thilker, D., Bianchi, L., Meurer, G. R., & Walter, F. 2008, AJ, 136, 479
- Elmegreen (2000) Elmegreen, B. G. 2000, ApJ, 539, 342
- Ferguson et al. (1998) Ferguson, A. M. N., Wyse, R. F. G., Gallagher, J. S., & Hunter, D. A. 1998, ApJ, 506, L19
- Gallart et al. (1999) Gallart, C., Freedman, W. L., Aparicio, A., Bertelli, G., & Chiosi, C. 1999, AJ, 118, 2245
- Gallart et al. (2005) Gallart, C., Zoccali, M., & Aparicio, A. 2005, ARA&A, 43, 387
- Gil de Paz et al. (2007a) Gil de Paz, A. et al. 2007a, ApJS, 173, 185
- Gil de Paz et al. (2005) —. 2005, ApJ, 627, L29
- Gil de Paz et al. (2007b) —. 2007b, ApJ, 661, 115
- Girardi et al. (2008) Girardi, L. et al. 2008, PASP, 120, 583
- Harris & Zaritsky (2004) Harris, J., & Zaritsky, D. 2004, AJ, 127, 1531
- Hatch et al. (2008) Hatch, N. A., Overzier, R. A., Röttgering, H. J. A., Kurk, J. D., & Miley, G. K. 2008, MNRAS, 383, 931
- Hernandez et al. (1999) Hernandez, X., Valls-Gabaud, D., & Gilmore, G. 1999, MNRAS, 304, 705
- Hirschi et al. (2004) Hirschi, R., Meynet, G., & Maeder, A. 2004, A&A, 425, 649
- Holtzman et al. (1999) Holtzman, J. A. et al. 1999, AJ, 118, 2262
- Hoopes et al. (2001) Hoopes, C. G., Walterbos, R. A. M., & Bothun, G. D. 2001, ApJ, 559, 878
- Iglesias-Páramo et al. (2006) Iglesias-Páramo, J. et al. 2006, ApJS, 164, 38
- Kennicutt (1989) Kennicutt, Jr., R. C. 1989, ApJ, 344, 685
- Kennicutt (1998) —. 1998, ARA&A, 36, 189
- Kennicutt et al. (2003) Kennicutt, Jr., R. C. et al. 2003, PASP, 115, 928
- Köppen et al. (2007) Köppen, J., Weidner, C., & Kroupa, P. 2007, MNRAS, 375, 673
- Kroupa et al. (1993) Kroupa, P., Tout, C. A., & Gilmore, G. 1993, MNRAS, 262, 545
- Kroupa & Weidner (2003) Kroupa, P., & Weidner, C. 2003, ApJ, 598, 1076
- Krumholz & McKee (2008) Krumholz, M. R., & McKee, C. F. 2008, Nature, 451, 1082
- Lada & Lada (2003) Lada, C. J., & Lada, E. A. 2003, ARA&A, 41, 57
- Leitherer et al. (1999) Leitherer, C. et al. 1999, ApJS, 123, 3
- Marigo et al. (2008) Marigo, P., Girardi, L., Bressan, A., Groenewegen, M. A. T., Silva, L., & Granato, G. L. 2008, A&A, 482, 883
- Martin & Kennicutt (2001) Martin, C. L., & Kennicutt, Jr., R. C. 2001, ApJ, 555, 301
- Martin et al. (2005) Martin, D. C. et al. 2005, ApJ, 619, L1
- Oey & Kennicutt (1997) Oey, M. S., & Kennicutt, Jr., R. C. 1997, MNRAS, 291, 827
- Parker et al. (1998) Parker, J. W. et al. 1998, AJ, 116, 180
- Parker et al. (2001) Parker, J. W., Zaritsky, D., Stecher, T. P., Harris, J., & Massey, P. 2001, AJ, 121, 891
- Pellerin et al. (2007) Pellerin, A., Meyer, M., Harris, J., & Calzetti, D. 2007, ApJ, 658, L87
- Pflamm-Altenburg et al. (2007) Pflamm-Altenburg, J., Weidner, C., & Kroupa, P. 2007, ApJ, 671, 1550
- Quirk (1972) Quirk, W. J. 1972, ApJ, 176, L9
- Salpeter (1955) Salpeter, E. E. 1955, ApJ, 121, 161
- Schlegel et al. (1998) Schlegel, D. J., Finkbeiner, D. P., & Davis, M. 1998, ApJ, 500, 525
- Sirianni et al. (2005) Sirianni, M. et al. 2005, PASP, 117, 1049
- Skillman et al. (2003) Skillman, E. D., Tolstoy, E., Cole, A. A., Dolphin, A. E., Saha, A., Gallagher, J. S., Dohm-Palmer, R. C., & Mateo, M. 2003, ApJ, 596, 253
- Stewart et al. (2000) Stewart, S. G. et al. 2000, ApJ, 529, 201
- Thilker et al. (2005) Thilker, D. A. et al. 2005, ApJ, 619, L79
- Thilker et al. (2007) —. 2007, ApJS, 173, 538
- Tikhonov et al. (2005) Tikhonov, N. A., Galazutdinova, O. A., & Drozdovsky, I. O. 2005, A&A, 431, 127
- Toomre (1964) Toomre, A. 1964, ApJ, 139, 1217
- Tremonti et al. (2001) Tremonti, C. A., Calzetti, D., Leitherer, C., & Heckman, T. M. 2001, ApJ, 555, 322
- van Zee et al. (1997) van Zee, L., Haynes, M. P., Salzer, J. J., & Broeils, A. H. 1997, AJ, 113, 1618
- Weidner & Kroupa (2005) Weidner, C., & Kroupa, P. 2005, ApJ, 625, 754
- Weidner & Kroupa (2006) —. 2006, MNRAS, 365, 1333
- Weidner et al. (2004) Weidner, C., Kroupa, P., & Larsen, S. S. 2004, MNRAS, 350, 1503
- Williams et al. (2008) Williams, B. F. et al. 2008, AJ, submitted
- Zaritsky & Christlein (2007) Zaritsky, D., & Christlein, D. 2007, AJ, 134, 135
- Zaritsky et al. (1994) Zaritsky, D., Kennicutt, Jr., R. C., & Huchra, J. P. 1994, ApJ, 420, 87