Swift Observations of Shock Evolution in RS Ophiuchi
Abstract
Our Swift observations of RS Oph form an unprecedented X-ray dataset to undertake investigations of both the central source and the interaction of the outburst ejecta with the circumstellar environment. Over the first month, the XRT data are dominated by emission from rapidly evolving shocks. We discuss the differences in derived parameters from those found for RXTE at early times and the evolution of the X-ray emission to much later times. It is apparent that at late times several emission components are present. We find no strong evidence of the proposed shock break-out in our data.
1 Astrophysics Research Institute, Liverpool John Moores Univ., UK
2 Department of Physics and Astronomy, University of Leicester, UK
3 School of Physics and Astronomy, University of Manchester, UK
4 School of Earth and Space Exploration, Arizona State Univ., USA
5 NASA Goddard Space Flight Center, Greenbelt, MD, USA
6 Harvard-Smithsonian Center for Astrophysics, Cambridge, MA, USA
7 Astrophysics Group, Keele University, ST5 5BG, UK
8 Centre for Astrophysics, University of Central Lancashire, UK
9 Landessternwarte, Heidelberg, Germany
10 Department of Geology and Astronomy, West Chester Univ., USA
1. Introduction
Prior to 1985, evidence for the interaction of outburst ejecta with the circumstellar environment in RS Oph came from observations of coronal lines in optical spectra, the narrowing of initially broad emission lines, and the evolution of superimposed narrow emission features (see e.g. Mason et al. 1987, and references therein). EXOSAT observations from to 251 days post-outburst in 1985 showed that RS Oph was a bright, but rapidly declining, X-ray source (Mason et al. 1987). Bode & Kahn (1985) formulated an analytical model and concluded that RS Oph evolved like a supernova remnant, but on timescales around times faster. Subsequently, O’Brien et al. (1992) developed detailed hydrodynamical models of the interaction of the ejecta with the red giant wind to derive parameters of the explosion and the circumstellar environment.
2. The First Month
Following notification of the latest outburst, our pointed Swift observations began 3.17 days after optical discovery (Bode et al. 2006). The source was already very bright in the XRT band ( c.p.s.) and had further increased in flux to c.p.s. by the time of the next observation at days. It then began a gradual decline in flux which continued until days.

During this period, the spectrum was obviously that of an emission line source superimposed on a broad continuum (see Figure 1, also Ness et al. and Nelson et al., these proceedings) which was then fitted with a high temperature thermal plasma (mekal) model. A wide range of parameter space was explored using combinations of multi-temperature components, varying abundances and absorbing columns. Ultimately it was decided to use a simplistic, first order, approach. This involved single temperature, solar abundance, fits to the data. The column was taken to comprise two components; the interstellar absorption fixed at cm-2 throughout (Hjellming et al. 1986), but with an additional column for the red giant wind overlying the shock being a free parameter. The distance to RS Oph was assumed to be 1.6 kpc. Subsequent investigation of the BAT data showed that the source was also detected at outburst in the lowest energy channel (14–25 keV, and possibly in the 25–50 keV as well – see Skinner et al. and Senziani et al., these proceedings). Extrapolation of the fits to the XRT data showed the BAT emission was consistent with these mekal model fits.
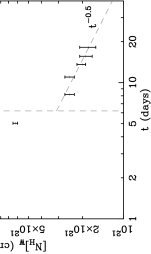
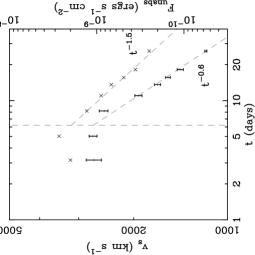
From Figure 2, it is apparent that from around 6 days after the outburst, the resulting parameters decline as a simple power-law with time. As noted in Bode et al. (2006), this behaviour is more consistent with that expected in Phase III of remnant evolution than that in Phase II, contrary to the conclusions in Bode & Kahn (1985), or the behaviour of the velocity derived by Sokoloski et al. (2006) from fits to the early RXTE data. However, we note that the later velocities derived from RXTE data do seem to fall away more steeply and that the fits to the derived fluxes show a behaviour more akin to that expected in Phase III (Sokoloski et al. 2006, see also Tatischeff and Hernanz, these proceedings).
Attention has been drawn to apparent discrepancies between fits to the XRT and RXTE data at early times. For the first epoch, RXTE and Swift observations were taken only 2 hr 20 min apart. Our fits to the combined data set found no significant changes from our initial results for the XRT alone. All subsequent data were obtained at temporally more separated epochs. It should be noted that the mekal models include both line and continuum emission, whereas the RXTE results were fitted with a thermal bremsstrahlung model, plus a superimposed Fe line, only (and also for a fixed value of the absorbing column). Other differences apart, one possibility is therefore that at early times, the electrons (giving rise to the continuum) and the ions (giving the lines) are not in thermal equilibrium, naturally explaining the differing results of the two fitting techniques. The effects of source geometry and varying abundances also need to be explored.
A change in behaviour seen in Figure 2 at around days is also apparent in the fluxes derived from the RXTE fits (Sokoloski et al. 2006). Bode et al. (2006) identified this with the end of Phase I of remnant evolution. Vaytet et al. (these proceedings) have modelled this in terms of the end of significant mass loss in a fast wind from the WD (see also Vaytet et al. 2007). Das et al. (2006) also find a change from roughly constant to power-law decline in velocities derived from infrared spectroscopy after days, and with a subsequent slope more consistent with Phase III than Phase II behaviour.
3. Late Time Evolution and Future Work
After the first month, the Super Soft Source came to dominate the spectrum and this meant that meaningful fits to any shock component could not easily be undertaken. At days, the SSS began to decline and this phase was thought to have ended at around 90 days. To explore the evolution in more detail, we split the source flux into different energy bands (see Figure 3). This clearly shows that while there was a dramatic change in the overall count rate at the time of the emergence of the SSS, taking energies above 1 keV, the gradual decline continued. There was however a change in slope evident in the 1-10 keV range after days which is not as clear at higher energies. We note that the 35s modulation in SSS flux, thought to arise from processes on the WD surface, also ceased to be detectable at days (Beardmore et al., these proceedings). The break at days is thus most likely due to a change in emission from the central source, rather than the shocked wind and there is no evidence therefore of “shock break-out”. Indeed, taking a wind velocity of 20 km s-1 blowing for the 21 year inter-outburst period with the results for the evolution of shock velocity from our fits, and shock radius at days from O’Brien et al. (2006), shock break-out would not be expected to occur before days and thus may not be observable at all.

We have undertaken spectral fitting of a range of epochs between 90 and 391 days. In all cases with sufficient source counts it appears there are at least two distinct spectral components present. We may need to perform adequate modelling of the SSS even at these times to remove this before modelling the remaining emission from the shocked wind. More realistic hydrodynamic models are being developed, including cooling (Vaytet et al. 2007) and 3-D modelling to take into account remnant structure revealed by VLBI and HST imaging (see O’Brien et al. and Harman et al., these proceedings, and Rupen et al. 2008).
Acknowledgments.
The authors are grateful to the Swift Mission Operations Center staff for their superb support of the observations reported here.
References
- Bode & Kahn (1985) Bode, M.F., & Kahn, F.D. 1985, MNRAS, 217, 205
- Bode et al. (2006) Bode, M.F., et al. 2006, ApJ, 652, 629
- Das et al. (2006) Das, R., Banerjee, D.P.K., & Ashok, N.M. 2006, ApJ, 653, L141
- Hjellming et al. (1986) Hjellming, R.J., et al. 1986, ApJ, 305, L71
- Mason et al. (1987) Mason, K.O., Cordova, F.A., Bode, M.F., & Barr, P. 1987, in RS Ophiuchi and the Recurrent Nova Phenomenon, ed. M.F. Bode (Utrecht: VNU Science Press), 167
- O’Brien et al. (1992) O’Brien, T.J., Bode, M.F., & Kahn, F.D 1992, MNRAS, 255, 683
- O’Brien et al. (2006) O’Brien, T.J., et al. 2006, Nat, 442, 279
- Rupen et al. (2008) Rupen, M.P., Mioduszewski, A.J., & Sokoloski, J.L. 2008, ApJ, in press
- Sokoloski et al. (2006) Sokoloski, J.L., Luna, G.J.M., Mukai, K., & Kenyon, S.J. 2006, Nat, 442, 276
- Vaytet et al. (2007) Vaytet, N.M.H., O’Brien, T.J., & Bode, M.F. 2007, ApJ, 665, 654