Direct-space investigation of the ultraslow ballistic dynamics of a soft glass
Abstract
We use light microscopy to investigate the aging dynamics of a glass made of closely packed soft spheres, following a rapid transition from a fluid to a solid-like state. By measuring time-resolved, coarse-grained displacements fields, we identify two classes of dynamical events, corresponding to reversible and irreversible rearrangements, respectively. The reversible events are due to the small, experimentally unavoidable fluctuations of the temperature imposed to the sample, leading to transient thermal expansions and contractions that cause shear deformations. The irreversible events are plastic rearrangements, induced by the repeated shear cycles. We show that the displacement due to the irreversible rearrangements grows linearly with time, both on average and at a local level. The velocity associated with this ballistic motion decreases exponentially with sample age, accounting for the observed slowing down of the dynamics. The displacement field due to the irreversible rearrangements has a vortex-like structure and is spatially correlated over surprisingly long distances.
pacs:
82.70.-y, 61.20.Lc, 61.43.-j, 62.20.FeI INTRODUCTION
A large variety of soft disordered materials, ranging from colloidal pastes and gels, hard-spheres suspensions, dense surfactant, copolymer or star polymer systems, exhibit very slow dynamics, often associated with physical aging, the continuous growth of relaxation times after the sample has been prepared CipellettiJPCM2005 . In this respect, these systems display intriguing analogies with molecular or polymer glasses Donth2001 and are often termed “Soft Glassy Materials” SollichPRL2007 . Analogies are also found with granular materials Pouliquen ; Dauchot ; ReisPRL2007 ; DurianNatPhys2007 close to the jamming LiuNature1998 transition: these similarities have spurred a large research activity, aiming at rationalizing the glass and jamming transitions within one single conceptual framework LiuNature1998 . Note however that the driving force for the slow dynamics is different in molecular and colloidal systems, where thermal energy dominates, and in athermal granular media, where some form of external drive is required to induce structural rearrangements.
Among soft glasses, a class of systems have emerged whose dynamics exhibit peculiar features not seen neither in molecular glass formers nor in granular media LucaPRL2000 ; KnaebelEPJL2000 ; RamosPRL2001 ; LucaFaraday2003 ; BandyopadhyayPRL2004 ; RobertEPL2006 ; BandyopadhyayReview2006 ; ChungPRL2006 ; FalusPRL2006 ; GuoPRE2007 ; CaronnaPRL2008 . They range from tenuous, diluted gels made of attractive particles, to repulsive colloidal glasses or concentrated surfactant phases. In these systems, correlation functions measured by dynamic light scattering or X-photon correlation spectroscopy decay steeper than exponentially (“compressed exponential”) and their decay time scales as the inverse scattering vector, , rather than as , as expected for a diffusive process. This suggests that the displacement of the scatterers grows linearly with time, e.g. that the slow dynamics is, on average, ballistic. Recent time-resolved light scattering experiments DuriEPL2006 on a tenuous colloidal gel, the first system for which these unusual dynamics were reported LucaPRL2000 , have shown that particle displacements are not continuous but rather result from intermittent rearrangements that affect a very large region of the sample ThesisAgnes .
In spite of the large number of scattering experiments reporting ultraslow ballistic relaxations, the ballistic nature of the dynamics and its discontinuous behavior have never been demonstrated by directly imaging the motion of particles. Direct space information PrasadJPCM2007 on the dynamics would be very valuable in order to better understand the physical origin of such unusual dynamics. It is generally proposed that ballistic dynamics stem from the relaxation of internal stress BouchaudEPJE2001 ; LucaFaraday2003 . While a plausible microscopic picture of the mechanisms through which stress may be accumulated and released has been proposed (but not directly demonstrated) for tenuous colloidal gels, a convincing explanation for concentrated systems is still lacking. In particular, it is unclear whether thermal energy alone could be responsible for significant restructuring in very dense colloidal or surfactant systems, where the elastic modulus can be a factor of larger than that of the tenuous gels.
To address some of these issues, we have recently used light microscopy to investigate the slow dynamics of a soft glass made of a compact arrangement of elastic spheres (“onions”) MazoyerPRL2006 , the same system for which ballistic dynamics were reported in previous light scattering experiments RamosPRL2001 . In Ref. MazoyerPRL2006 we used a coarse-grained method to measure two-time displacement fields in direct space. The main conclusion of this work was that the slow dynamics is due to shear deformations resulting from the experimentally unavoidable small fluctuations of the temperature imposed to the sample. Indeed, as temperature fluctuates the sample undergoes a series of contractions and elongations, because of thermal expansion. While macroscopically these deformations are fully reversible, microscopically they eventually induce irreversible rearrangements. These experiments suggested that the slow dynamics of dense colloidal systems may share more similarities than expected with sheared athermal systems. In Ref. MazoyerPRL2006 we mainly focussed on average quantities, such as the mean squared displacement and its age dependence. Here, we extend this study and provide a novel and more direct method to quantify the irreversible rearrangements, showing unambiguously that they lead to ballistic motion, both on average and at a local level. Furthermore, we investigate in detail the spatial structure of the irreversible rearrangements. We find that the displacement field is correlated over distances comparable to the system size, presenting interesting analogies with recent simulations BritoEPL2006 ; BritoJSTAT2007 of jammed spheres and experiments on very concentrated colloidal suspensions BallestaNatPhys2008 .
The paper is organized as follows. Section II describes the experimental system, the measurement procedure and the image analysis method that we have developed. In Section III, we first present the time-resolved (but spatially averaged) dynamics and then discuss the individual trajectories and the spatial structure of the rearrangements. In the last section, we discuss briefly our main findings and conclude.
II Materials and Methods
II.1 Sample preparation and optical microscopy
The structure and the phase diagram of our system have been discussed in detail in Ref. equilibriumonions : here we simply recall their main features. The sample is a surfactant lamellar phase constituted of a regular stacking of bilayers. The bilayers are composed of a mixture of cetylpyridinium chloride (CpCl) and octanol (Oct) (weight ratio ) and diluted in brine () at a weight fraction . An amphiphilic copolymer, Symperonics F68 by Serva (, where EO is ethylene oxide and PO is propylene oxide) is incorporated into the lamellar phase. At room temperature the PO block is hydrophobic and adsorbs onto the bilayers, while the hydrophilic EO blocks remain swollen in the aqueous solvent and decorate the surfactant bilayers. Upon copolymer addition, we have shown both experimentally and theoretically that a transition from a flat lamellar phase to an onion phase occurs equilibriumonions . The latter consists of a dense packing of multilamellar vesicles, or onions. Due to their polydispersity and softness, the volume fraction of the onions is one. In the experiments reported here, the copolymer-to-bilayer weight ratio is and the radius of the largest onions is about equilibriumonions .
The rheological properties of our samples can be tuned by changing the temperature, . Both the EO and PO blocks of the F68 copolymer are hydrophilic at low temperature (): the copolymer is fully soluble in water and the sample is fluid. Because the PO block becomes increasingly hydrophobic when increasing , the sample becomes gel-like at room temperature, where the PO block adsorbs onto the surfactant lamellae. The temperature behavior provides a convenient and well-reproducible way to initialize the dynamics, by rapidly quenching the sample from its low- fluid phase to the solid phase RamosPRL2001 ; RamosPRL2005 ; MazoyerPRL2006 . At room temperature, the onion phase behaves mechanically as a gel, with a storage modulus, Pa, that is nearly frequency-independent in the range Hz and roughly one order of magnitude larger than the loss modulus, .
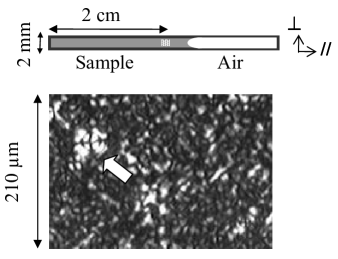
We probe the dynamics of the onion phase by means of optical microscopy. The sample is contained in a glass capillary of rectangular cross-section with thickness and width , which is flame-sealed in order to prevent evaporation. Centrifugation is used to confine the air bubble at one end of the capillary (see Fig. 1). The sample is placed in an oven (Instec) that controls the temperature to within (standard deviation of over 1 day). is measured with a thermocouple placed in direct contact with the capillary. A light microscope equipped with a 10x objective is used to image a thin slice of the sample, in the mid plane between the upper and lower wall of the capillary. The field of view is and is located in the center of the capillary, as shown in the scheme of Fig. 1. The onions are difficult to visualize using conventional optical microscopy, due to their weak refractive index mismatch with respect to the solvent, and because they are densely packed. While individual onions in diluted samples are clearly visible using differential interference contrast microscopy equilibriumonions , closely-packed onions are best visualized under crossed polarizers. Due to their birefringence and their spherical shape, they appear as dark crosses on a bright background, as can be seen in Fig. 1. We use a charge-coupled detector camera (CCD) to take images of the sample, with a delay between images of sec; each image results from an average over frames, in order to reduce the electronic and read-out noise of the CCD.
The sample is loaded in the capillary in its fluid state and the capillary is immediately placed under the microscope, in the oven regulated at . The dynamics is then initialized by a jump from to , which is performed in situ. The time needed to reach the final temperature is less than one minute. We define age as the time at which has reached its stationary value . A typical experiment lasts about 1 day: we have checked that no measurable drift of the capillary due to mechanical instabilities occurs over this time.
II.2 Image Analysis
Due to the tight packing and to polydispersity, a typical onion image consists of a highly contrasted intensity pattern, where only a few, very large onions may be individually resolved, as shown in Fig. 1. Thus, it is impossible, in general, to track the motion of individual objects. Instead, we use a method inspired by the particle imaging velocimetry (PIV) technique widely used in fluid mechanics to obtain coarse-grained displacements fields of fluids seeded with tracer particles WillertExpFluids1991 . Similar approaches specialized to the case where individual particles are not discernable, as in our case, have been termed digital imaging correlation (DIC) WesterweelMeasSciTech1997 or image correlation velocimetry (ICV) TokumaruExpFluids1995 . In these methods, a time series of images of the sample is taken, usually using a CCD camera. Each image is divided into a grid of regions of interest (ROIs), corresponding to square regions of side in the sample. The internal dynamics within a given ROI is supposed to be negligible compared to the overall drift of that ROI. In other terms, the variation of the displacement field over a distance is supposed to be much smaller than its absolute magnitude. Under this assumption, the intensity pattern of a given ROI in an image taken at time will appear to be shifted in the corresponding ROI imaged at time . The displacement can be estimated by calculating by what amount a ROI of the second image has to be back-shifted in order to maximize its resemblance with the corresponding ROI of the first image. By repeating this procedure for all ROIs, a coarse-grained displacement field is obtained.
Usually, for a given ROI the shift along the direction of columns () and rows (), is determined by searching the maximum of the spatial crosscorrelation of the intensity of the two images. With this method, the displacement is determined with a resolution of one pixel. Several schemes have been proposed to improve this resolution, e.g. by calculating the center of mass of the peak of crosscorrelation, or by fitting it to a 2-dimensional analytical function such as a Gaussian. We find that these standard approaches do not perform very well in our case, most likely due to the anisotropic shape of the correlation peak resulting from the peculiar intensity pattern in the onion images. We have therefore developed an alternative approach based on a least-square method, where we minimize , the variance of the difference between the first image, , and a shifted version of the second image, . In order to calculate the optimum shift with subpixel resolution, we use linear interpolation and define as follows:
| (1) | |||||
Here, is the intensity at time of the pixel at row and column and the corresponding quantity at time . The sum is over all pixels belonging to a given ROI. For simplicity, Eq. (2) has been written for the case , . The general case and the details of the algorithm will be discussed in a forthcoming paper.
We have performed several tests of our algorithm. First, we have checked that the gradient of the displacement field is not too high, as required by PIV-based methods. We find that the difference of the displacement field measured for adjacent ROIs is typically at most 20% of the displacement itself, thus validating our approach. Furthermore, we find that different choices of the ROI size yield consistent results, as long as is at least a few onion diameters. As one would expect, increasing the ROI size reduces the measurement noise, but results in a coarser displacement field. The best trade-off between high spatial resolution and low noise is found for , corresponding to 47 pixels. The full displacement field is then composed of ROIs, on a 12 rows 16 columns grid. To quantify the accuracy and the precision of our measurements, we have used a piezoelectric motion controller to repeatedly translate a sample by a known amount (). The measured displacement field was found to agree with the imposed one to within 80 nm in the worst case. In the following, we will take this value as the typical uncertainty of our measurements.
III Results
III.1 Time-resolved dynamics
The raw data obtained from the image analysis are two-time displacement maps, . Here, stands either for or and refers to the component of the displacement along or perpendicular to the capillary long axis (see Fig. 1). The superscript designate the -th row and the -th column of the ROI grid ( and ), and the displacements are measured between images taken at time and . Although in the following we will discuss the behavior of both components, the focus will be on , since the dynamics along the long axis of the capillary typically dominates the one in the perpendicular direction.
In addition to the local dynamics, we also analyze time-resolved global quantities, obtained by averaging over space. For each component, we define , the spatially averaged absolute displacement between time and :
| (3) |
where the sum is over the ROIs of the grid. We also introduce the corresponding spatially averaged relative displacement:
| (4) |
where is the local deviation with respect to the spatially averaged dynamics. The relative displacements are by definition positive and quantify the spatially heterogeneous character of the instantaneous displacement field. The quantities defined above are function of both the age of the sample, , and the lag between images, . In Ref. MazoyerPRL2006 has been studied as a function of : here, we fix the age of the sample and explore the evolution of the absolute and relative displacements as a function of the lag between images. Although most results presented in the following refer to a specific age, we have checked that they are representative of the general behavior of the sample.
We plot in Fig. 2a the lag dependence of the parallel absolute displacement, , for an age s and a restricted, representative range of lags. is temporally heterogenous, with intermittent peaks, whose magnitude is of the order of m. The time between these events is of the order of a few hundreds seconds. Neither the amplitude of the peaks nor their frequency appear to evolve systematically with . Indeed, the displacement averaged over a time window significantly longer than the typical time between peaks, but significantly shorter than the duration of the experiment, does not vary with time (data not shown). This indicates that the sample does not drift, and that the dynamics is stationary. In Ref. MazoyerPRL2006 we have shown that the intermittent behavior is due to small, experimentally unavoidable fluctuations of the temperature imposed by the oven. These fluctuations are of the order of and lead to elongations and contractions of the sample, due to the thermal expansions of water, the main constituent of our system. The fluctuations of the spatially averaged absolute displacement are quite peculiar. They exhibit abrupt negative-going swings, corresponding to , followed by smoother positive displacements. These features reflect the time evolution of due to the oven thermostat, which cools abruptly while heating up more smoothly. Because of the capillary geometry, fluctuations lead to an uniaxial elongation or contraction of the sample, along the axis. In agreement with a uniaxial thermally-induced expansion/compression mechanism, we measure that the absolute, spatially averaged, displacement along the axis is always very small and comparable to the measurement uncertainty (data not shown).

We show in Fig. 2b and 2c the parallel and perpendicular spatially averaged relative displacements, and , as a function of the lag, for the same lag window as that used in Fig. 2a. The small range of lags shown in Fig. 2 allow a close comparison of the three signals. The perpendicular relative displacement (Fig. 2c) increases smoothly with time, without any significant temporal fluctuation. By contrast, the parallel component of the relative displacement (Fig. 2b) exhibits intermittent peaks, whose amplitude is several tenths of m. This intermittent behavior is similar to that of the absolute parallel displacement shown in a). In MazoyerPRL2006 we have analyzed the same quantities for a fixed lag, as a function of , and have shown that the intermittent peaks of the relative and absolute displacement are simultaneous and that both are induced by temperature fluctuations. The same conclusions are reached here; note that both positive and negative peaks of are associated to positive spikes of , since the latter is by definition positive. The analysis of and vs presented here further clarifies the nature of the dynamics of the onions: while the absolute displacement fluctuates around a constant value NoteDeltaR , the parallel and perpendicular relative displacements overall increase with lag . In other words, even when the sample comes back to a previous position on average, as indicated by , the local configuration has changed, since : this proves directly the existence of irreversible rearrangement events. It is worth noting that the scenario emerging from these observation is reminiscent of the dynamics of dense emulsions or colloidal suspensions to which a periodic shear is applied HebraudPRL1997 ; PetekidisPRE2002 , although the physical origin of the motion is different. In those systems, the particle positions decorrelate as a result of an applied shear stress. In our sample, elongations and contractions due to temperature fluctuations are not spatially uniform, as we will discuss in more detail in Sec. III.2. Therefore, they result in a shear deformation analogous to that experienced by the systems in HebraudPRL1997 ; PetekidisPRE2002 . In the experiments described in HebraudPRL1997 ; PetekidisPRE2002 , not all emulsion droplets or colloidal particles recover their initial position when the applied stress is removed, because some plastic rearrangements have occurred. Similarly, the configuration of our system is permanently changed after several contraction/elongation cycles, because irreversible rearrangements have occurred.
In order to characterize the irreversible rearrangement events, for a given we identify the lags for which the absolute parallel displacement is null. For these lags, we expect no contribution to the displacement field due to the shear induced by contraction or elongation, since the sample is globally undeformed. Hence, any local displacement can be attributed exclusively to irreversible rearrangements. In practice, we identify the lags for which m, where the range of accepted absolute displacements is chosen equal to the measurement uncertainty. These lags are marked by triangles in Fig. 2. We find that all the symbols lie on the “baseline” of , indicating that this procedure indeed identifies only those lags for which the change in sample configuration is minimal, i.e. lags for which no extra contribution due to a transient shear is present.
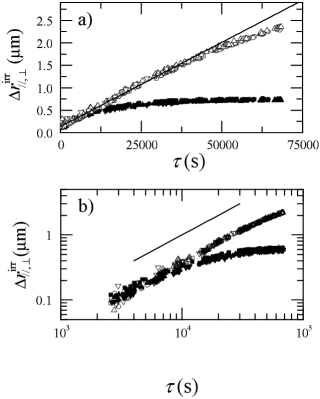
We show in Fig. 3 the lag-dependence of the relative displacements both parallel, , and perpendicular, , to the long axis of the capillary for the irreversible events alone. Different symbols correspond to data analysis performed for four close but distinct sample ages in the range 15030 s 16140 s. The four sets of data nicely collapse onto two unique curves. Remarkably, we find that, up to s, i.e. over more than a decade in time, varies linearly with the lag. A fit with a straight line, , is shown in Fig. 3a. We find m, of the order of the measurement uncertainty. Thus, up to experimental uncertainties, the initial growth of is proportional to : the ultraslow motion associated with irreversible rearrangements is ballistic. For the data of Fig. 3, taken at sample ages from s to s, we find . The ballistic nature of the dynamics for not too long lags is robust: indeed, ballistic motion is measured for all sample ages for lags shorter than s. As shown in Fig. 4, decreases decreases steadily with sample age, . An exponential decay, with a characteristic decay time of s, can fit the data, although experimental measurements over a larger range of sample ages would be required to better characterize the functional form of the decrease. In Ref. MazoyerPRL2006 the contribution of the irreversible events to the overall dynamics has been estimated using a different method, which led to similar conclusions: the irreversible dynamics is ballistic, with a characteristic velocity that decays nearly exponentially with sample age. The decay time of found here is about twice as large as the one ( s) evaluated in MazoyerPRL2006 , probably due to the difference in the analysis method. The analysis of and vs presented above shows that the typical frequency of the contracions/elongations causing the irreversible rearrangements does not change with , as expected for a mechanism driven by externally imposed temperature fluctuations. We thus conclude that the aging revealed by the decrease of must be due to a decrease of the amplitude of the displacement associated with each event.

The departure of from a straight line for lags larger than s (see Fig. 3) is due to the slowing down of the dynamics, and the decrease of the velocity with sample age. The slowing down of the dynamics is more pronounced in the perpendicular direction than in the parallel direction. Indeed, a saturation of at a value of about is observed for lags larger than s, while no saturation is observed for over the duration of the experiment.
III.2 Individual trajectories and spatial structure of the dynamics
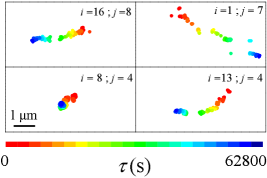
The ballistic motion discussed so far has been inferred from the behavior of , a quantity that is spatially averaged. To better characterize the irreversible events, we analyze also the time evolution of the local relative displacements. To this end, we study the trajectory of individual ROIs, where only delays corresponding to irreversible events are considered. Representative trajectories located at different positions in the grid of ROIs are shown in Fig. 5, where the displacements relative to the position at s are plotted as color-coded circles, according to the lag . We find that all trajectories are close to straight lines, the main changes between different ROIs being the length of the trajectory and its orientation, i.e. the magnitude and the orientation of the local velocity.
To quantify our observations, we evaluate for all ROIs the correlation between the direction of the relative displacement between times and and that between times and (see inset of Fig. 6b). More specifically, we calculate
| (5) |
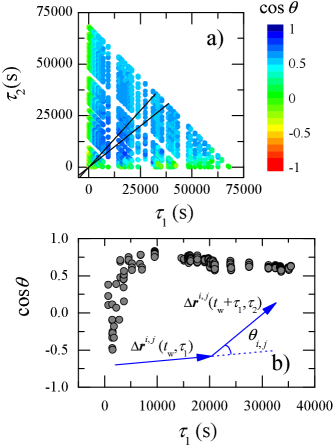
and its average over all ROIs, . If the trajectories were random walks, would be distributed between and , and its average value would be close to zero. By contrast, for ballistic motion we expect close to . We plot in Fig. 6a the value of , in the plane . The color-coded map shows that, except for small or small for which results are dominated by experimental uncertainties, the value of is always larger than , suggesting a strong correlation of the direction of motion over long time scales.
We now consider the case of two successive displacements with approximately the same duration, hence . We thus show in Fig. 6b we show for . The data are obtained from the points in Fig. 6a that lie in between the two straight lines shown in the figure. At short lags, for which and are not significantly different from the experimental uncertainties, varies randomly between and before reaching rapidly a plateau of height for s, corresponding to an average angle of deg. The maximum value for is , for s (corresponding to an angle of deg). The slightly decreasing trend above s is due to the saturation of at large (Fig. 3), which is associated with a kink in individual trajectories, as shown in Fig. 5. Overall, is close to unity, indicating that the direction of motion persists over long times (as long as the duration of the experiment). This analysis demonstrates that the motion is ballistic not only when averaged over the whole field of view, but also at a local level, since most individual ROIs move in a well defined direction and exhibit trajectories close to straight line over the whole duration of the experiment.
What is the spatial structure of the displacement field associated with such ballistic dynamics? By examining a large number of displacement fields for all ages and all delays, we find that generally they can be divided in two classes. The first one corresponds roughly to a shear deformation along the long axis of the capillary, as shown in Fig. 7a. This displacement pattern is associated with a significant elongation or contraction of the sample; thus it corresponds to the transient, reversible peaks of the relative displacement. The second class is characterized by a vortex-like (or compression-like) structure, as seen in Fig. 7b. Note that, since the sample is actually incompressible, Fig. 7b suggests that some motion may occur in the direction perpendicular to the plane that is imaged. In contrast to the shear-like deformation, this pattern is quite isotropic and implies non-negligible displacements along the direction. The events that have been previously identified as irreversible are typically associated with a relative displacement field of the second kind. The overall pattern of the displacement fields associated with irreversible events does not significantly vary with time, as expected from the analysis of the individual trajectories, which are all very close to straight lines.

From our analysis, we can conclude that the -induced, intermittent events and the ballistic irreversible rearrangements can be associated to distinct, specific structures of the relative displacement field. The former correspond to the (anisotropic) shear deformation of the sample along the capillary axis (Fig. 7a), while the latter correspond to nearly isotropic, compression-like displacement fields (Fig. 7b). Both structures are correlated over distances comparable to the field of view. We have checked that they do not exhibit significant changes with sample age, as expected from the ballistic motions of the individual ROIs.
IV Discussion and conclusion
We have used optical microscopy to study the slow dynamics of closely packed onions, a soft glassy material. Two classes of dynamical events have been identified: reversible and irreversible rearrangement. We have shown that the reversible, intermittent peaks of relative displacement are due to the contraction or elongation of the sample, due to temperature fluctuations, and correspond to a shear deformation along the long axis of the capillary. The origin of the shear associated with thermal expansion or contraction remains somehow unclear. It may be due to the curvature of the meniscus at the interface between the free end of the sample and the air bubble. It may also stem from small thermal gradients in the sample, close to the capillary wall. Indeed, portions of the sample close to the lateral wall are in better thermal contact with the oven, with respect to the central region. Therefore, they may react faster to any small change in and lead to a larger elongation or contraction, as we observe in our experiments. We thus expect the precise spatial structure of the displacement fields to depend on the sample geometry (e.g. to be different in a microscopy capillary, a light scattering cuvette, and a Couette cell for rheology measurements), but the effect of fluctuations should be relevant in all experimental configurations.
The second class of dynamical events are the irreversible rearrangements, presumably occurring as the result of repeated shear cycles. They correspond to a nearly isotropic displacement field that is spatially correlated over very large distances. The motion resulting from these ultraslow rearrangements is ballistic, with a velocity that decreases exponentially as the sample ages. We believe that these irreversible events occur at all times, presumably even when they are masked by larger, transient shear events caused by temperature fluctuations.
Below, we discuss shortly the main features of the irreversible rearrangements and finally comment on the role of the temperature fluctuations as the driving force for the slow dynamics.
IV.1 Ballistic motion and aging
We have shown that the amplitude of the relative displacements is proportional to the lag, , hence proving directly the ballistic nature of the ultraslow motion. A similar ballistic motion has been invoked to explain the slow dynamics of a variety of soft glassy materials probed by light and X-photon scattering techniques LucaFaraday2003 ; RamosPRL2001 ; BellourPRE2003 ; BandyopadhyayPRL2004 ; ChungPRL2006 ; RobertEPL2006 ; GuoPRE2007 , including the very same onion sample investigated here RamosPRL2001 . To the best of our knowledge, our experiments are the first proof in direct space of ballistic motion in the slow relaxation of a glassy material. Below, we provide simple scaling arguments to understand the order of magnitude of the ballistic velocity measured experimentally.
In Ref. RamosPRL2005 , we have presented a model to rationalize the dynamical behavior of the onion glass, speculating that motion results from the combined action of viscous forces and internal elastic stress. We briefly recall the main features of the model: regions of size containing several onions move under the action of elastic forces due to the relaxation of internal stresses and experience a viscous drag. The driving force due to the relaxation of internal stress is , where is the elastic stress, the elastic modulus, and the strain. Stokes’ law gives the viscous force: where is a geometrical factor of order that depends on the shape of the region, the effective viscosity of the medium, and the velocity of the region. By balancing the viscous and the elastic force and solving for , one obtains
| (6) |
We calculate using experimental values for , , and . To estimate the order of magnitude of the strain, we consider the irreversible displacement fields measured experimentally and take the difference of the relative displacement between a ROI for which it is close to and one for which it is maximum (about m for s). The typical distance between these two ROIs is about , yielding . In our microscopy measurements, we probe the motion of ROIs of size , so we set . We take for the value of the effective viscosity deduced from step strain relaxation measurements RamosPRL2005 , for an age s, and take Pa as measured by linear rheology equilibriumonions . Using Eq. (6), we then find with typically of the order of ten. This result is in very good agreement with measured by light microscopy.
It is interesting to compare to , the ballistic velocity obtained in RamosPRL2005 from the analysis of DLS data for the same sample. For an age s we found in RamosPRL2001 , about two orders of magnitude lower than measured, at the same age, by light microscopy. Several factors may be invoked to explain the large difference. First, the dynamics is not probed on the same length scale in the two experiments: here, the relevant length scale is , the ROI size. In the DLS experiment, by contrast, the motion is probed on a much smaller length scale, set by the inverse scattering vector and of the order of . Furthermore, the microscopy experiments point to the role of -induced strain fields as the driving force for the slow rearrangements. In this scenario, the latter most likely vary with both the frequency and the amplitude of the transient strain, which depend on experimental conditions such as the cell size and geometry and the temperature control, different in microscopy and DLS measurements. More experiments, e.g. varying the cell geometry, would be useful to clarify this issue.
The slowing down of the dynamics with sample age, a feature typical of glassy dynamics, is reflected here by the decrease of with . is a global quantity, averaged over both space and time. Its decay may a priori stem from one or more distinct mechanisms: a decrease of the rate at which rearrangements occur, a reduced average displacement associated with each rearrangement, or a smaller size of the volume affected by a single rearrangement. Our space- and time resolved measurements rule out the former and the latter hypothesis: rearrangements occur at the same rate, imposed by the characteristic time of the temperature fluctuations of the oven, and affect essentially the same (large) portion of the sample at all ages. Experiments on concentrated colloidal hard spheres CourtlandJPCM2003 have reached a somehow similar conclusion: the size of the “clusters” formed by the fastest moving particles did not evolve significantly during aging (Note that these clusters contained just a few particles, in contrast to the very long-ranged dynamical correlations observed here). A few simulation studies have addressed the issue of the age dependence of the correlation length of the dynamics, yielding a different answer: the correlation length was found to grow with both in a Lennard-Jones CastilloNatPhys2007 ; Parseiancondmat2006 and a spin glass KiskerPRB1996 ; BerthierPRB2002 . More experiments and simulations will be needed to understand these discrepancies.
IV.2 Long-ranged spatial correlations of the slow dynamics
We have shown that the relative displacement fields associated with the irreversible events exhibit surprisingly long-ranged spatial correlations, comparable to the size of the field of view, thus much larger than the onions’ size. This result is strikingly different from previous experimental and numerical determinations of the size of dynamical heterogeneity, which generally are of the order of a few particle sizes, e.g. in dense colloidal hard spheres WeeksScience2000 ; WeeksJPCM2007 ; BerthierScience2005 , granular materials DauchotPRL2005 ; DurianNatPhys2007 ; LechenaultEPL2008 , and molecular glass formers ReviewEdiger ; ReviewGlotzer ; CastilloNatPhys2007 ; BerthierPRE2007 . Recent simulations in a two-dimensional hard sphere system may however reconcile these findings BritoEPL2006 ; BritoJSTAT2007 . The authors show that the rearrangements are short-range correlated for supercooled, equilibrated samples, while they become correlated over long distances deep in the out-of-equilibrium glass phase, approaching the maximum packing. While previous works where short-ranged correlations were found generally dealt with equilibrium supercooled samples, it is clear that our closely-packed, aging onions are jammed systems, for which long-ranged correlations may be expected according to BritoEPL2006 ; BritoJSTAT2007 . Indeed, we have recently observed very long-ranged spatial correlations in the dynamics of a variety of jammed systems using space-resolved dynamic light scattering ThesisAgnes , consistently with the scenario emerging here.
As a further intriguing analogy, we note that the displacement field following a rearrangement event in BritoJSTAT2007 has a vortex-like structure that is reminiscent of that observed in our experiments. Similar structures have been also reported for the non-affine part of the displacement measured, experimentally and numerically, in various amorphous systems under shear, ranging from granular material to glasses Barrat1 ; Barrat2 ; KolbPRE2004 ; MaloneyPRL2006 ; DelGadoPRL2008 . Whether these analogies are accidental or not remains an open question.
IV.3 Role of the temperature fluctuations
The experiments described in this paper highlight the key role of temperature fluctuations in determining the slow dynamics of the onions. One may wonder whether -induced shear deformations are the only driving force for the non-stationary irreversible rearrangements. Indeed, it is difficult to imagine that thermal energy alone could promote such a large scale motion. In fact, the onions are a closely-packed, fully jammed system with a solid-like behavior. In this respect, they are similar to dry foams or compressed emulsions, none of witch exhibits a spontaneous slow dynamics in the absence of a (non-thermal) driving force, such as an applied stress or the stress continuously build up by coarsening DurianScience ; AddadPRL2001 . For jammed or nearly jammed systems, on the other hand, an applied shear strain or stress has been shown to promote irreversible rearrangements in a variety of systems, including granular media Pouliquen ; Dauchot ; ReisPRL2007 , emulsions HebraudPRL1997 , and concentrated suspensions of colloidal ViasnoffPRL2002 and non-colloidal PineNatureShear ; PineNaturePhysicsShear particles.
A final question concerns the generality of the mechanism reported here. In our time-resolved light scattering experiments on dilute colloidal gels DuriEPL2006 , we did not observe any correlation between temperature fluctuations and the rearrangement events that were detected. By contrast, a strong correlation has been established for the onion glass and has also been observed in time-resolved light scattering measurements on a concentrated micellar phase ThesisAgnes . We speculate that temperature-induced strain fluctuations may be important in very concentrated, solid-like systems where expansions and contractions necessarily displace all constituents, and where thermal energy alone may be insufficient to significantly rearrange the structure. On the other hand, in dilute systems such as the gels, expansions and contractions of the solvent would be accommodated flowing through the porous structure, without affecting the particles. More experiments with a finer temperature control or an externally imposed shear will be necessary to test these ideas.
We thank M. Wyart for useful discussions. This work was supported in part by the European NoE “SoftComp” (NMP3-CT-2004-502235) and the French ACI JC2076. L.C. is a junior member of the Institut Universitaire de France, whose support is gratefully acknowledged.
References
- (1) L. Cipelletti, L. Ramos, J. Phys.: Condens. Matter 17 R253 (2005).
- (2) E. Donth, The Glass Transition (Springer, Berlin, 2001).
- (3) P. Sollich, F. Lequeux, P. Hébraud, M. E. Cates , Phys. Rev. Lett. 78, 2020 (1997).
- (4) O. Pouliquen, M. Belzons, and M. Nicolas, Phys. Rev. Lett. 91, 014301 (2003).
- (5) G. Marty and O. Dauchot, Phys. Rev. Lett. 94, 015701 (2005).
- (6) P. M. Reis, R. A. Ingale, and M. D. Shattuck, Phys. Rev. Lett. 98, 188301 (2007).
- (7) A. S. Keys, A. R. Abate, S. C. Glotzer, D. J. Durian, Nat. Phys. 3, 260 (2007).
- (8) A. J. Liu and S. R. Nagel, Nature 396, 21 (1998).
- (9) L. Cipelletti, S. Manley, R. C. Ball, and D. A. Weitz, Phys. Rev. Lett. 84, 2275 (2000).
- (10) A. Knaebel, M. Bellor, J.-P. Munch, V. Viasnoff, F. Lequeux, and J. L. Harden, Europhys. Lett. 52, 73 (2000).
- (11) L. Ramos and L. Cipelletti, Phys. Rev. Lett. 87, 245503 (2001).
- (12) L. Cipelletti, L. Ramos, S. Manley, E. Pitard, D. A. Weitz, E. E. Pashkovski, and M. Johansson, Faraday Discuss. 123, 237 (2003).
- (13) R. Bandyopadhyay, D. Liang, H. Yardimci, D. A. Sessoms, M. A. Borthwick, S. G. J. Mochrie, J. L. Harden, and R. L. Leheny, Phys. Rev. Lett. 93, 228302 (2004).
- (14) A. Robert, E. Wandersman, E. Dubois, V. Dupuis, and R. Perzynski, Europhys. Lett. 75, 764 (2006).
- (15) R. Bandyopadhyay, D. Liang, J. L. Harden, and R. L. Leheny, Solid State Commun. 139, 589 (2006).
- (16) B. Chung, S. Ramakrishnan, R. Bandyopadhyay, D. Liang, C. F. Zukoski, J. L. Harden, and R. L. Leheny, Phys. Rev. Lett. 96, 2006).
- (17) P. Falus, S. Narayanan, A. R. Sandy, and S. G. J. Mochrie, Phys. Rev. Lett. 97, 066102 (2006).
- (18) H. Guo, J. N. Wilking, D. Liang, T. G. Mason, J. L. Harden, and R. L. Leheny, Phys. Rev. E 75, 041401 (2007).
- (19) C. Caronna, Y. Chushkin, A. Madsen, and A. Cupane, Phys. Rev. Lett. 1, 055702 (2008).
- (20) A. Duri and L. Cipelletti, Europhys. Lett. 76, 972 (2006).
- (21) A. Duri, PhD thesis, Université Montpellier 2 (2006).
- (22) V. Prasad, D. Semwogerere, and E. R. Weeks, J. Phys.: Condens. Matter 19, 113102 (2007).
- (23) J.-P. Bouchaud and E. Pitard, Eur. Phys. J. E 6, 231 (2001).
- (24) S. Mazoyer, L. Cipelletti, and L. Ramos, Phys. Rev. Lett. 97, 238301 (2006).
- (25) C. Brito and M. Wyart, Europhys. Lett. 76, 149 (2007).
- (26) C. Brito and M. Wyart, J. Stat. Mech. L08003 (2007).
- (27) P. Ballesta, A. Duri, and L. Cipelletti, Nature Physics 4, 550 (2008).
- (28) L. Ramos, D. Roux, P. D. Olmsted, and M. E. Cates, Europhys. Lett. 66, 888 (2004).
- (29) L. Ramos and L. Cipelletti, Phys. Rev. Lett. 94, 158301 (2005).
- (30) C. E. Willert and M. Gharib, Exp. Fluids 10, 181 (1991).
- (31) J. Westerweel, Meas. Sci. Technol. 8, 1379 (1997).
- (32) P. T. Tokumaru and P. E. Dimotakis, Exp. Fluids 19, 1 (1995).
- (33) compares the sample configurations at time and . If the first image considered (at ) has been taken at high temperature (with respect to the average temperature), then the reference sample configuration is expanded, and will be on average more compressed than the reference state and will thus fluctuate with time around a negative value. By contrast if the first image considered has been taken at relatively low temperature, then the reference sample configuration is “compressed”, and will be on average more expanded than the reference state and will thus fluctuate with time around a negative value. If the reference state corresponds to a relaxed state, then will fluctuate around .
- (34) P. Hébraud, F. Lequeux, J. P. Munch, and D. J. Pine, Phys. Rev. Lett. 78, 4657 (1997).
- (35) G. Petekidis, A. Moussaïd, and P. N. Pusey, Phys. Rev. E 66, 051402 (2002).
- (36) M. Bellour, A. Knaebel, J. L. Harden, F. Lequeux, and J.-P. Munch, Phys. Rev. E 67, 031405 (2003).
- (37) R. E. Courtland and E. R. Weeks, J. Phys.: Condens. Matter 15, S359 (2003).
- (38) H. E. Castillo and A. Parsaeian, Nat. Phys. 3, 26 (2007).
- (39) A. Parsaeian, H. E. Castillo, preprint arXiv:cond-mat/0610789.
- (40) J. Kisker, L. Santen, M. Schreckenberg, and H. Rieger, Physical Review B 53, 6418 (1996).
- (41) L. Berthier and J. P. Bouchaud, Physical Review B 66, 054404 (2002).
- (42) L. Berthier et al., Science 310, 1797 (2005).
- (43) E. R. Weeks, J. C. Crocker, A. C. Levitt, A. Schofield, D. A. Weitz, Science 287, 627 (2000).
- (44) E. R. Weeks, J. C. Crocker, D. A. Weitz, J. Phys.:Condens. Matter 19, 205131 (2007).
- (45) O. Dauchot, G. Marty, G. Biroli, Phys. Rev. Lett. 95, 265701 (2005).
- (46) F. Lechenault, O. Dauchot, G. Biroli, and J. P. Bouchaud, Europhys. Lett. 4, 46003 (2008).
- (47) M. D. Ediger, Annu. Rev. Phys. Chem. 51, 99 (2000).
- (48) S. C. Glotzer, J. Non-Cryst. Solids 274, 342 (2000).
- (49) C. Dalle-Ferrier, C. Thibierge, C. Alba-Simionesco, L. Berthier, G. Biroli, J.-P. Bouchaud, F. Ladieu, D. L Hôte, and G. Tarjus, Phys. Rev. E 76, 041510 (2007).
- (50) A. Tanguy, J. P. Wittmer, F. Leonforte, and J.-L. Barrat, Phys. Rev. B 66, 174205 (2002).
- (51) A. Tanguy, F. Leonforte, and J.-L. Barrat, Eur. Phys. J. E 20, 355 (2006).
- (52) E. Kolb, J. Cviklinski, J. Lanuza, P. Claudin, and E. Clément, Phys. Rev. E 69, 031306 (2004).
- (53) C. E. Maloney, Phys. Rev. Lett. 97, 035503 (2006).
- (54) E. Del Gado, P. Ilg, M. Kroger, and H. C. Ottinger, Phys. Rev. Lett. 101, 095501 (2008).
- (55) D. J. Durian, D. A. Weitz and D. J. Pine, Science 252, 686 (1991).
- (56) S. Cohen-Addad and R. Höhler, Phys. Rev. Lett. 86, 4700 (2001).
- (57) V. Viasnoff and F. Lequeux, Phys. Rev. Lett. 89, 065701 (2002).
- (58) D. J. Pine, J. P. Gollub, J. F. Brady, and A. M. Leshansky, Nature 438, 997 (2005).
- (59) L. Corté, P. M. Chaikin, J. P. Gollub, D. J. Pine, J. F. Brady, and A. M. Leshansky, Nature Physics 4, 420 (2008).