The Lagoon Nebula and its Vicinity
Abstract
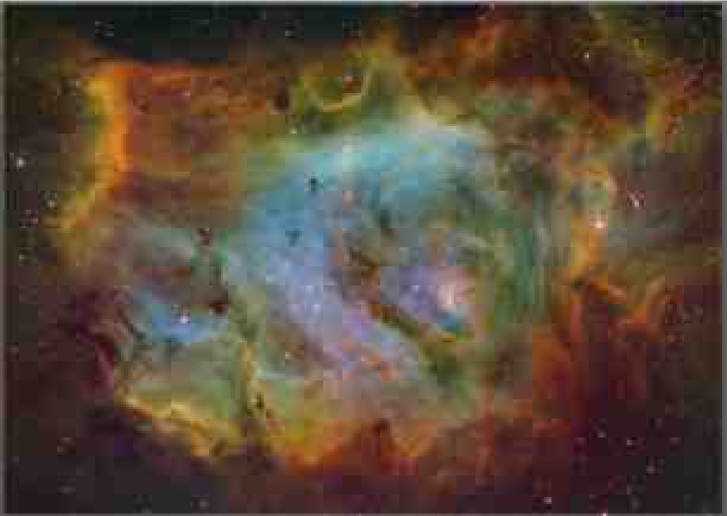
The Lagoon Nebula is an Hii region in the Sagittarius Arm, about 1.3 kpc away, associated with the young (1–3 Myr) open cluster NGC 6530, which contains several O stars and several dozen B stars. Lower-mass cluster members, detected by X-ray and H emission, and by near-IR excess, number more than a thousand. Myr-old star formation is traced by the optically-visible Hii region and cluster; observations of infrared and submillimetre-wave emission, and of optical emission features, indicate ongoing star formation in several locations across the Lagoon. The most prominent of these are the Hourglass Nebula and M8 E. Submillimetre-wave observations also reveal many clumps of dense molecular gas, which may form the next generation of stars. The complex structure of the region has been shaped by the interaction of the underlying molecular gas with multiple massive stars and episodes of star formation. NGC 6530 is the oldest component, with the newest stars found embedded in the molecular gas behind the cluster and at its southern rim. A degree to the east of the Lagoon, Simeis 188 is a complex of emission and reflection nebulae, including the bright-rimmed cloud NGC 6559; the presence of H emission stars suggests ongoing star formation.
Harvard-Smithsonian Center for Astrophysics,
60 Garden Street, Cambridge, MA 02138, USA
and
School of Physics, University of Exeter, Stocker Road, Exeter, EX4 4QL, UK
Department of Geology and Astronomy, West Chester University, West Chester, PA 19383, USA
Thüringer Landessternwarte Tautenburg, Sternwarte 5, D-07778 Tautenburg, Germany
Steward Observatory, University of Arizona, 933 N. Cherry Avenue, Tucson, AZ 85721, USA
1. Introduction
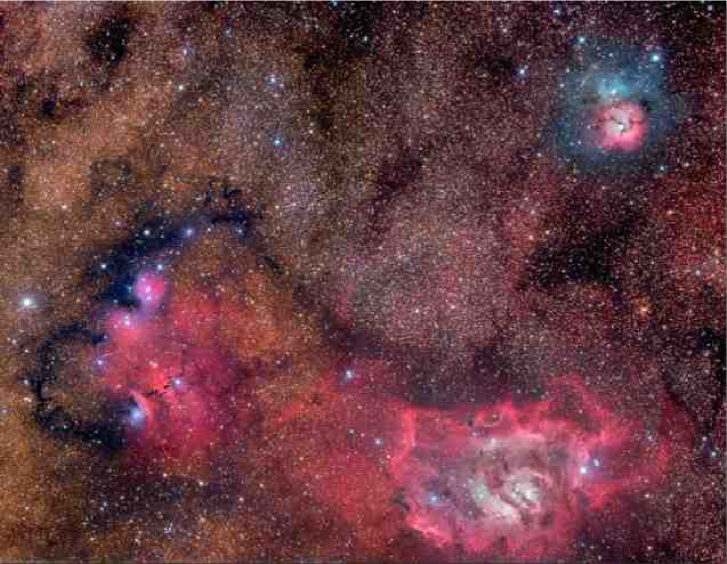
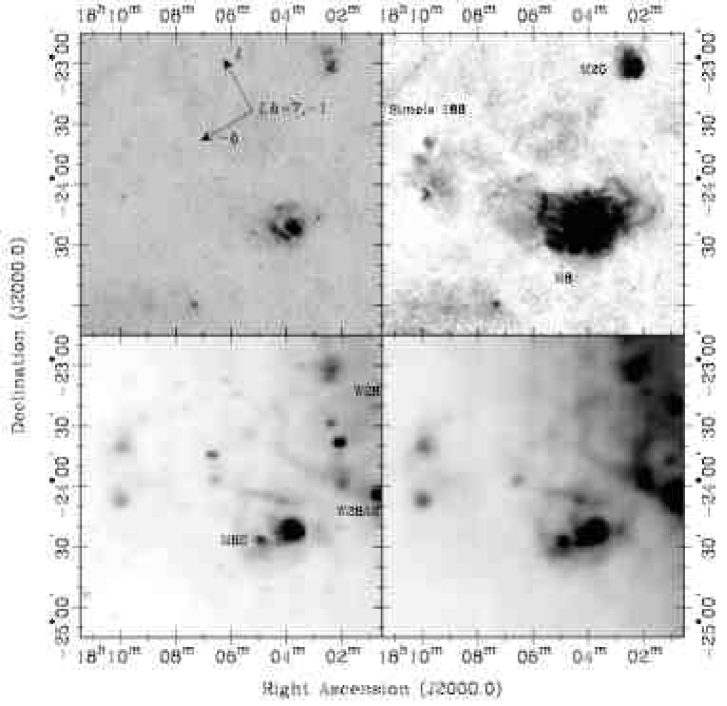
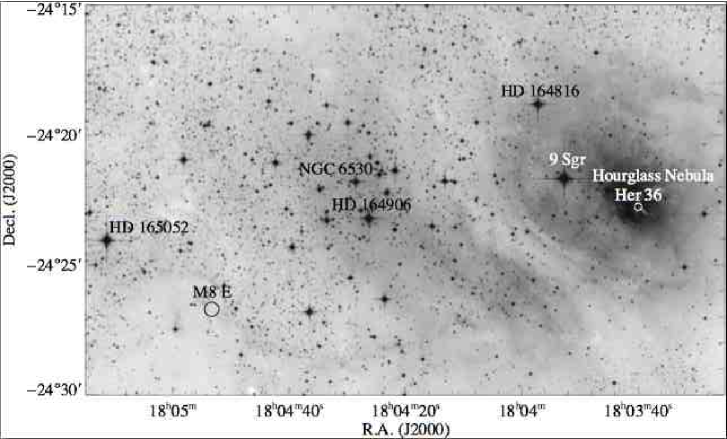
The Lagoon Nebula — M 8 — is the most prominent of a number of star-forming regions and supernova remnants in the section of the Sagittarius-Carina Arm lying near our line of sight towards the Galactic centre (Figs. 1 & 2). Other members include: The Trifid Nebula (M 20); the supernova remnant W 28, near the Trifid at a kinematic distance of 1.9 kpc (Velázquez 2002); the nearby optically-invisible Hii region W28 A2 (G 5.89–0.39), lying between the Lagoon and Trifid Nebulae at a distance of 2.0 kpc (Acord 1998); and the complex of nebulae to the east of the Lagoon known as Simeis 188. The Eagle Nebula (M 16, NGC 6611) and M 17 lie about further along the Sagittarius-Carina arm.
M 8 consists of a rich open cluster with several O-type stars and a prominent Hii region (about half a degree in diameter), the core of the cluster superimposed on the eastern half of the Hii region. The Hii region is surrounded by bright rims and at least one dark ‘elephant trunk’ structure; these are most prominent at the southeastern edge of the Hii region. A dark lane splits the optical nebula from NE to SW (the ‘Great Rift’); the lack of background stars in the Rift implies that it is an obscuring dust lane rather than a lack of material, but it does not show up clearly in submillimetre- or millimetre-wave maps, either of spectral lines of CO or of the dust continuum; the Rift presumably has a high enough column density to obscure optical wavelengths significantly, but not enough to be obvious in emission.
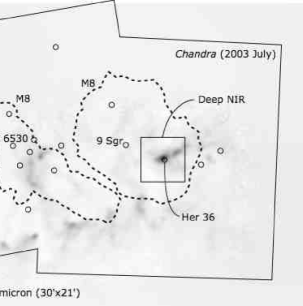
The open cluster is fairly young (a few Myr). It is centred on 18:04:24, –24:21:12 (J2000.0), with a radius of around 30′, but a core radius of only 4′ (Chen et al. 2007). It contains several O stars and about 60 B stars: One of its probable members, the O4 star (and probable binary, Rauw et al. 2005) 9 Sagittarii, is the chief source of ionising flux for the Hii region. The western half of the Hii region is concentrated into a bright core which contains the Hourglass Nebula, a distinctively-shaped window into a compact Hii region with much denser ionised gas than the main body of the Lagoon Nebula, powered by the young O7 star Herschel 36 (HD 164740, Woodward et al. 1986).
Southeast of the cluster core, a structure of bright rims and dark lanes stretches west to east. CO and dust maps clearly show this to be a dense molecular cloud; at its eastern end, at least two massive stars are being formed in the optically-invisible M8 E cluster which rivals the brightness of the Hourglass at infrared and submillimetre wavelengths (see Fig. 3).
The nomenclature of nebulae and clusters in the area is quite unclear, since the complex has been observed and catalogued since the 17th century (Burnham 1978). According to the NGC/IC Project111http://ngcic.org, NGC 6533 refers to the whole nebula and NGC 6523 is the bright core of the nebula, lying NW of the Great Rift; the SE part of the nebula comprises NGC 6526 in the south and NGC 6530 in the north; and IC 1271 and 4678 are small condensations to the east of the main nebula (IC 1271 may refer to the O star HD 165052).
Although Messier referred to it as ‘amas’, a cluster (M 8, Messier 1781), we will use M 8 to refer to the whole complex of stars, Hii regions and molecular gas, and ‘Lagoon Nebula’ to be synonymous. The NE of the region is dominated by the open cluster, so NGC 6530 is now always used to refer to the cluster rather than any surrounding nebulosity. We take NGC 6533 to refer to the Hii region only, comprising NGC 6523 and 6526. Hii region studies have generally concentrated on the brighter eastern core (i.e. NGC 6523), and so it is this designation that is found in the literature: For most practical purposes, NGC 6533 and 6523 are the same. It is not clear that IC 1271 and 4678 refer to real structures, and we will not use these designations.
Much further east of the Lagoon lies an ‘R association’: a scattering of smaller reflection and emission nebulae, often known as Simeis 188. Just to the north of the Lagoon, there is an area of diffuse nebulosity (Fig. 2); on purely morphological grounds, this looks like a diffuse northern extension of NGC 6533, separated by a dust lane.
This review is structured as follows: An overview of M 8 as a whole (Sect. 2.), broken down into the main Hii region NGC 6523/6533 (Sect. 2.1.), the young stellar cluster NGC 6530 (Sect. 2.2.), its pre-main-sequence population (PMS, Sect. 2.3.) and the interstellar medium (Sect. 2.4.), followed by an overview of the distance estimates to M 8 (Sect. 2.5.). Then, major components of the region are discussed in more detail: NGC 6530 (Sect. 3.), including the PMS stars (Sect. 3.2.) and reviews of age and distance estimates (Secs. 3.4. & 3.5.); the Hourglass Nebula (Sect. 4.); M8 E (Sect. 5.); a few other candidate star-forming regions (Sect. 6.); and Simeis 188 (Sect. 7.). Finally, we briefly discuss the structure and evolution of the region as a whole (Sect. 8.).
2. Overview of M 8
2.1. The HII region NGC 6523/33
The Hii region is about 10 pc in radius and requires about ionising photons per second; 9 Sgr appears to be its principal source of ionising radiation, with the binary HD 165052 (O6.5 V + O7.5 V; Arias et al. 2002) contributing as well. Optical spectroscopy suggests that the bulk of the ionised gas has electron temperature () about 6000 K (Bohuski 1973a), and electron density 500 cm-3 increasing to a few cm-3 in small condensations and bright rims (Bohuski 1973b). Both density and temperature increase towards the centre of the Hii region. Lada et al. (1976) identified the star Herschel 36 as being responsible for ionising the core of the nebula, an area about 4′ across; it also ionises the Hourglass Nebula, embedded behind this core. The Hourglass is even hotter and denser, with of 2000–4000 cm-3 and of 7000–9000 K, and fluctuations of about 1500 K (Woodward et al. 1986; Esteban et al. 1999). NGC 6523/33 seems to be a cavity on the front of a large molecular cloud; the optical emission comes from the working surface of ionisation fronts moving into a clumpy medium (Fig. 4; Elliot & Meaburn 1975; Dufour 1994). Meaburn (1971) tentatively detected ionised gas moving at –50 km/s, between us and the nebula, and UV absorptions due to ionised gas were found at about –30 and –50 km/s (Welsh 1983). The stellar wind of 9 Sgr alone would be enough to drive the –50 km/s shell (Welsh 1983), although other O-stars probably contribute. The ionised gas in the Lagoon Nebula may be considered as a superposition of four Hii regions: the Hourglass, the core of NGC 6523 (both powered by Herschel 36), the rest of NGC 6523 and 6533 (ionised by 9 Sgr), and the largest and most tenuous component, ionised by HD 165052 (Lynds & O’Neil 1982; Woodward et al. 1986). More detailed discussion of the Hii region is beyond the scope of this work: The review by Goudis (1976) covers radio, optical and IR data.
2.2. The Open Cluster NGC 6530
Although the core of NGC 6530 lies on the line of sight towards a concentration of molecular gas, the cluster is rather decoupled from the molecular cloud — the stars seem to be unobscured, and Johnson (1973) showed that the far-IR luminosity of M 8 is significantly less than the integrated light of an incomplete census of OB stars in the cluster; hence, the cluster is not significantly embedded in the molecular gas. Optical studies all show significant and variable reddening towards the stars, indicating that there is some interstellar material in front of the cluster. McCall et al. (1990) noted that a shell of expanding gas is seen in absorption against the stars (Welsh 1983), implying that NGC 6530 lies within the Hii cavity. However, this result is based on UV spectra of 4 OB stars; membership probabilities for 3 of them are 0.01, 0.08, and 0.39 (van Altena & Jones 1972), so this argument is not conclusive.
The surface density of cluster stars, derived from X-ray data (Damiani et al. 2004), shows a compact core about 10′ across, surrounded by a broad extended component to the southeast, south and west. To the northeast, the surface density of X-ray sources falls off very quickly, and there is a secondary density peak to the southeast, near the M8 E star-forming region. Many optical studies of the cluster, however, include stars within a field of about a degree, many of which are probable cluster members, based on proper motion (van Altena & Jones 1972).
The cluster includes at least 3 O-type stars (see Fig. 5): The binary HD 165052, probable binary 9 Sagittarii, and Herschel 36. HD 164816 and HD 164906 (also known as MWC 280) are usually classified as O-type (e.g. Hiltner et al. 1965), but have been reclassified as B3Ve and B0Ve, respectively (Levenhagen & Leister 2006); HD 164906 may also be binary (Roberts et al. 2007).
2.3. The Young Stellar Population
Studies of the stellar population of NGC 6530 can be used to estimate the age and distance of the cluster and thus to characterise the star formation history of the region, and, by isolating the pre-main sequence, the young stellar population may be studied. It is difficult to distinguish the stellar population of NGC 6530 from foreground and background stars, since it lies close to the Galactic plane, and is projected on top of the Galactic bulge. Most studies of the cluster have been carried out with broadband optical photometry, and newer studies have extended the photometry into the near-IR. It is then possible to isolate the cluster in a statistical sense, e.g. as a separate population in a colour-magnitude diagram. Detailed studies of the young stars require individual stars to be identified as being young. Historically, this has usually involved looking for H emission, but modern X-ray imaging with XMM-Newton and the ACIS-I camera on Chandra (Rauw et al. 2002; Damiani et al. 2004) are a much more efficient way to identify young stars in the cluster: The X-ray to bolometric flux of T Tauri stars is at least 100 times higher than it is for most of the foreground and background stars which dominate optical and infrared images. Earlier-type stars in the cluster are likely to lie on the ZAMS already, and may not show up in H or X-ray emission. One of the few possible methods for identifying individual early-type cluster members is through proper motion analysis, which relies on the availability of old data. Fortunately, these early-type stars are rather bright, and thus quite likely to be visible on old photographic plates (see, e.g., van Altena & Jones 1972).
Quite apart from foreground contamination (in the optical) and background contamination (in the near-IR), we face the problem that there are signs of multiple populations of YSOs in the M 8 region. Near-IR and X-ray imaging both suggest that there are small dense clusters associated with the Hourglass Nebula, with M8 E (both regions of ongoing massive star formation), and possibly with the Central Ridge. Disentangling these very young clusters from NGC 6530 is likely to be difficult.
2.4. The Interstellar Medium in the Lagoon Nebula
Large-scale structure
The large-scale structure of the molecular ISM in the Lagoon can be seen in maps of CO 1–0 (Lada et al. 1976) and far-IR continuum emission (Lightfoot et al. 1984), both with resolutions of 1′–2′. Lada et al. found 3 bright spots, BS 1–3: The most prominent (BS 1) corresponds to the inner core of the Hii region, centred on the Hourglass (clump HG and surroundings in Fig. 6); BS 2 (SC 8 and surroundings in Fig. 6) lies at the southern edge of the nebula, coincident with the ‘South Eastern Bright Rim’ (an ionisation front eroding a concentration of gas). BS 3 lies on the western edge of the core of NGC 6530: The continuum map shows it as an elongated structure, or ‘eastern bar’ (which we call the ‘central ridge’, clumps EC 1–5 in Fig. 6). Lada et al. also found a CO cloud with significantly redder velocity (28 km/s) lying between the core of NGC 6530 and the bright rim linking the Lagoon Nebula to M8 E. A near-IR extinction map with comparable resolution shows very similar structure (Damiani et al. 2006).
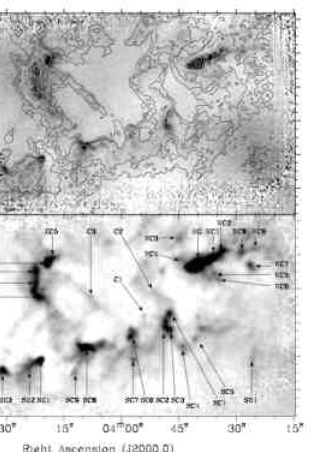
Small-scale structure
Maps of the molecular ISM (submillimetre continuum and low- CO) covering a similar area to those of Lada et al. (1976), but with resolution of order 10′′ were published by Tothill et al. (2002); some of the maps are shown in Figure 6. The molecular emission is clearly dominated by the Hourglass and M8 E, but many other concentrations become visible. BS 2 (and the SEBR) can now be resolved as a clump of gas (SC 8) with a very sharp transition from the molecular gas to the ionised gas of the Hii region, consistent with the picture of a structure dominated by the progess of an ionisation front. The Central Ridge (BS 3), by contrast, shows up as a complex extended structure of molecular material (EC 1–5) running approximately N–S, without the sharp edges seen in the former. It is possible that this complex has a similar ionisation structure, but that we observe it face on, the ionisation front covering the whole of the complex, rather than seeing a cross-section as with the southern rim. In the Central Ridge, the brightest continuum emission is seen in a compact condensation at the northern end, while the CO emission peaks further south along the extended ridge. This may reflect structural differences, with a dense but relatively cool clump at the northern end of the warmer, more diffuse ridge. The lower-resolution continuum data showed a western extension of the Hourglass emission (Lightfoot et al. 1984), and the newer data resolve this into a series of clumps running WNW from the Hourglass, also seen in molecular data (White et al. 1997).
The Hourglass Nebula and M8 E are known to be regions of very recent or ongoing star formation. The Central Ridge lies close to a cluster of X-ray sources, suggesting that it too is a locus of star formation within the Lagoon Nebula. The ionisation-dominated structure of BS2/M8 SC8 should also be considered a candidate for star formation, possibly triggered by the compression of the molecular gas by the ionisation front.
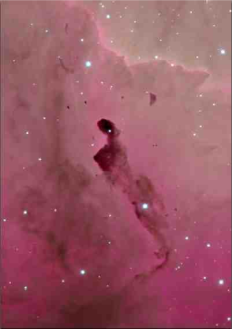
In addition, there are many other molecular clumps scattered throughout the nebula. Most of them are not particularly dense, but Tothill et al. (2002) suggested that star formation might be triggered in them by the effect of ionisation fronts (based on the assumed ionising flux from 9 Sgr and Herschel 36). Brand & Zealey (1978) studied a dark ‘elephant trunk’ structure (which they call ‘The Dragon’) lying south of the ridge that connects M8 SE1 to M8 E (see Fig. 3), using stellar intensity profiles to model the cloud as a pc structure of density a few cm-3, and total mass M⊙. The Dragon can also be seen in the 850 m continuum (Tothill et al. 2002) as a very faint structure just visible over the noise. Based purely on its position, it would seem to lie outside and in front of the arc of dense gas seen in the submillimeter continuum. The question of whether or not the Dragon is associated with star formation remains open.
In the course of a larger survey of high-mass protostar candidates, Beltrán et al. (2006) mapped the M 8 area at 1.3 mm wavelength with a beam about twice the size of that of Tothill et al. (2002). The structure seen in their map is similar, and their published brightnesses are comparable to those seen at 1.3 mm in the earlier study. Table 1 lists the clumps seen in the two studies, cross-referenced where possible. Beltrán et al. also examined the MSX images, and found that all of the clumps in their map are associated with mid-IR emission, almost all of them with point sources.
The clump masses derived by Beltrán et al. are systematically higher than those from Tothill et al. (2002), by up to 2 orders of magnitude (averaging about a factor of 10). This very large discrepancy can be explained by a combination of factors: Beltrán et al. (2006) often find larger fluxes from a clump— the most extreme example is the Hourglass clump (M8 HG/Clump 1) with 1.3 mm fluxes of 2.6 and 14 Jy measured by Tothill et al. and Beltrán et al. respectively. These larger fluxes reflect the larger beamsize of the later observations and the use of CLUMPFIND to decompose the maps into clumps. CLUMPFIND packs all the flux in the map above a certain limit into the various clumps it finds, whereas decomposition into gaussian clumps (used by Tothill et al.) tends to leave residual flux. There are further discrepancies, due to differences in the conversion from continuum flux to gas mass between the two papers. For M 8, Beltrán et al. use , whereas Tothill et al. use a range of about . This difference arises from assumptions about the mm-wave opacity of dust (1 cm2 g-1 against 1.3 cm2 g-1), the temperature of the dust, and the distance to M 8. Beltrán et al. assume a temperature of 30 K for all clumps, while Tothill et al. derive individual clump temperatures from CO observations. Since the mass/flux ratio is inversely proportional to the temperature (in the Rayleigh-Jeans limit), this is not a large effect, but can reach almost a factor of two: for the Hourglass, Tothill et al. adopted a temperature of 48 K. By comparing the velocity of CS emission to a Galactic rotation curve, Beltrán et al. estimated the distance to M 8 to be 3.1 kpc, compared to the 1.7 kpc assumed by Tothill et al. Since the mass-to-flux ratio is proportional to the square of the distance adopted, this produces a discrepancy in mass of more than a factor of 3. The combination of all these discrepancies is enough to account for the differences in the mass estimates. The distance adopted by Beltrán et al. is inconsistent with the accepted range (see later in this review), and the distance adopted by Tothill et al. is also a bit further than the most likely current estimate of 1.3 kpc. The gas masses quoted in Table 1 have been rescaled to a fiducial distance of 1.3 kpc; remaining discrepancies reflect the uncertainties in the absolute derivation of mass from dust emission.
| Namea | No.b | R.A.c | Dec.c | a,d | b,d | e | b | a |
| (J2000.0) | (J2000.0) | () | () | (K) | (pc) | (pc) | ||
| M8HG | 1 | :: | :: | |||||
| M8WC1 | :: | :: | ||||||
| M8WC2 | :: | :: | ||||||
| M8WC3 | :: | :: | ||||||
| M8WC4 | :: | :: | ||||||
| M8WC5 | :: | :: | ||||||
| M8WC6 | :: | :: | ||||||
| M8WC7 | 22 | :: | :: | |||||
| M8WC8 | :: | :: | ||||||
| M8WC9 | :: | :: | ||||||
| M8SW1 | 21 | :: | :: | |||||
| M8EC1 | 12 | :: | :: | |||||
| M8EC2 | :: | :: | ||||||
| M8EC3 | 13 | :: | :: | |||||
| M8EC4 | 6 | :: | :: | |||||
| M8EC5 | 5 | :: | :: | |||||
| M8E | 2 | :: | :: | |||||
| M8SE1 | 10 | :: | :: | |||||
| M8SE2 | :: | :: | ||||||
| M8SE3 | 11 | :: | :: | |||||
| M8SE4 | :: | :: | ||||||
| M8SE5 | 18 | :: | :: | |||||
| M8SE6 | 19 | :: | :: | |||||
| M8SE7 | 7 | :: | :: | |||||
| M8SE8 | :: | :: | ||||||
| M8SC1 | :: | :: | ||||||
| M8SC2 | 3 | :: | :: | |||||
| M8SC3 | :: | :: | ||||||
| M8SC4 | :: | :: | ||||||
| M8SC5 | :: | :: | ||||||
| M8SC6 | 8 | :: | :: | |||||
| M8SC7 | :: | :: | ||||||
| M8SC8 | 9 | :: | :: | |||||
| M8SC9 | :: | :: | ||||||
| M8C1 | :: | :: | ||||||
| M8C2 | :: | :: | ||||||
| M8C3 | :: | :: | ||||||
| 4 | :: | :: | ||||||
| 14 | :: | :: | ||||||
| 15 | :: | :: | ||||||
| 16 | :: | :: | ||||||
| 17 | :: | :: | ||||||
| 19 | :: | :: | ||||||
| a Tothill et al. (2002); b Beltrán et al. (2006) | ||||||||
| c taken from Tothill et al. (2002) unless it occurs only in Beltrán et al. (2006) | ||||||||
| d gas masses revised to assumed distance of 1.3 kpc | ||||||||
| e derived from CO data (Tothill et al. 2002) | ||||||||
Optical Features in the Interstellar Medium
Optical images of M 8 reveal a region rich in optical ISM features, such as Bok globules, bright-rimmed clouds, proplyd-like objects, Herbig-Haro (HH) objects, etc. (Table 2), many of which are generally associated with star formation.
The presence of dark markings against the nebular background was noted by Barnard (1908) and Duncan (1920)222Duncan claims that the name ‘Lagoon Nebula’ refers to these structures.. Out of 23 dark areas, Bok & Reilly (1947) consider 16 to be “true globules”, being regular and round, with diameters ranging from 6′′ to 1′ — mainly in the 10′′–30′′ range.
Sugitani & Ogura (1994) examined the ESO Schmidt atlas, finding two bright-rimmed clouds in M 8 (and one in Simeis 188) associated with IRAS sources, which they consider to be good candidates for sites of star formation caused by radiatively-driven implosion. The first (near IRAS 17597–2422) has a tightly-curved bright rim, about 200′′ across; the second (near IRAS 18012–2407) has a gentler curvature, the rim being about 280′′ by 120′′. These clouds are significantly larger than the globules found by Bok & Reilly, which may simply reflect different decisions as to what constitutes a cloud or globule within the structure of the interstellar medium. A lack of accurate IRAS fluxes (probably due to confusion) prevented Sugitani & Ogura from classifying the associated IRAS point sources. These bright-rimmed clouds lie well to the north and west of the main emission region of M 8, where they have not been studied by other authors, although Lada et al. (1976) note a ‘bright rim’ to the north of NGC 6530, which may well be the same as the northern bright-rimmed cloud of Sugitani & Ogura. These structures raise the possibility of ongoing star formation significantly outside the core of the complex.
At least one proplyd has been found in the Lagoon Nebula, around the B star at the centre of the UCHii region G 5.97–1.17 (Stecklum et al. 1998). De Marco et al. (2006) found 4 proplyd-like objects in an HST image of a small part of M 8, but none of them have visible central stars, suggesting that they are not true proplyds. Near the Hourglass, there are two T Tauri stars with bow-shocks around them, pointing towards Herschel 36, but these are more likely produced by collisions between the stellar winds (Arias et al. 2006).
The first HH object noted in the Lagoon Nebula (HH 213, Reipurth 1981) lies ′ W of the Hourglass. Recent wide-field narrow-band optical imaging has revealed HH objects around the Hourglass (Arias et al. 2006) and the southern and southeastern bright rims (Barbá & Arias 2007). One of these, HH 894, has an axis pointing towards the PMS Fe/Ge star ABM 22, which lies at the bright rim of the molecular clump SC 8; HH 896 and 897, meanwhile, seem to come straight out of another molecular clump, SE 3 (Fig. 7; Arias et al. 2007). Three more PMS stars — ABM 21, 27 and 29 — are found within knots of high-excitation gas (Arias et al. 2007). Only a small fraction of the Lagoon Nebula has been studied in this way, so there may be many more HH objects to be found.
| Name | R.A.(J2000.0) | Dec.(J2000.0) | Notes |
|---|---|---|---|
| HH 213 | 18:02:30.5 | –24:17:12 | HH Objecta |
| IRAS 17597–2422 | 18:02:51.6 | –24:22:08 | Bright-rimmed cloudb |
| HH 869 | 18:03:35.7 | –24:22:30 | HH Objectc |
| HH 868 | 18:03:36.0 | –24:22:49 | HH Objectc |
| HH 867 | 18:03:36.8 | –24:22:33 | HH Objectc |
| ABMMR-CG | 18:03:36.9 | –24:23:58 | Globulec |
| G 5.97–1.17 | 18:03:40.5 | –24:22:44 | UCHii & Proplydd |
| ABMMR 334-BS | 18:03:40.5 | –24:23:32 | Bow-shock around starc |
| ABMMR 349-BS | 18:03:40.7 | –24:23:16 | Bow-shock around starc |
| HH 870 | 18:03:41.4 | –24:23:25 | HH Objectc |
| NGC 6530 PLF 4 | 18:03:44.2 | –24:19:23 | Proplyd-like featuree |
| NGC 6530 PLF 3 | 18:03:44.8 | –24:19:47 | Proplyd-like featuree |
| NGC 6530 PLF 2 | 18:03:45.3 | –24:19:45 | Proplyd-like featuree |
| NGC 6530 PLF 1 | 18:03:45.6 | –24:19:41 | Proplyd-like featuree |
| HH 895 A | 18:03:57.2 | –24:28:04 | Bow shockf |
| HH 895 B | 18:03:59.2 | –24:27:53 | Knotty filamentf |
| B 296 | 18:04:04.4 | –24:32:00 | Barnard dark nebula, 6′1′ |
| HH 893 B | 18:04:06.0 | –24:24:47 | Sii knotf |
| HH 893 A | 18:04:06.1 | –24:24:46 | Sii knotf |
| ABM 21/SCB 418 | 18:04:10.3 | –24:23:23 | PMS star in knotg |
| ABM 27/SCB 486 | 18:04:16.0 | –24:18:46 | PMS star in knotg |
| ABM 29/SCB 495 | 18:04:16.4 | –24:24:39 | PMS star in knotg |
| IRAS 18012–2407 | 18:04:16.8 | –24:06:59 | Bright-rimmed cloudb |
| HH 894 C | 18:04:17.7 | –24:26:16 | filamentf |
| HH 894 B | 18:04:22.0 | –24:25:55 | knotsf |
| HH 894 A | 18:04:22.9 | –24:25:52 | bow shockf |
| HH 896 A | 18:04:28.6 | –24:26:38 | bow shockf |
| HH 896 B | 18:04:29.8 | –24:26:57 | bow shockf |
| HH 896 C | 18:04:30.4 | –24:26:20 | faint bow shockf |
| HH 897 C | 18:04:30.9 | –24:28:59 | arcs and knotsf |
| HH 897 B | 18:04:31.0 | –24:29:33 | filamentsf |
| HH 897 A | 18:04:31.4 | –24:30:27 | knotty bow shockf |
| B 88 | 18:04:35.0 | –24:06:52 | Barnard dark nebula, 2′30′′ |
| ‘The Dragon’ | 18:04:45.2 | –24:30:00 | Dark elephant trunkh |
| B 89 | 18:04:59.8 | –24:21:50 | Barnard dark nebula, 30′′30′′ |
| a Reipurth (1981); b Sugitani & Ogura (1994); c Arias et al. (2006); d Stecklum et al. (1998) e De Marco et al. (2006); positions taken directly from FITS WCS f Barbá & Arias (2007); g Arias et al. (2007); h Brand & Zealey (1978) | |||
2.5. The Distance to the Lagoon Nebula
Determination of the distance to M 8 is based on the distance to NGC 6530. The physical association of NGC 6530 with M 8 is based not just on the fact that the two lie along the same line of sight; the reddening of the cluster stars is small but significant, suggesting that they are neither background nor foreground objects (van den Ancker et al. 1997). The radial velocities of the cluster stars are also fairly close to that of the nebula. The various distance determinations for NGC 6530 are reviewed in detail in Sect. 3.5.: To summarise the discussion, we recommend a distance of 1.3 kpc, with an error of maybe 0.1 kpc. However, there are also several distance estimates of 1.8 kpc. The discrepancy of about 30% between the two is very significant: Many derived quantities depend on , and may therefore suffer systematic errors of .
Recently, distances have been derived to star-forming regions by measuring the parallax of 22 GHz H2O masers with VLBI (e.g. Hirota et al. 2007). Despite multiple searches, no 22 GHz masers have been found towards M 8, but M8 E contains very strong methanol masers. It may therefore be possible to measure the distance to the sites of star formation in M 8 directly.
Humphreys (1978) derived a mean distance to Sgr OB1 of kpc, but adopted a distance of 1.6 kpc. Georgelin & Georgelin (1970a) cited a distance of 1.6 kpc, although their fitted trace of the Sagittarius-Carina spiral arm (Georgelin & Georgelin 1970b) passes 1.9 kpc away from the Sun at a Galactic longitude of 6∘. The spiral arm trace is based, in this longitude range, on a group of bright optical Hii regions (including M 8) with a mean distance of 2.2 kpc. A distance estimate of 1.3 kpc suggests that NGC 6530, and hence M 8, are located some distance in front of the Sagittarius-Carina arm.
3. NGC 6530
3.1. The Main-sequence Population
Walker (1957) published photometry for 118 stars, concentrated towards the core of the cluster, as well as a smaller list of variable stars. Kilambi (1977) extended Walker’s list to a total of 319 stars333the combined Walker-Kilambi numbering system is the one adopted by WEBDA, and is referred to as ‘Walker’ in this work, largely to the west and north, and van Altena & Jones (1972) used proper motions to find membership probabilities () for the brighter members of the cluster. Subsequent studies (Götz 1972; Sagar & Joshi 1978; Chini & Neckel 1981) found similar colour-magnitude diagrams: earlier-type stars (to about A0) along the zero-age main sequence (ZAMS), with later stars lying above it, although Hiltner et al. (1965) classified the central B-stars of the cluster as mainly Be-type, and placed them above the ZAMS. Sung et al. (2000) identified a ZAMS down to about 3 M⊙, and Damiani et al. (2004) suggest that all stars earlier than G-type and with should be considered probable cluster members. Many stars in the field were excluded from membership by van Altena & Jones (1972), but Damiani et al. considered only a field in the centre of the cluster, compared to the half-square-degree field of van Altena & Jones (1972). New proper-motion studies of the cluster used photographic plates of NGC 6530 taken at Shanghai Astronomical Observatory in 1912 to obtain a baseline of 87 years (Zhao et al. 2006; Wen et al. 2006; Chen et al. 2007), yielding a very clear separation between cluster and field stars. Based on this selection, Chen et al. (2007) measured core and half-number radii of ( pc) and ( pc), respectively; they estimated the cluster radius (at which the cluster population disappears into the field star population) to be around . The cluster density profile is consistent with either a King or model.
| Survey | Refa | Area | Stars | Selection | Photometry | Other Data |
| Walker | 1 | NGC 6530 | ||||
| HMN | 2 | NGC 6530 | — | Spectroscopy | ||
| VAJ | 3 | NGC 6530 | Photographic | Proper Motion | ||
| Kilambi | 4 | NGC 6530 | b | |||
| SJ | 5 | NGC 6530 | ||||
| CN | 6 | NGC 6530 | c | d | ||
| MRV | 7 | NGC 6530 | — | Polarization | ||
| VdA | 8 | NGC 6530 | WULBVRIJHKe | Spectroscopy | ||
| SCB | 9 | NGC 6530 | , H | |||
| KSSB | 10 | NGC 6530 | f, g, | Spectroscopy | ||
| mid-IRh | ||||||
| Damiani | 11 | NGC 6530 | X-ray/NIR | f, g | X-ray | |
| PDMS | 12 | NGC 6530 | , g | X-ray | ||
| ABMMR | 13 | Hourglass | ||||
| ZCW | 14–16 | NGC 6530 | Photographic | Proper Motion | ||
| ZW | 17,18 | NGC 6530 | HR Diag. | Time-domain | ||
| ABM | 19 | NGC 6530 | — | Spectroscopy | ||
| PDMP | 20 | NGC 6530 | Spectroscopy | |||
| Mayne | 21,22 | NGC 6530 | – | X-ray, H | V, I | |
| a References: (1) Walker (1957); (2) Hiltner et al. (1965); (3) van Altena & Jones (1972); (4) Kilambi (1977); (5) Sagar & Joshi (1978); (6) Chini & Neckel (1981); (7) McCall et al. (1990); (8) van den Ancker et al. (1997); (9) Sung et al. (2000); (10) Kumar et al. (2004); (11) Damiani et al. (2004); (12) Prisinzano et al. (2005); (13) Arias et al. (2006); (14) Zhao et al. (2006); (15) Wen et al. (2006); (16) Chen et al. (2007); (17) Zwintz & Weiss (2006); (18) Guenther et al. (2007); (19) Arias et al. (2007); (20) Prisinzano et al. (2007); (21) Mayne et al. (2007); (22) Mayne & Naylor (2008) | ||||||
| b photographic; c 4 sources have no known d Non-standard photometric system e Walraven, Johnson-Cousins and near-IR systems f from literature; g from 2MASS; h from ISO, MSX, IRAS | ||||||
Most stars near the cluster centre with have known spectral types (e.g. Hiltner et al. 1965), but few with (Sung et al. 2000); Damiani et al. (2004) found only 68 spectral types in the literature over their 300 square arcmin X-ray field of view around the cluster centre, most with . Thus there are few intermediate- to late-type stars with known spectral types. van den Ancker et al. (1997) published photometry from the near-UV to near-IR for all 132 stars with , and optical spectroscopy for some of them. Their Table 1 is a comprehensive summary of stellar data from the literature for this sample. They generally used photometric measurements to estimate the spectral type, unless the spectroscopic classification was very different.
3.2. The Pre-Main Sequence Population
Walker (1957) suggested that stars lying significantly above the ZAMS in NGC 6530 were still contracting onto the main sequence, but Thé (1960) disagreed, arguing that only bright stars showed any sign of clustering (following Wallenquist 1940), and that data from nearby non-cluster fields produced colour-magnitude diagrams very similar to Walker’s, but without the early-type ZAMS. The problem with the clustering argument is that, towards the cluster centre and Hii region, only the brightest stars were readily visible on photographic plates, giving rise to selection effects. Chini & Neckel (1981) obtained photometry for stars with high probability of cluster membership (van Altena & Jones 1972), which showed probable members in the earlier-type ZAMS and probable non-members in the later-type population, consistent with Thé’s scepticism. Spectroscopic classifications of 11 of these stars (Walker 1961) ruled out their being background giants, but did not exclude their being foreground stars.
Kilambi (1977) added stars to the Walker sample: Early-type stars were added by membership probability (van Altena & Jones 1972), and later-type stars by looking for a population whose apparent magnitudes were linearly related to their absolute magnitude (and hence, presumably, at the same distance). The colour-magnitude diagram derived from this expanded list was similar to Walker’s, suggesting that there was indeed a PMS population. Sagar & Joshi (1978) carried out a very similar study ( photometry of 88 stars with high membership probability) and again found an early-type ZAMS and late-type PMS.
Damiani et al. (2004) found that optical sources do not cluster significantly (apart from OB stars), whereas X-ray sources in NGC 6530 cluster rather strongly. In addition, the age spread of PMS stars smears them out over the H-R diagram. They conclude that the optically-visible cluster stars are diluted so much by the field star population, both on the sky and in a colour-magnitude diagram, that they are unlikely to show up. In other words, although there is a PMS population, it probably was not detected by the early optical surveys.
H Observations of the PMS Population
A popular method of isolating the PMS population in the cluster is to select stars by their H emission. Earlier, shallower, studies found brighter objects, mainly HAeBe stars: Herbig (1957) found 19 H stars in the cluster (LkH 102–119 and the OB star MWC 280/HD 164906). An objective-prism survey (Velghe 1957), covering a field (including both M 8 and M 20), revealed 66 H emission objects, mainly early-type stars. van den Ancker et al. (1997) found 5 stars with intrinsic H emission and near-IR excess (probably HAeBe) in their early-type spectroscopic sample.
Sung et al. (2000) conducted a deeper search, comparing narrow-band H to a broad-band photometry, and finding 37 PMS stars and 9 candidates from ground-based observations (of which 8 are members of the Herbig list) and a further 21 much fainter PMS stars (with another 8 candidates) from archival HST images. Arias et al. (2007) confirmed several of these stars to be PMS by spectroscopy, and estimated their masses to be in the range 0.8–2.5 M⊙, in agreement with their position on an H-R diagram.
X-ray Observations of the PMS Population
Rauw et al. (2002) detected a total of 220 X-ray sources with XMM (119 with high confidence), primarily in and around NGC 6530, including 9 Sgr and Herschel 36. Nearly all of these high-confidence XMM sources are associated with candidate cluster members in the optical catalog of Sung et al. (2000); few of the XMM-detected stars have strong H emission, suggesting that most are low-mass, weak-lined T Tauri stars. The short exposure time and the relatively large XMM PSF meant that only a small fraction (less than 10%) of the cluster members were detected.
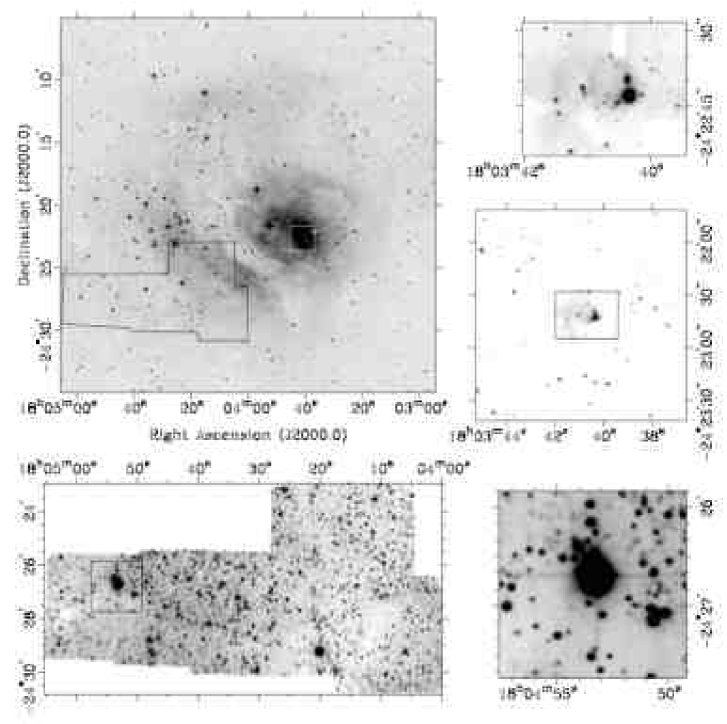
Deeper wide-field images have been obtained with Chandra-ACIS (see Fig. 8): NGC 6530 was observed in 2001 (Damiani et al. 2004) and another field centred on the Hourglass in 2003 (Castro et al. 2008). Damiani et al. (2004) found 884 X-ray sources in their 1717′ NGC 6530 field: only 220 of these have optical counterparts in the SCB survey (Sung et al. 2000), but the great majority (731) have counterparts in the 2MASS point source catalog. With 30–50 of these expected to be spurious, at least 90% are T Tauri stars in the cluster, many of them showing IR excess and some with UV excess (Damiani et al. 2004; Prisinzano et al. 2005; Damiani et al. 2006). The resulting optical H-R diagrams of X-ray selected T Tauri stars suggest an age gradient from the northwest to the south in NGC 6530, with the youngest stars located near the southern edge of the Hii region. This result is supported by optical spectroscopy of PMS stars (Arias et al. 2007), which shows younger stars along the southern rim and near the Hourglass. Damiani et al. (2004) also noted that Chandra sources at the southern edge of the cluster near the ionization front were harder and more time-variable than those near the center of NGC 6530 inside the cavity. These results suggest both sequential star formation and increased flare activity among newly-formed stars.
This sample increases the number of probable cluster members known, and massively increases the number of low-mass (and hence PMS) cluster members known, by more than an order of magnitude. Prisinzano et al. (2005) obtained deeper optical data than that of Sung et al. (2000) to compare with the X-ray sources: The X-ray-selected subsample of their optical sample is strongly concentrated spatially to the centre of the cluster and, in colour-magnitude space, to an isochrone. Prisinzano et al. used the Orion Nebula as a well-studied surrogate to argue for a completeness ranging from below half (for stars below 0.25 ) to about unity for stars of solar mass and above.
Chandra can detect only a fraction of the YSOs because of exposure time limitations and intrinsic variations in X-ray luminosity. The total (detected and undetected) population of NGC 6530 and the Hourglass Nebula may be estimated by comparison to the COUP sample of YSOs in the Orion Nebula (Getman et al. 2005): For stars with relatively low obscuration, the COUP data are essentially complete to the hydrogen-burning limit. The complete Orion X-ray luminosity function (XLF) may then be compared to the (censored) XLF in NGC 6530 and the Hourglass Nebula, using limits on the distance and extinction to estimate minimum and maximum numbers of cluster stars: If kpc, then the limiting X-ray luminosities, given as log(erg s-1), near NGC 6530 and Herschel 36 are 29.9 and 29.4, assuming (probably too high for NGC 6530, but appropriate for the Hourglass). In this case, the Hourglass would contain approximately 400 cluster members and NGC 6530 nearly 3000. If kpc and assuming low to medium obscuration, then 70% of cluster members should have been detected by Chandra. The low X-ray detection fraction of IR sources in the Hourglass is probably due to high obscuration, but could also be explained by the distance being kpc. Our adopted distance of kpc suggests fewer NGC 6530 cluster members: in the field of the 2001 Chandra observation.
Damiani et al. (2004) found that a significant fraction of strong H emission stars are not detected in X-rays, which suggests that the different methods of selecting PMS stars are complementary. While H is expected to trace Classical T Tauri stars preferentially, they suggested that X-ray flaring sources are an even better tracer of very young pre-main-sequence populations, and that deeply embedded (and hence very young) stars might be detected as hard X-ray sources. The two hard, flaring X-ray sources they found are both in the southeast of the cluster, near M8 E (a major locus of star formation).
Optical/near-IR Observations of the PMS Population
Since X-ray detection does not provide a complete census of the PMS population, Damiani et al. (2006) combined their previous X-ray and optical data (Damiani et al. 2004; Prisinzano et al. 2005) with 2MASS to search for more young stars. Constructing reddening-free optical-IR colour indices (by analogy with 444Johnson & Morgan (1953) defined as a reddening-free linear combination of and , which acts as a spectral-type diagnostic; Damiani et al. (2006) define as a similar combination of and ), they find 196 stars, of which 120 were not previously detected in X-rays. The majority of these seem to be young stars with circumstellar disks, but a small subset have rather different colours: These ‘strong ’ objects, are interpreted as candidate Class I objects. Their very low X-ray detection rate would then be due to their still being surrounded by an envelope, and their optical brightness would be due mainly to reflection nebulosity.
These candidate Class I objects are mainly found in the northwest of the Damiani et al. Chandra field, i.e. just northeast of the Hourglass. This is difficult to reconcile with earlier results (Damiani et al. 2004; Prisinzano et al. 2005) which show older stars in the north and the youngest sources in the southeast, potentially associated with the molecular gas there. Damiani et al. (2006) suggest that this northern region of the cluster might be undergoing a prolonged process of star formation with star formation rates and long disk lifetimes (due to a lack of nearby OB stars), in contrast to the faster star formation elsewhere in the cluster. The claim of long disk lifetime needs to be examined carefully, since the position of these sources NE of the Hourglass places them fairly close to 9 Sgr. It would also be useful to check whether these sources might be associated with the Hourglass Nebula Cluster.
Optical Spectroscopy of PMS Stars
Until recently, spectroscopy of individual cluster members was restricted to the brightest stars, generally already on the MS. In their sample of 45 early-type stars, Kumar et al. (2004) found only 4 probable PMS stars — One classical Be and 3 HAeBe (including LkH 112 and MWC 280). Recently, larger telescopes and multi-object spectrographs have enabled spectroscopic studies of lower-mass PMS stars. Arias et al. (2007) selected 46 target stars by their H emission (from Sung et al. 2000), near-IR colours or proximity to optical nebular features. They classified all but 7 of them as PMS stars: 2 HAeBe, 3 PMS Ge, 27 CTTS and 7 WTTS (the preponderance of CTTS presumably being due to the H selection criterion). Prisinzano et al. (2007) obtained lithium spectra of 332 PMS candidates, selected to lie in the same part of the , diagram as the bulk of detected X-ray sources (Damiani et al. 2004), and H spectra of 115 of them. Using X-ray detection, radial velocity, and lithium equivalent-width criteria, they found 237 stars to be certain cluster members (of which 53 are binaries), and another 10 possible members. The 71 certain members for which they have H spectra comprise 31 CTTS, 9 possible CTTS, and 31 WTTS.
Time-domain Observations of PMS Stars
Zwintz & Weiss (2006) monitored two fields towards NGC 6530 to look for PMS pulsating stars (similar to the post-MS Scuti stars). Their fields cover the core of the cluster (extending out to M8 E and including the SE rim) and the area NE of the Hourglass. Of the 30 stars lying in the classical instability strip of the HR diagram, 6 were confirmed to be pulsating, with one further candidate. The oscillation spectra of 5 of the confirmed pulsating PMS stars were then modelled (Guenther et al. 2007): The best-fit models were somewhat redder than the stellar colours taken from the literature, but the luminosities were very similar to those expected, assuming the distance to the cluster to be 1.8 kpc.
Individual PMS Stars
Pereira et al. (2003) identified LkH 117 with SS73 125 (Sanduleak & Stephenson 1973), and, based on optical spectroscopy, classified it as a mid-K-type T Tauri star. MWC 280/HD 164906 (see Sect. 2.2.) seems to be a very high-mass HAeBe star (Herbig 1957; Kumar et al. 2004), with uncertain membership. LkH 108, 112 and 115 are Herbig Be stars with high cluster membership probabilities and IR excesses (Boesono et al. 1987; van den Ancker et al. 1997; Sung et al. 2000; Kumar et al. 2004), while NGC6530-VAJ 45 and NGC6530-VAJ 151 are HAeBe candidates (van den Ancker et al. 1997). LkH 113 had the strongest H emission in the cluster at the time of the Sung et al. (2000) survey, but not much else is known about it. LkH 109 (SV Sgr) is a variable H star whose proper motion is inconsistent with that of the cluster, and hence is either a foreground star or a cluster member ejected by dynamical processes (Sung et al. 2000), and Walker 29 (V5100 Sgr) is a classical Be star (Kumar et al. 2004), with only a 20% probability of membership.
Arias et al. (2007) found 37 new PMS stars by spectroscopy. Stars of particular interest are: ABM 22 (SCB 422), which displays Herbig-Haro emission; and ABM 21, 27 & 29 (SCB 418, 486 & 495), which appear to be located in knots of highly-excited gas. Among their PMS stars are LkH 108, 111 & 115 (Table 4); data for the rest may be found in the original publication.
| Primary | R.A. | Dec. | Classification | Other | Membership |
|---|---|---|---|---|---|
| Name | (J2000.0) | (J2000.0) | Name | Prob. | |
| LkH 103 | 18:02:51.1 | –24:19:23b | |||
| LkH 102 | 18:02:52.5 | –24:18:44a | |||
| HD 314900 | 18:02:53.3 | –24:20:17c | HAeBe (B5Ve)d | Walker 5 | 2%e, 90%f |
| LkH 104 | 18:02:54.3 | –24:20:56a | |||
| LkH 106 | 18:03:40.3 | –24:23:20g | |||
| LkH 108 | 18:03:50.8 | –24:21:11f | HAeBe (B6Ve)h | 77%e, 99%f | |
| LkH 109 | 18:03:57.7 | –24:25:33i | SV Sgr | 0e | |
| Walker 13 | 18:04:00.2 | –24:15:03p | pulsatingq | ||
| Walker 28 | 18:04:09.9 | –24:12:21p | pulsating?q | 99%f | |
| Walker 29 | 18:04:11.2 | –24:24:48g | B2ed | V5100 Sgr | 20%e |
| LkH 110 | 18:04:11.4 | –24:27:16g | |||
| Walker 38 | 18:04:14.0 | –24:13:28p | pulsatingq | 68%e, 99%f | |
| LkH 111 | 18:04:17.5 | –24:19:09a | CTTS (K5)h | ||
| Walker 53 | 18:04:20.7 | –24:24:56p | pulsatingq | 78%e, 99%f | |
| Walker 57 | 18:04:21.8 | –24:15:47p | pulsatingq | 0e | |
| LkH 112 | 18:04:22.8 | –24:22:10f | HAeBe (B2Ve)d | Walker 58 | 81%e, 98%f |
| HD 164906 | 18:04:25.8 | –24:23:08j | HAeBe (B0Ve)k | MWC 280 | 94%f |
| LkH 113 | 18:04:26.1 | –24:22:45g | |||
| Walker 78 | 18:04:30.8 | –24:23:42p | pulsatingq | ||
| LkH 114 | 18:04:33.2 | –24:27:18g | |||
| LkH 107 | 18:04:36.5 | –24:19:14b | |||
| Walker 159 | 18:04:42.3 | –24:18:04p | pulsatingq | ||
| LkH 115 | 18:04:50.6 | –24:25:42f | HAeBe (B2Ve)h | 79%e, 98%f | |
| LkH 116 | 18:04:58.6 | –24:24:36l | |||
| LkH 117 | 18:05:39.0 | –24:30:40m | TTS (K)n | ||
| LkH 118 | 18:05:49.7 | –24:15:21o | 98%f | ||
| LkH 119 | 18:05:56.5 | –24:16:00f | 0e, 97%f | ||
| a from Ducourant et al. (2005); b position from 2MASS catalogue | |||||
| c from USNO catalogue (UCAC2); d from Kumar et al. (2004) | |||||
| e from van Altena & Jones (1972); f from Zhao et al. (2006), Chen et al. (2007) | |||||
| g from Prisinzano et al. (2005); h from Arias et al. (2007); i from HBC | |||||
| j from PPM (Roeser & Bastian 1988); k see section 2.2. | |||||
| l from WCS of DSS image; m from Sanduleak & Stephenson (1973) | |||||
| n from Pereira et al. (2003); o from Teixeira et al. (2000) | |||||
| p from Sung et al. (2000); q from Zwintz & Weiss (2006) | |||||
3.3. Extinction and Reddening towards NGC 6530
Extinction
Since NGC 6530 has largely been studied by optical photometry, estimates of the optical extinction towards it are usually obtained by deriving , the colour excess, and multiplying by , the ratio of total to selective extinction. Table 5 shows the estimates of colour excess towards the cluster from the various photometric surveys, generally around 0.3. Most of these studies estimate the intrinsic colour from broadband photometry, which may be very inaccurate, although Sung et al. (2000) used 30 early-type stars with known spectral types. van den Ancker et al. (1997) used their photometry (checked against optical spectroscopy) to fit a model SED: , , and distance were among the fitted parameters. This approach has the advantage of using more than one or two data points in wavelength to determine stellar parameters.
The extinction varies from star to star: van Altena & Jones (1972) found 3 stars with , significantly higher than the rest of their sample, and Sagar & Joshi (1978) found some evidence for systematic extinction gradients (0.25–0.48 mag) over the cluster field, though most of their more extreme values are based on very few stars. van den Ancker et al. (1997) found a foreground extinction of 0.3 mag, along with large, variable (and presumably circumstellar) extinction towards individual stars. Sung et al. (2000) derived an average of 0.35 (also adopted by Prisinzano et al. 2005), although the stars in their sample span the range from 0.25 to 0.5. They dereddened later-type stars in their study by assuming them to have the same extinction as the nearest early-type star with an extinction estimate; if van den Ancker et al. are correct that the variable extinction is circumstellar, this approach is unlikely to be accurate. Mayne & Naylor (2008) used a modified Q-method555The modified Q-method uses updated reddening vectors and isochrones in colour-colour space, and considers the effects of binarity and metallicity to fit individual extinctions to the stars in their sample, and found an average of 0.33, agreeing well with the extinction of 0.32 that they found by isochrone-fitting.
McCall et al. (1990) used optical polarisation towards bright cluster members to analyse the extinction: Observations of two foreground K giants give a foreground extinction of mag. The lack of cluster stars with led them to postulate the existence of an additional sheet of obscuring material in front of the cluster, with ; the value of for this sheet is unclear. Thé (1960) estimated for the background cloud to NGC 6530, but this is an underestimate, at least in the central regions: Prisinzano et al. (2005) and Arias et al. (2006) found background stars in their near-IR samples with of 10 to 20, and the near-IR extinction map of Damiani et al. (2006) shows consistently higher values.
The extinction towards the proplyd G 5.97–1.17 is about 5 mag (Stecklum et al. 1998), consistent with most determinations of the extinction towards Herschel 36 (assuming ). Arias et al. (2006) found a foreground extinction of mag ( mag, for normal reddening) towards the Hourglass region. By selecting probable background stars and estimating their extinction, they also mapped the extinction, showing a strong congruence with the molecular data.
Reddening
Reddening is usually measured by , whose canonical value of about 3.1 appears to be valid over most of our Galaxy. However, larger values of have been found in and around star-forming regions. A larger value implies slightly larger dust grains, which do not block blue light quite as efficiently. Anomalously high values of in M 8 may be explained by selective evaporation of small grains by the radiation from hot stars, or by grain growth in circumstellar environments. The former could explain abnormal reddening throughout NGC 6530 (if there is any), and the latter might produce the star-to-star variations seen by van den Ancker et al.
Walker (1957) suggested that the extinction law might be abnormal, but later attributed the effect to photometric error (Walker 1961). Chini & Neckel (1981) found no evidence of abnormal reddening, and Neckel & Chini (1981) used photometric observations from to to show that 4 OB stars in NGC 6530 had normal extinction (), whereas similar stars in other Hii regions had larger values of . Although their photometric system is non-standard (Taylor et al. 1989), this result is probably still valid. Based on multiwavelength data towards the double O-star HD 165052, Arias et al. (2002) found reddening consistent with a standard reddening law, though their result assumes a distance of 1.8 kpc, which probably too high (see sec. 3.5.); Further observations towards 6 other OB stars (Arias et al. 2006) yield a range of reddening estimates, from 3.3 to 5.4 (for Herschel 36). UV observations show uniformly low extinction towards early-type stars, but normal extinction in optical wavebands (Böhm-Vitense et al. 1984; Torres 1987), implying that the small grains are depleted; the UV extinction towards early-type stars is quite variable, with some evidence of systematic variation (Boggs & Böhm-Vitense 1989). Removing a foreground extinction (assumed to have normal of 3.2), McCall et al. (1990) used the cluster method to fit to the remaining extinction, inconsistent with the standard extinction laws or, indeed, with the anomalous extinction found around Herschel 36. Kumar et al. (2004) adopted a similar approach, and derived a similar foreground-subtracted reddening (). van den Ancker et al. (1997) found that the majority of their fitted SEDs were consistent with ; the exceptions () also have high extinction, so they attribute anomalous reddening to circumstellar material. Sung et al. (2000) found a large range of reddening for their sample of 30 stars, with some sign of correlation between reddening and extinction, which would tend to support the circumstellar hypothesis of van den Ancker et al.. For their recent photometric studies, Prisinzano et al. (2005) assumed standard reddening, while Arias et al. (2006) used a standard reddening law in the near-IR (Rieke & Lebofsky 1985) to avoid the non-standard optical reddening.
3.4. The Age of NGC 6530
The usual way to estimate the age of a very young cluster like NGC 6530 (whose H-R diagram has no giant branch) is to isolate the PMS stars and to compare them to theoretical isochrones. The earliest attempts to do this (Walker 1957; van Altena & Jones 1972; Kilambi 1977; Sagar & Joshi 1978) may not have included any PMS stars in their samples: The stars that these studies found to the right of the ZAMS are probably background giants, and the PMS has likely only been isolated by more recent research. Therefore, these older isochrone-based age estimates are unlikely to be useful. The H-selected PMS population clusters around isochrones of order 1 Myr (Sung et al. 2000), and almost none are older than 3 Myr (Arias et al. 2007). Both Damiani et al. (2004) and Prisinzano et al. (2005) placed the X-ray selected sample on a diagram: Damiani et al. (2004) derived a median age of 0.8 Myr, with a spread of about 4 Myr; Prisinzano et al. (2005) found almost all of their stars to lie between the 0.3 Myr and 10 Myr isochrones, the distribution peaking around 2 Myr. The derived ages are almost unaffected by reddening (Damiani et al. 2004), but are strongly model-dependent — according to some models, the median age is just 0.1 Myr. The H-selected PMS population may not be entirely the same as the X-ray selected one: H is strongest in classical T Tauri Stars, whereas X-ray emission mainly comes from weak-line T Tauri Stars. However, no systematic difference between the populations is evident on an H-R diagram (e.g. Arias et al. 2007).
Mayne et al. (2007) and Mayne & Naylor (2008) take a different approach: By comparing the (, ) colour-magnitude diagrams of multiple young clusters, they obtain a relative age ladder. According to their results, NGC 6530 is indistinguishable from the Orion Nebula Cluster (ONC) in age, older than IC 5146, and younger than NGC 2264. This corresponds to an absolute age of 1–2 Myr.
Although NGC 6530 has no giant branch, some of the OB stars have started to evolve off the ZAMS: by fitting 10 OB stars to theoretical tracks, Böhm-Vitense et al. (1984) estimated an age of Myr. However, this estimate assumes a distance modulus of 11.5 mag, probably 1 mag too high. A lower distance reduces the calculated luminosities, and hence the estimated ages, though not enough to place the stars on the ZAMS. Walborn (1973) classified 9 Sgr as O4 V((f)), i.e. still on the main sequence. van den Ancker et al. (1997) found at least one star in their sample with an age of 15 Myr and a high probability of cluster membership, leading them to suggest that star formation has been going on in NGC 6530 for a few years. On dynamical grounds, van Altena & Jones (1972) placed a lower limit of 0.6 Myr on the cluster age. Chen et al. (2007) measured an intrinsic velocity dispersion of 8 km s-1; if this is taken to be the expansion velocity, it suggests a dynamical age of about 1 Myr. This velocity dispersion also suggests that NGC 6530 could survive as a cluster for some hundreds of Myr, although external perturbations (which are very likely, given its position in the Galaxy) could disrupt it earlier (Chen et al. 2007).
It seems that the main burst of star formation in NGC 6530 occurred about 1–2 Myr ago. However, there may have been significant star formation activity beforehand; whether it stretched back over the tens of Myr proposed by van den Ancker et al. is unclear.
The confirmed O-stars in NGC 6530 (HD 165052, 9 Sgr & Herschel 36) all lie well outside the bright core of the cluster, where the brightest star is B0. Arias et al. (2007) found that their younger PMS stars ( Myr) were preferentially located towards the southern rim, and in the west, around the Hourglass. There is evidence of similar age separation in the X-ray selected PMS population (Damiani et al. 2004; Prisinzano et al. 2005), with older stars (a few Myr) concentrated to the northeast, and the youngest stars (less than 0.5 Myr) in an arc running from the southeast (near M8 E) to the southwest of the cluster, stretching towards Herschel 36. This fits very well with the submillimetre maps that show a broad arc of dense gas to the south of the cluster centre, and which might be loci of ongoing star formation (Tothill et al. 2002). This interpretation suggests that at least the youngest part of NGC 6530 is still embedded within its natal molecular cloud.
3.5. The Distance to NGC 6530
Many authors have estimated the distance to NGC 6530 by fitting an offset ZAMS to their colour-magnitude diagrams, where the offset gives the distance modulus (Walker 1957, 1961; van Altena & Jones 1972; Chini & Neckel 1981; Sagar & Joshi 1978). However, the effects of extinction must be removed, which requires the determination of , in this case about 1 mag. This process gives considerable room for error, especially in light of the uncertainty over the amount and nature of extinction towards NGC 6530.
McCall et al. (1990) used published spectral types for early-type stars to derive the extinction and distance, using the ‘cluster method’, which attempts to distinguish binaries from single stars. Sung et al. (2000) also used stars with known spectral types, finding the stars to have either low () or high () distance moduli. They adopted the higher value on the grounds that the low distance estimates are probably binaries. van den Ancker et al. (1997) do not use a distance modulus at all, but instead directly fit a theoretical SED to their (spectroscopically-checked) multi-band photometry, with distance as one of the parameters. They base their distance estimate of 1.8 kpc on the histogram of fitted distances.
More recent studies have generally found smaller distances: Prisinzano et al. (2005) fitted a ZAMS at 1.3 kpc to the blue edge of the stellar distribution in colour-magnitude diagrams. They argue that any field stars significantly further away than NGC 6530 will lie behind the molecular cloud, and thus be highly reddened, moving away from the ZAMS on the colour-magnitude diagram. Thus the blue edge of the distribution should be defined by the ZAMS at the distance of NGC 6530. Arias et al. (2006) also derive a low distance (1.3 kpc), based on half a dozen early-type stars near the Hourglass, whose distance moduli and extinctions were derived by fitting stellar models to their SEDs. The spread in derived extinctions is large, probably due to the highly variable interstellar and circumstellar extinction, as is the spread in distance modulus. All three O stars in the sample are binaries (including 9 Sgr and Her 36), and this only seems to have been taken into account for one of them; the three B stars have rather higher distance moduli. Damiani et al. (2004) also note that their estimate of the number of foreground field stars is close to that which might be expected if the cluster were 1.3 kpc away; if it were 1.8 kpc away, the expected number of foreground stars would be twice as high. Mayne & Naylor (2008) used a modified Q-method (see also Sect. 3.3.) to analyse NGC 6530, rather than their preferred (Naylor & Jeffries 2006), because of the large spread in extinction over the different cluster members. They derived a distance of about 1.3 kpc, with an error range of kpc, using photometry from Sung et al. (2000).
One recent study, however, supports a greater distance: Guenther et al. (2007) found that their modelling of the oscillation spectra of PMS pulsating stars gave luminosities consistent with their assumed distance of 1.8 kpc. Hipparcos parallax measurements, on the other hand, suggest a distance of only about 600 pc (distance modulus , Loktin & Beshenov 2001) towards NGC 6530. Parallax measurements are generally considered to be robust only for nearby objects, and this determination is so different from all other estimates as to be hard to believe. The measurement is based on only 7 stars; since they are presumably rather bright, it is entirely possible that they are all foreground stars. Loktin & Beshenov were able to fit a straight line to the relationship between distance moduli determined from Hipparcos data and those determined photometrically, but the NGC 6530 measurement is inconsistent with that straight line; moreover, they consider 1 kpc to be the greatest distance at which their technique is accurate. In the absence of more detailed results, this distance estimate should not be adopted.
Most recent distance determinations agree on a distance of about 1.3 kpc, which is used throughout this review. The Sung et al. estimate of 1.8 kpc is based only on early-type stars for which a spectral type was known: Essentially, they fitted a ZAMS to the top (the blue end) of the colour-magnitude diagram. As Prisinzano et al. point out, the blue end of the ZAMS is almost vertical on a colour-magnitude diagram, so the distance modulus (a vertical offset on the diagram) is not very well-constrained. By contrast, Prisinzano et al., by fitting to the blue envelope, are able to use the redder part of the ZAMS to constrain the distance modulus, at the cost of the additional assumption that the blue edge of the colour-magnitude diagram constitutes the cluster, or field stars at the same distance. Mayne & Naylor, by using the modified Q-method, were also able to use fainter stars without spectroscopic data, and in fact used the photometric data from Sung et al. (2000) to derive their nearer distance. The van den Ancker et al. (1997) estimate (also 1.8 kpc) is similarly dependent on rather bright stars. However, the differences in stellar samples used for the various distance determinations may not be the whole story: Sung et al. (2000) found a distance modulus of 11.2 mag towards Herschel 36, while Arias et al. (2006) estimated 10.5 mag. Both determinations used the same observed magnitude (), and their assumed absolute magnitudes only differ by 0.1; the rest of the discrepancy presumably lies in the assumptions used to deredden the -band data. Herschel 36 is probably an extreme example, as it is known to have anomalous extinction, but it illustrates some of the problems that bedevil distance estimation.
Most of these distance estimates are variations on fitting a ZAMS to a colour-magnitude diagram, but the two recent works which use independent methods find different distances. As noted above, we do not consider the parallax measurement (Loktin & Beshenov 2001) to be sufficiently accurate to be useful, but the asteroseismology of PMS pulsating stars (Guenther et al. 2007) raises some intriguing possibilities. Guenther et al. assumed a distance of 1.8 kpc in their analysis, and found well-fitting models. It is unclear to us whether or not they could have assumed a distance of 1.3 kpc and still have modelled the cluster stars successfully. The stars whose oscillations were modelled were selected because they lay on the instability strip of the HR diagram at an assumed distance of 1.8 kpc (Zwintz & Weiss 2006), and it might be useful to search for pulsating stars outside this region, since the position of the instability strip on a colour-magnitude diagram could add additional distance constraints. Further distance estimates could perhaps be obtained from spectroscopy of known intermediate- and low-mass cluster members (selected by further proper motion studies, X-ray emission, H emission, IR excess etc). If the distance could be shown to be 1.3 kpc rather than 1.8 kpc, this might further constrain the PMS models used to analyse the pulsating stars in the cluster.
| Surveya | /mag | Age/Myr | d.m./mag | Distance/kpc | |
|---|---|---|---|---|---|
| Walker | — | b | |||
| VAJ | — | b | |||
| Kilambi | b | ||||
| SJ | — | b | |||
| CN | — | — | |||
| MRV | c | — | |||
| VdA | 3.1 | few | — | ||
| SCB | d | e | |||
| KSSB | — | f | — | — | — |
| Damiani | — | — | e | — | — |
| PDMS | — | — | e | ||
| ABMMR | , g | — | — | ||
| Mayne | — | 1–2 | |||
| a References as for Table 3; b probably unreliable — see section 3.4. | |||||
| c foreground extinction only; d anomalous, non-uniform | |||||
| e median age and age spread, respectively | |||||
| f subtracting foreground reddening yields | |||||
| g foreground extinction towards Hourglass and mean extinction towards early-type | |||||
| stars, respectively | |||||
3.6. Stellar Masses in NGC 6530
Prisinzano et al. (2005), by placing their X-ray-selected sample on a diagram, estimated the stellar masses. Correcting for the incompleteness of the X-ray sample, they fitted a mass function with a power law of index . Sung et al. (2000) also fitted power law mass spectra to their (much smaller) sample, using three different suites of stellar models, giving indices of 1.2, 1.3 and 1.4. They suggest an overall index of . Both of these estimates are consistent with the Salpeter mass function (1.35) and shallower than the mass function of submillimetre clumps (, Tothill et al. 2002), although the stellar and clump mass functions are formally consistent with one another. PMS mass estimates are strongly affected by reddening (Damiani et al. 2004); since the reddening is poorly characterised in the cluster, this could be a significant source of error, especially for stars which might be embedded.
Prisinzano et al. (2005) estimated a total stellar mass for NGC 6530 (down to ) of 700–930 . However, a Salpeter IMF with sufficient amplitude to supply 60 B-stars has a total mass of , which suggests that the X-ray sample is very incomplete. The total stellar mass of NGC 6530 appears to be of order . Chen et al. (2007) found significant mass segregation in the cluster, with more massive stars concentrated in the centre.
4. The Hourglass Nebula
The surface brightness peak of the Hii region, lying just to the east of the O7 V star Herschel 36, was described by John Herschel as “a kind of elongated nucleus, just following a star…The proper nucleus is decidedly not stellar…” (Thackeray 1950). Later observations showed it to have a narrow-waisted bipolar appearance (Thackeray 1950), very much like an hourglass (see Fig. 9). Nearby to the NE, in the outskirts of the nebular emission, is the star Cordoba 12403666also SCB 182, CD –24∘ 13810; the designation Cordoba 12403 is not used in SIMBAD (B2 V, van den Ancker et al. 1997): van Altena & Jones (1972) found this star to have a membership probability (in NGC 6530) of 86%, so it might be associated with the Hourglass, or might lie in front of the nebula, although still within the NGC 6530 cluster. Thackeray (1950) found several point-like condensations in the Hourglass, and mid-IR emission (10–20 m) has been found towards one of these condensations (IRS1, Gillett & Stein 1970; Dyck 1977), towards Herschel 36 (Woolf et al. 1973; Dyck 1977) and Cordoba 12403 (Woolf et al. 1973), and towards IRS2 (Dyck 1977), located just to the east of the optical Hourglass, within the obscuring material that defines the eastern edge of the structure.
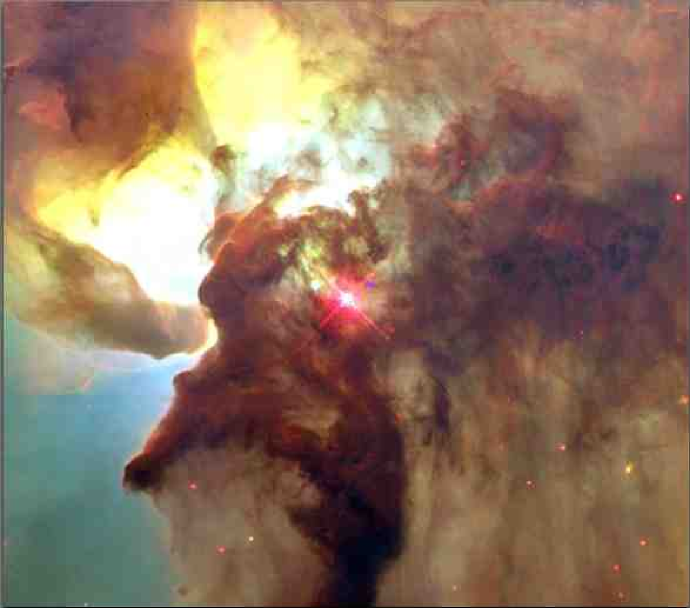
Tentative early suggestions that the Hourglass might be a bipolar nebula around a central star (e.g. Allen 1986) are not borne out by detailed observations. Although the biconical shape of the nebula is maintained at 2 m (Allen 1986, and Fig. 10), it disappears at longer wavelengths, becoming a more rounded blob (Woodward et al. 1986). In this latter work, Woodward et al. combine multi-wavelength observations to show that the Hourglass is an interestingly-shaped window into a compact Hii region lying within a molecular cloud, ionised by Herschel 36. The delicate curves and traceries that we see in high-resolution images (e.g. from HST, Fig. 9) indicate the complexity of the interstellar medium777It has been suggested (outside the refereed literature) that such shapes may indicate processes analogous to a terrestrial tornado, but, in the absence of any theoretical justification, we consider these claims to be implausible..
Although the clear symmetry of the Hourglass disappears at longer wavelengths, there is a much larger structure with a N–S axis of symmetry surrounding it — the Super-Hourglass Structure (SHGS) of Lada et al. (1976). This structure is most prominent in e.g. [Sii], and is probably associated with an ionisation front, most likely due to 9 Sgr.
4.1. Molecular Gas in the Hourglass
Molecular gas is found in abundance towards the Hourglass Nebula, and the discovery of a strongly contained Hii region inside a clump very close to Herschel 36 suggests that the young stars and gas are intimately associated.
Extinction data (Arias et al. 2006) suggest very high column density to the north and east of the Hourglass, reflected in a significant deficit of background field stars. This is consistent with the molecular line data of White et al. (1997), who found very high CO brightness temperatures of CO (of order 100 K) to the N and E of the Hourglass, with weaker emission to the NW, in M8WC1.
White et al. (1997) estimated that the underlying cloud has a mass of about 31 M⊙, with a column density (H2) cm-2. The large suite of CO lines observed allowed White et al. to use a Large Velocity Gradient (LVG) model to estimate the volume density (H2) cm-3. Tothill et al. (2002) used submillimeter continuum data to estimate a mass of 10–30 M⊙; the column density estimated from this measurement agrees with the earlier figure, but the volume density is 30 times higher than the LVG estimate. A gas temperature of 48 K can be derived from transitions of isotopically-substituted CO (13CO and C18O, Tothill et al. 2002). The discrepancy between this temperature and the brightness temperature of 12CO may reflect the effect of external heating (by the OB stars of the Hourglass Nebula Cluster) on the molecular cloud, giving rise to a hot outer layer which dominates the 12CO spectrum, but is too thin to make much difference to the more optically-thin isotopically-substituted transitions.
4.2. The Stellar Population of the Hourglass Nebula
Near-IR observations (e.g. Fig. 10) reveal a large stellar population around the Hourglass Nebula covering a few arcminutes, with a concentration (a few arcseconds across) around Herschel 36 itself.
Herschel 36
Woolf et al. (1973) found strong extended emission around this young O7 star throughout the near- and mid-IR spectral range, and this was confirmed at 4 m by lunar occultation data (Stecklum et al. 1995). Extension along a roughly SE–NW axis has been seen in high-velocity molecular gas (White et al. 1997) and more clearly in imaging spectroscopy of excited H2 (Burton 2002); these results are consistent with outflow from the star, but by no means conclusive: The broadband near-IR extension to the SE (Stecklum et al. 1995) is actually a separate object (Stecklum et al. 1999; Goto et al. 2006, discussed below), the submm data lack resolution, and Burton points out that the H2 may be excited by fluorescence rather than shocks. If the H2 emission does come from an outflow, however, the mechanical luminosity is L⊙.
The Surroundings of Herschel 36
The first near-IR observations of Herschel 36 (Allen 1986; Woodward et al. 1990) revealed a small cluster of stars, and later high-resolution adaptive-optics (AO) observations (see Fig 10, and Goto et al. 2006) resolved more stars.
Woodward et al. (1990) found the two pointlike sources at the waist of the Hourglass (their KS3, 4), along with KS2 which lies between Herschel 36 and the Hourglass, to be consistent with reddened B stars. The AO image, however, shows KS2 to consist of at least 2 or 3 stars. 3′′ N of Herschel 36, KS1/Her 36B is also resolved into two sources, one visible at , , and , and the other only becoming prominent at and longer wavelengths (Stecklum et al. 1999; Goto et al. 2006).
Stecklum et al. (1999) found that the SE extension seen in is separated from Herschel 36 by about 0.3′′ (400 AU) in -band. A more comprehensive study of this source (Goto et al. 2006) found it to be just 0.25′′away from Herschel 36, extended in broadband emission, but compact ( AU) in H, Brackett- and radio continuum emission. Goto et al. inferred the existence of an early-type star surrounded by a highly-confined Hii region within a dense clump, and suggested that a B2 star inside a clump with gas density of order cm-3 would be consistent with their observations. Further to the SE, Stecklum et al. (1998) showed that the source lying 3′′ away from Herschel 36, and coincident with the radio source G5.97–1.17 (Wood & Churchwell 1989), is a young star (later than B5) surrounded by a circumstellar disc which is being photoevaporated by the UV flux of Herschel 36, i.e. a proplyd.
Most of these nearby objects lie within a few arcseconds of Herschel 36, and could account for its supposed unusual reddening, based on aperture photometry (Woodward et al. 1990). Indeed, the closest source lies within half an arcsecond, and will contaminate all but the highest-resolution data.
The development of AO imaging, by allowing the Hourglass to be studied at much higher spatial resolution than before, has reinforced the similarities between this region and the Trapezium in Orion, the prototypical massive star-forming region. More than one massive star is found in close proximity, and nearby star-forming structures are strongly influenced by the UV flux of the massive stars.
The Hourglass Nebula Cluster
Near-IR imaging of the surroundings of the Hourglass Nebula (e.g. Fig. 10, Bica et al. 2003; Arias et al. 2006) reveals a much richer young stellar cluster than previously appreciated. In X-rays, a very deep Chandra observation (Castro et al. 2008), centered on the Hourglass Nebula, revealed a soft X-ray source at the location of Herschel 36, surrounded by a tight cluster of harder sources.
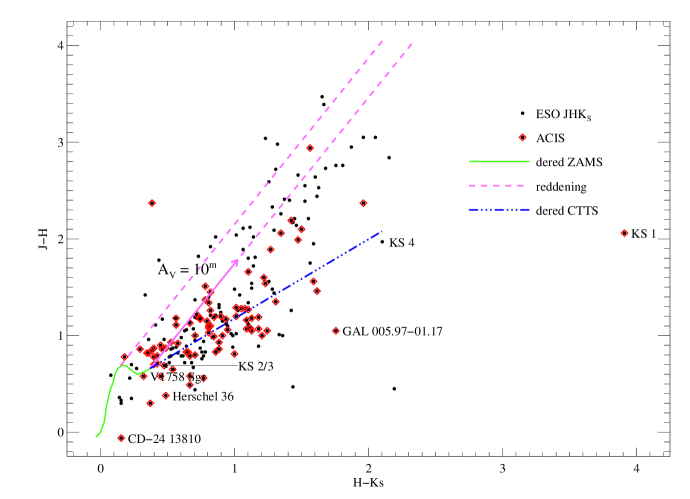
Arias et al. (2006) obtained photometry for 945 stars in a region around Herschel 36, of which 102 are detected with Chandra. Castro et al. (2008) used near-IR data from Stecklum et al. (1998, see Fig. 10) to obtain a catalog of 1290 -, - and -band sources in a region centered on Herschel 36, of which 205 have good , and photometry, and 128 are detected with Chandra. The near-IR colour-colour diagram (Fig. 11) shows a cluster containing numerous reddened T Tauri stars with large H–K colour excess from disks, lying to the right of the reddening vector and above the locus of T Tauri stars. The diagram also shows a number of YSOs below the T Tauri locus, including the proplyd G5.97–1.17 and the bright IR source KS 1. Most of these sources are detected with Chandra; the X-ray sources are tightly clustered near the 850 m emission peak, and may be Class I protostars, representing one of the most recent bursts of star formation in M 8.
Arias et al. (2006) used their photometry to disentangle the Hourglass cluster from the reddened background giant population. Of the 700 or so stars identified in about 4 square arcminutes around the Hourglass, they found about 200 potential cluster members, of which about 100 have an infrared excess (similar to the 100 stars detected by Chandra), and should therefore be considered probable cluster members. Subdividing their field into 9 areas, they found a large overdensity of potential young stars in the vicinity of the Hourglass, compared to the outer areas, confirming the presence of a significant cluster, about 1–2 Myr old. The IR-excess sources tend to cluster together in a few locations: Around Herschel 36, around the molecular clump to the NW (M8 WC1), and on the NE rim of the Hourglass molecular clump. The subcluster near Herschel 36 extends over about an arcminute to the south, but hardly at all to the north. This could reflect the distribution of young stars (suggesting that the Hourglass itself is the northern extremity of this star-forming region), or it could be that the southern extension is the only visible part of a more symmetrical cluster embedded deep in the molecular gas (the southern part of the cluster lying in the cavity excavated by Herschel 36). The lack of visible background field stars towards the centre of the clump implies that the molecular gas is dense enough to extinguish stars even in the near-IR. High-resolution mid-IR imaging of the Hourglass cluster might find more deeply embedded members.
5. M8 E
The high-mass star-forming region M8 E was first reported by Wright et al. (1977) as a 70 m continuum source and as a strong CO peak off the eastern edge of earlier maps (Lada et al. 1976). An 11 m source whose position is consistent with M8 E appears in the AFCRL catalogue (CRL 2059, Walker & Price 1975). The CO data suggest that M8 E lies within a large (few arcmin) cloud of molecular gas, with mass of order M⊙. Bolometric luminosity estimates of L⊙ are roughly equivalent to a B0V star (Thronson et al. 1979; Mueller et al. 2002). The available IR to submillimetre continuum data have been summarised by Mueller et al. (2002).
Within the molecular gas, there is a small, but quite rich, embedded cluster: 7 IR sources in a region of less than a square arcminute have been catalogued (see Table 6), including a ZAMS B2 star powering a very small ( diameter) Hii region (M8E-Radio), and, only 7′′ away, M8E-IR, a massive YSO likely to become a B0 star (Simon et al. 1984, 1985; Linz et al. 2008). M8E-Radio is heavily-obscured and, if it is expanding at the sound speed, has a dynamical age of only 150 years. It has a cometary morphology, whose leading edge points approximately towards the bright rim of the M8E clump, although Linz et al. (2008) suggest that it could have been shaped by the outflow from M8E-IR (discussed below).
Although M8E-Radio is visible in the infrared (Simon et al. 1985), the cluster luminosity is dominated by M8E-IR up to a wavelength of 24.5 m (Linz et al. 2008). At longer wavelengths, we lack observations with sufficient angular resolution to distinguish the fluxes of the two main objects, up to cm-wave radio, where the Hii region is dominant. It is still unclear how the total luminosity of M8 E is divided between these two dominant sources (Simon et al. 1985; Linz et al. 2008).
The IR spectral lines observed by ISO (White et al. 1998) seem to arise from the Hii region and suggest a density of about cm-3. Longward of about 80 m, photometric data (measuring the sum of the luminosities of both components) are well fitted by a model of a spherical dust envelope with radius of 0.06 pc, temperature 28 K, mass about 80 M⊙, and bolometric luminosity of order L⊙. Submillimetre-wave continuum mapping (Tothill et al. 2002; Mueller et al. 2002) finds a source very close to the position of the Hii region, with 450 m and 850 m fluxes broadly in line with those reported by White et al. (1998). M8 E lies at the extreme eastern edge of the SCUBA maps, where image fidelity is dubious, but is at the centre of the 350 m map (Mueller et al. 2002).
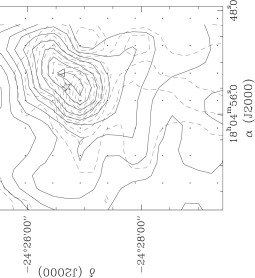
As IRAS 18018–2426, M8 E has been extensively studied as part of a programme to identify candidate high-mass protostars. It is classified as ‘Low’ (e.g. Beltrán et al. 2006), meaning that its IRAS colours are not consistent with those of UCHii regions, even though it does contain an Hii region with electron density at least 5000 cm-3 (Molinari et al. 1998), which is consistent with the ISO data. Based on NH3 emission, the kinetic temperature of the molecular gas is estimated at 31 K (Molinari et al. 1996), similar to the 29 K estimated from CO lines (Tothill et al. 2002). The clump has also been detected in HCN 1–0 (St. Clair Dinger et al. 1979) and CS 7–6 (Plume et al. 1992). No H2O masers have been detected towards M8 E, but OH maser emission has been detected at 1.665 GHz (Cohen et al. 1988), along with methanol masers at 44 GHz and 133 GHz (Slysh et al. 1997; Kogan & Slysh 1998).
The high-velocity molecular gas around M8 E has been mapped in CO 2–1 (Mitchell et al. 1991; Zhang et al. 2005, see Fig. 12): The red- and blueshifted gas masses are offset from one another by about 15′′, which suggests a bipolar outflow with a dynamical timescale of 104 years (Mitchell et al. 1992). Mitchell et al. (1991) studied the high-velocity molecular gas by the IR absorption of ro-vibrational transitions, tracing younger (100 year-old, Mitchell et al. 1988), hotter material. On this evidence, Mitchell et al. suggest that M8E-IR may be a FU Orionis-type object. The shortwards end of the ISO data (which should be dominated by M8E-IR) suggests a B0 star surrounded by a disk (White et al. 1998); the best-fitting models to mid-IR interferometric visibilities (Linz et al. 2008) are composed of a bloated central star (10–15 M⊙, equivalent to an early B star) with a small to non-existent disc (50 AU) surrounded by an envelope with bipolar cavities. Linz et al. point out that the massive accretion events causing FU Orionis-like outbursts could also cause the bloating of the central star.
Table 6. Stellar sources in M8 E
Source
R.A. (J2000.0)
Dec. (J2000.0)
Mid-IR sourcea
18:04:52.7
–24:26:41
M8E-Radiob,c
18:04:52.8
–24:26:36
M8E-IRb
18:04:53.3
–24:26:42
S85-4b
18:04:53.3
–24:26:15
S85-3b
18:04:53.7
–24:26:59
S85-2b
18:04:53.7
–24:26:22
S85-1b
18:04:54.1
–24:26:24
a Linz et al. (2008); b Simon et al. (1985)
c Dec. is misprinted in the original paper
6. Other Candidate Star-Forming Regions
M8 SE3/IRAS 18014–2428
Along with M8 E, this IR source lying within the M8 SE3 clump, has been extensively studied as a candidate high-mass protostar. Like M8 E, it is classified as a ‘Low’-type source, is detected in NH3 emission, giving a kinetic temperature of 27 K (compared with 21 K from CO lines), and is not associated with an H2O maser (Molinari et al. 1996). It is not detected in the radio continuum and shows no sign of outflow in molecular lines; however, the implied axis of the HH 896–7 jet passes very close to the IRAS source (see Fig. 7). Whether or not IRAS 18014–2428 is a protostar, it seems very likely that the M8 SE3 clump is a site of ongoing star formation.
The Central Ridge
Submillimetre continuum maps of M 8 (e.g. Fig. 6) reveal a ridge of dense gas running N–S, lying between the Hourglass and M8 E, including the submillimetre clumps EC 1–5. The X-ray data (Fig. 16) show an overdensity of sources near this ridge, suggesting that there may be star formation associated with it.
7. Simeis 188
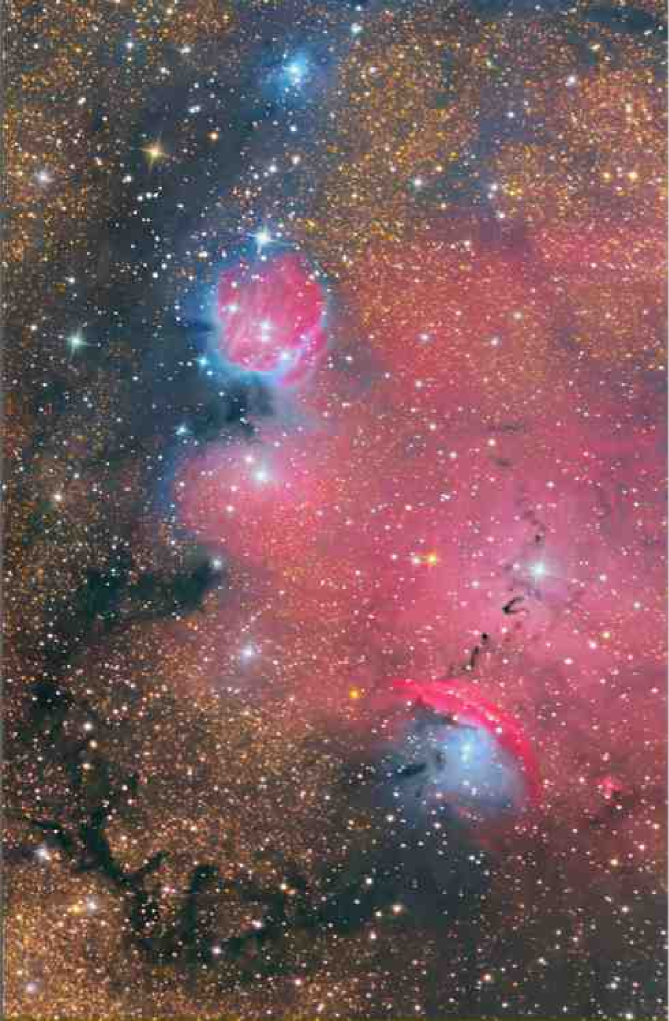
About a degree to the east of the Lagoon Nebula, Simeis 188888The designation comes from the catalogue of Gaze & Shajn (1955) developed at the Simeiz Observatory in Ukraine; these objects are traditionally spelled Simeis. comprises emission and reflection nebulae and dark clouds (Fig. 13; also Barnard 1892), and lies near a loose open cluster, Collinder 367, located within the Hii region IC 4685. The nebular features are identified in the annotated red-light DSS image (Figure 14) and their positions listed in Table 7 IC 4685 is a large diffuse nebula centred on V 3903 Sgr (HD 165921), an eclipsing binary comprising two main-sequence O stars (O7 V + O9 V), also discussed below (Vaz et al. 1997). On the southeastern edge of IC 4685, NGC 6559 is a bright-rimmed cloud, with the rim running NE–SW (see Figs. 13 & 14), and lying close to IRAS 18068–2405 (Sugitani & Ogura 1994; Ogura et al. 2002). The northeastern edge of Simeis 188 is dominated by two bright emission nebulae: IC 1274 in the north, illuminated by two stars, and IC 1275; these two are separated by the dark cloud B 91. North of IC 1274 lies IC 4684, a very small reflection nebula around the 9th magnitude B3 star HD 165872. There are two more Barnard dark nebulae lying in front of IC 4685: B 302 and B 303, just NW and SE of V 3903 Sgr, respectively. They seem to be components of a long thin dust lane lying across and in front of the emission nebula.
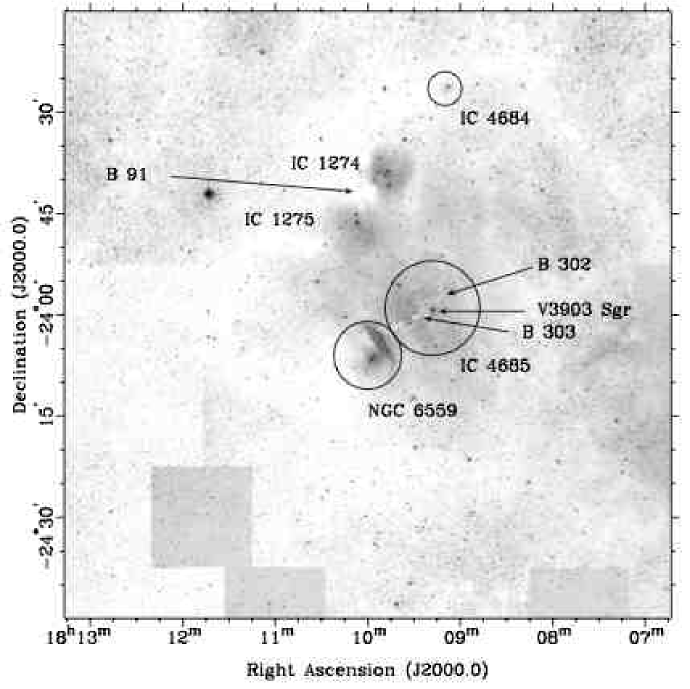
Table 7. Nebulae in Simeis 188
Nebula
RA (J2000.0)
Dec (J2000.0)
IC 4684
18:09:06
–23:25
IC 4685
18:09:18
–23:59
IC 1274
18:09:30
–23:44
IC 1275
18:10:00
–23:50
NGC 6559
18:10:00
–24:06
B 302
18:09:14
–23:58
B 303
18:09:29
–24:00
B 91
18:10:08
–23:42
Nebula data from Cragin & Bonanno (2001)
Collinder 367 is older than NGC 6530, but still fairly young, and lies at a similar distance (7 Myr and 1.2 kpc; Kharchenko et al. 2005). V 3903 Sgr is much younger, with an age (2 Myr) and distance similar to NGC 6530 (Vaz et al. 1997), and may represent a later generation of star formation. There is some evidence that this complex could be related to the Lagoon: Herbst et al. (1982) found that the various stars illuminating the nebulosity show reddening , quite similar to the abnormal reddening found towards M 8, and the nebulosity around M 8 extends all the way out to Simeis 188 (Fig. 1; also Barnard 1908).
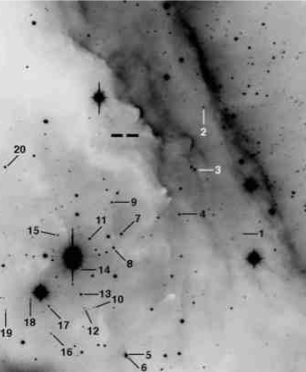
Herbig (1957) found 6 H emission stars (LkH 125–130) in the Simeis 188 region, of which he suggests that LkH 125 is unlikely to be associated with the nebulae. Based on the finding charts and instructions from that paper, positions of all 6 stars have been taken from the Digitised Sky Survey (or 2MASS in the case of LkH 130), and are given in Table 8. Ogura et al. (2002) found a further 23 H emission stars (but no Herbig-Haro objects): These fainter stars (Fig. 15) are probably T Tauri stars, whereas the 6 stars from Herbig (1957) are more likely to be HAeBes.
Table 8. H emission stars in Simeis 188, from Herbig (1957)
Star
R.A. (J2000.0)
Dec. (J2000.0)
LkH 125
18:07:58.3
–23:33:38a
LkH 126
18:09:23.6
–23:27:46a
LkH 127
18:09:35.7
–23:25:19a
LkH 128
18:09:45.5
–23:38:03a
LkH 129
18:09:46.1
–23:38:52a
LkH 130
18:09:47.3
–23:38:43b
a from WCS of DSS image
b from WCS of 2MASS -band image
8. The Structure and Evolution of the Lagoon Nebula
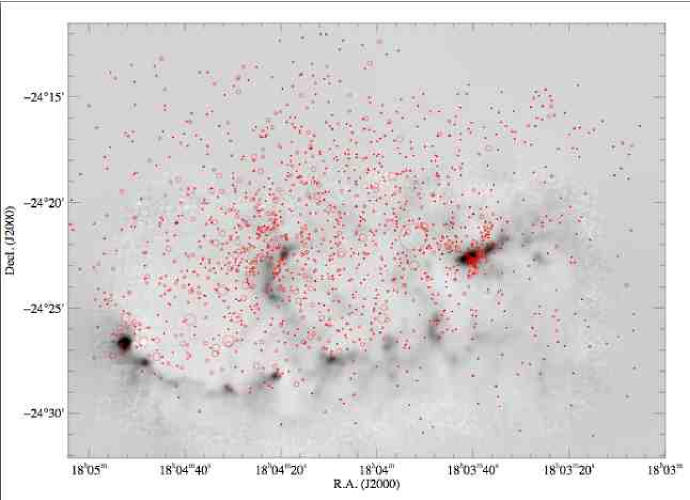
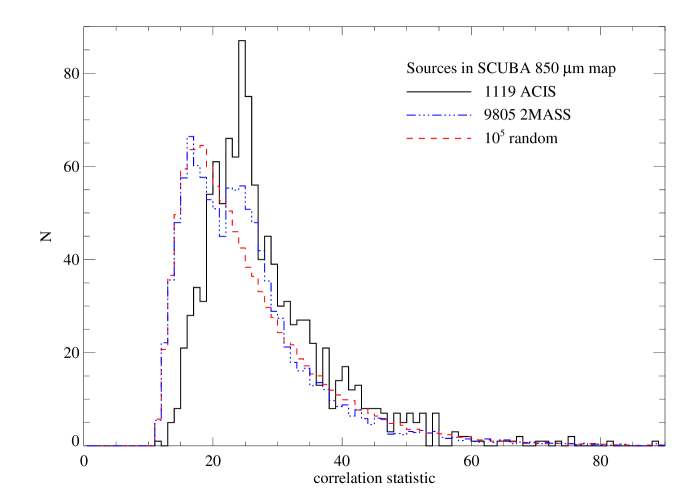
The Structure of Star Formation
Combining the Chandra images towards the Hourglass (Castro et al. 2008) and NGC 6530 (Damiani et al. 2004) yields a catalogue of 1482 X-ray sources spanning most of the region observed at 450 and 850 m by Tothill et al. (2002). Figure 16 suggests that X-ray sources tend to cluster near sub-mm emission cores, which is confirmed by Figure 17: This shows the spatial correlation of the 850 m flux to the location of each of the 1119 X-ray sources lying within the SCUBA map, and the same statistic for the 9805 2MASS sources in the map and for a set of random sources. The distributions show that the X-ray source locations are non-random and correlated with 850 m flux, as are about 20% of the 2MASS sources. In particular, Fig. 16 shows strong clustering around (but slightly offset from) M8 E (near 18:04:54, –24:26:30), the central ridge (near 18:04:20, –24:23), and Herschel 36 and the Hourglass (near 18:03:40, –24:23). In the central ridge (M8 EC1–5), three lines of X-ray sources are seen separated by from northeast to southwest. A number of smaller X-ray clusters appear close to 850 m cores along the southern rim, specifically: M8 SC8, SC1, SE1, SE3, and SE7. Barbá & Arias (2007) also found H-H objects associated with M8 SC8, SE3 and C3.
There are other bright rims and globules in and around the Lagoon, most of which seem to be due to the action of 9 Sgr, such as the bright rims of Sugitani & Ogura (1994), the globule near the Hourglass (Arias et al. 2006) and the elephant trunk found near M8 E (Brand & Zealey 1978). These structures, along with the widespread T Tauri star population (Prisinzano et al. 2005; Arias et al. 2007), suggest pervasive star formation in the Lagoon, in addition to the young clusters found around the Hourglass and M8 E.
Star Formation History
While most authors ascribe an age of a few Myr to NGC 6530, the oldest element of the Lagoon Nebula, van den Ancker et al. (1997) argue for a much older cluster (by an order of magnitude), based on the probable cluster members found in the giant branch of the H-R diagram. These members seem to be worth investigation: If star formation has really been going on for a few tens of Myr, and is still ongoing at a significant rate, M 8 would be a very long-lived star-forming region. van den Ancker et al. also suggest, because of the lack of massive stars on the ZAMS, that massive star formation has essentially ceased. This may be true of NGC 6530, but massive star formation in M 8 as a whole is not over.
Lightfoot et al. (1984) identified a possible sequence of triggered star formation in M 8: NGC 6530 is the oldest feature, and some of its members are still ionising the main Hii region, NGC 6523, while younger features are found around the edge of the region, most obviously in the Hourglass and M8 E. The O stars in the cluster are also found at the periphery, while the core contains only B stars and later, and it is not clear why this should be so: Do the peripheral O stars represent a later generation of star formation? If so, it is odd that there are no signs of any O stars corresponding to the 60 B stars in the core, either as main-sequence O stars or as post-MS objects. However, the basic picture of star formation proceeding outwards from the core of NGC 6530 is well-supported by evidence of age gradients (e.g. Damiani et al. 2004; Arias et al. 2007) as well as the prevalence of massive young stars, X-ray sources and H-H objects around the dense molecular cores around the edge of the Lagoon. There are also signs of star formation elsewhere in M 8, e.g. the sample of candidate Class I sources concentrated to the northeast of the Hourglass (Damiani et al. 2006).
The Structure of the Lagoon Nebula
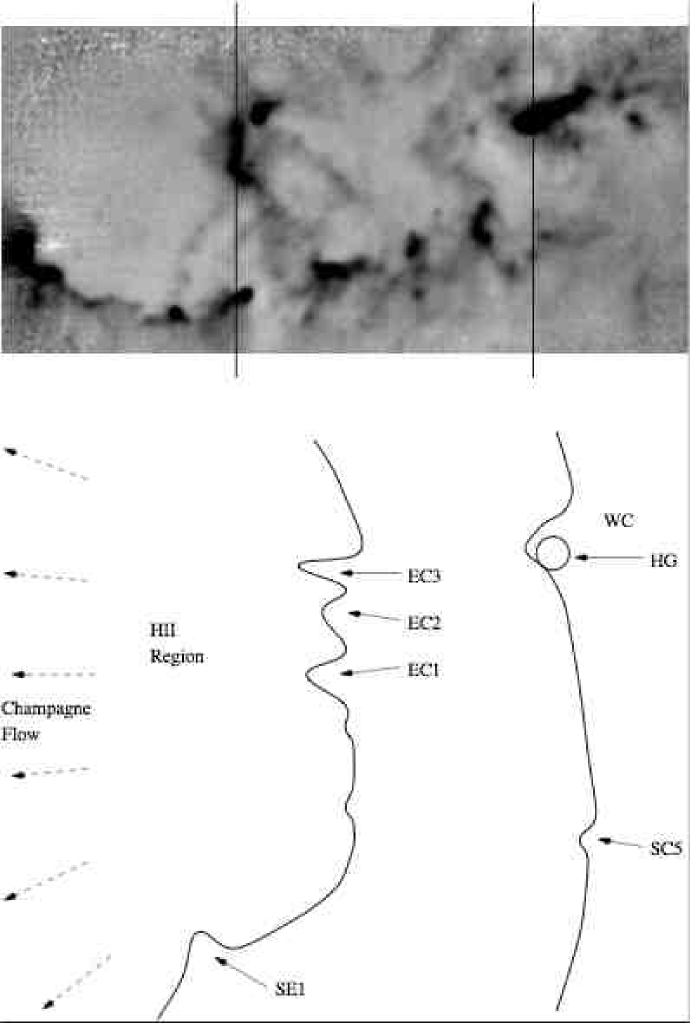
Compared to the clumps along the southern and southeastern rims of the Lagoon Nebula, the EC clumps seem to fall off fairly shallowly on all sides. This suggests that the central ridge may lie behind the Hii region, and we see the structure face-on, rather than the edge-on view of the southern clumps (see Fig. 18). Woodward et al. (1986) argue convincingly that the Hourglass is embedded in the molecular cloud behind the Lagoon, whereas M8 E shows a steep fall-off into the Hii region. So we see ongoing star formation both behind and to the southeast of the ionised gas, suggesting that the ionisation front is moving away from us and to the south and east, compressing and warming the molecular gas (giving rise to submillimetre and CO emission) and presumably triggering star formation, with X-ray emitting YSOs appearing tightly clustered in the wake of the front.
There are indications of a thin screen of material between us and M 8, somewhat blueshifted. This might be the last remnants of the front of the molecular cloud, excavated by a blister Hii region on the front side of the cloud, and accelerated towards us by the ionised gas.
9. Closing Remarks
Bok & Reilly (1947) commented, at the end of their paper on globules in the Milky Way, many of them in M 8, that every one of the globules they had just described merited further careful study “with the largest available reflecting telescopes”. We believe that this advice is still valid, 60 years later. New observing facilities and techniques at many different wavelengths are giving us new opportunities to understand this region: The impact of the latest X-ray observations is immense, since it makes it much easier to disentangle young stars from the background. The wider availability of large telescopes, allowing photometry and spectroscopy of faint stars, enables proper classification of the lower-mass PMS population (e.g. Arias et al. 2007). Spitzer data (e.g. Fig. 3) offer further opportunities to select sources of interest out of the crowded background. Using time-domain photometry, asteroseismology allows detailed modelling of PMS stars in NGC 6530 (Guenther et al. 2007). Aperture-synthesis observations at millimetre- and submillimetre-wavelengths may be used to compensate for the effects of distance, in order to search for protostars in the molecular cores around the Nebula; mid-IR interferometry is already yielding new insights into the massive young stars in M8 E (Linz et al. 2008).
Acknowledgements. We are most grateful to the referees, Julia Arias and Rodolfo Barbá, whose careful reading and comments have improved this work. We also thank Steve Rodney for his work on the bibliography, Qizhou Zhang, Eric Mamajek, Phil Castro and Nathan Mayne for helpful discussions, and Bo Reipurth for his editorial work. We thank Gerald Rhemann, Richard Crisp, Jean-Charles Cuillandre, and Tony Hallas for use of Figures 1, 4, 7b, and 13, respectively. NFHT gratefully acknowledges financial support from the University of Exeter DVC (Resources) Discretionary Fund and from the European Commission (grant MIRG-CT-2006-044961), and thanks the crew of Amundsen-Scott South Pole Station, where an early draft was written. This review has made use of: NASA’s Astrophysics Data System; the SIMBAD database, operated at CDS, Strasbourg; the Skyview facility located at NASA’s Goddard Space Flight Center; the WEBDA database, operated at the Institute for Astronomy at the University of Vienna.
References
- Acord (1998) Acord, J. M., Churchwell, E., & Wood, D. O. S. 1998, ApJ, 495, 107
- Allen (1986) Allen, D. A. 1986, MNRAS, 319, 35P
- Arias et al. (2002) Arias, J. I., Morrell, N. I., Barbá, R. H., Bosch, G. L., Grosso, M., & Corcoran, M. 2002, MNRAS, 333, 202
- Arias et al. (2006) Arias, J. I., Barbá, R. H., Maíz Apellániz, J., Morrell, N. I., & Rubio, M. 2006, MNRAS, 366, 739
- Arias et al. (2007) Arias, J. I., Barbá, R. H., & Morrell, N. I. 2007, MNRAS, 374, 1253
- Barbá & Arias (2007) Barbá, R. H. & Arias, J. I. 2007, A&A, 471, 841
- Barnard (1892) Barnard, E. E. 1892, AN, 130, 233
- Barnard (1908) Barnard, E. E. 1908, AN, 177, 231
- Beltrán et al. (2006) Beltrán, M. T., Brand, J., Cesaroni, R., Fontani, F., Pezzuto, S., Testi, L., & Molinari, S. 2006, A&A, 447, 221
- Bica et al. (2003) Bica, E., Dutra, C. M., Soares, J., & Barbuy, B. 2003, A&A, 404, 223
- Boesono et al. (1987) Boesono, B., Thé, P. S., & Tjin a Djie, H. R. E. 1987, Ap&SS, 137, 167
- Böhm-Vitense et al. (1984) Böhm-Vitense, E., Hodge, P., & Boggs, D. 1984, AJ, 287, 825
- Boggs & Böhm-Vitense (1989) Boggs, D. & Böhm-Vitense, E. 1984, ApJ, 339, 209
- Bohuski (1973a) Bohuski, T. J. 1973a, ApJ, 183, 851
- Bohuski (1973b) Bohuski, T. J. 1973b, ApJ, 184, 93
- Bok & Reilly (1947) Bok, B. J. & Reilly, E. F. 1947, ApJ, 105, 255
- Brand & Zealey (1978) Brand, P. W. J. L. & Zealey, W. J. 1978, A&A, 63, 345
- Burnham (1978) Burnham, R., Jr. 1978, Burnham’s Celestial Handbook, Vol. III (New York: Dover)
- Burton (2002) Burton, M. G. 2002, PASA, 2002, 19, 260
- Castro et al. (2008) Castro, P. J., Gagné, M., Stecklum, B., Kenworthy, M. A., & Tothill, N. F. H. 2008, in preparation
- Chen et al. (2007) Chen, L., de Grijs, R., & Zhao, J. L. 2007, AJ, 134, 1368
- Chini & Neckel (1981) Chini, R. & Neckel, T. 1981, A&A, 102, 171
- Cohen et al. (1988) Cohen, R. J., Baart, E. E., & Jonas, J. L. 1988, MNRAS, 231, 205
- Cragin & Bonanno (2001) Cragin, M. & Bonanno, E. 2001, Uranometria 2000.0 Vol. 3, Deep Sky Field Guide, 2nd ed (Willman-Bell, Richmond, VA)
- Damiani et al. (2004) Damiani, F., Flaccomio, E., Micela, G., Sciortino, S., Harnden, F. R., Jr. & Murray, S. S. 2004, ApJ, 68, 781
- Damiani et al. (2006) Damiani, F., Prisinzano, L., Micela, G., Sciortino, S. 2006, A&A, 459, 477
- De Marco et al. (2006) De Marco, O., O’Dell, C. R., Gelfond, P., Rubin, R. H., & Glover, S. C. O. 2006, AJ, 131, 2580
- Ducourant et al. (2005) Ducourant, C., Teixeira, R., Périé, J. P., Lecampion, J. F., Guibert, J., & Sartori, M. J. 2005, A&A, 438, 769
- Dufour (1994) Dufour, R. J. 1994, Rev. Mex. Astron. Astrofis., 29, 88
- Duncan (1920) Duncan, J. C. 1920, ApJ, 51, 4
- Dyck (1977) Dyck, H. M. 1977, AJ, 82, 129
- Elliot & Meaburn (1975) Elliot, K. H. & Meaburn, J. 1975, MNRAS, 172, 427
- Esteban et al. (1999) Esteban, C., Peimbert, M., Torres-Peimbert, S., García-Rojas, J., & Rodríguez, M. 1999, ApJS, 120, 113
- Gaze & Shajn (1955) Gaze, V. F. & Shajn, G. A. 1955, Izv. Krym. Astrofiz. Obs., 15, 11
- Georgelin & Georgelin (1970a) Georgelin, Y. P. & Georgelin, Y. M. 1970a, A&A, 6, 349
- Georgelin & Georgelin (1970b) Georgelin, Y. P. & Georgelin, Y. M. 1970b, A&A, 7, 133
- Getman et al. (2005) Getman, K. V., Flaccomio, E., Broos, P. S., Grosso, N., Tsujimoto, M., et al. 2005, ApJS, 160, 319
- Gillett & Stein (1970) Gillett, F. C. & Stein, W. A. 1970, ApJ, 159, 817
- Götz (1972) Götz, W. 1972, AN, 294, 9
- Goto et al. (2006) Goto, M., Stecklum, B., Linz, H., Feldt, M., Henning, T., Pascucci, I., & Usuda, T. 2006, ApJ, 649, 299
- Goudis (1976) Goudis, C. 1976, Ap&SS, 40, 281
- Guenther et al. (2007) Guenther, D. B., Kallinger, T., Zwintz, K., Weiss, W. W, & Tanner, J. 2007, ApJ, 671, 581
- Herbst et al. (1982) Herbst, W., Miller, D. P., Warner, J. W., & Herzog, A. 1982, AJ, 87, 98
- Herbig (1957) Herbig, G. H. 1957, ApJ, 125, 654
- Hiltner et al. (1965) Hiltner, W. A., Morgan, W. W., & Neff, J. S. 1965, ApJ, 141, 183
- Hirota et al. (2007) Hirota, T., Bushimata, T., Choi, Y. K., Honma, M., Imai, H., et al. 2007, PASJ, 59, 897
- Humphreys (1978) Humphreys, R. M. 1978, ApJS, 38, 309
- Johnson & Morgan (1953) Johnson, H. L. & Morgan W. W. 1953, ApJ, 117, 313
- Johnson (1973) Johnson, H. M. 1973, ApJ, 182, 497
- Kharchenko et al. (2005) Kharchenko, N. V., Piskunov, A. E., Röser, S., Schilbach, E., & Scholz, R.-D. 2005, A&A, 438, 1163
- Kilambi (1977) Kilambi, G. C. 1977, MNRAS, 178, 423
- Kogan & Slysh (1998) Kogan, L. & Slysh, V. I. 1998, ApJ, 497, 800
- Kumar et al. (2004) Kumar, B., Sagar, R., Sanwal, B. B., & Bessell, M. S. 2004, MNRAS, 353, 991
- Lada et al. (1976) Lada, C. J., Gull, T. R., Gottlieb, C. A & Gottlieb, E. W. 1976, ApJ, 203, 159
- Levenhagen & Leister (2006) Levenhagen, R. S. & Leister, N. V. 2006, MNRAS, 371, 252
- Lightfoot et al. (1984) Lightfoot, J. F., Deighton, D. W., Furniss, I., Glencross, W. M., Hirst, C. J., et al. 1984, MNRAS, 208, 197
- Linz et al. (2008) Linz, H., Henning, T., Stecklum, B., Men’shchikov, A., van Boekel, R., et al. 2008, in Massive Star Formation: Observations Confront Theory, eds. H. Beuther, H. Linz, & T. Henning (San Francisco: ASP)
- Loktin & Beshenov (2001) Loktin, A. V. & Beshenov, G. V. 2001, Astronomy Letters, 27, 386
- Lynds & O’Neil (1982) Lynds, B. T. & O’Neil, E. J., Jr. 1982, ApJ, 263, 130
- Mayne et al. (2007) Mayne, N. J., Naylor, T., Littlefair, S. P., Saunders, E. S., & Jeffries, R. D. 2007, MNRAS, 375, 1220
- Mayne & Naylor (2008) Mayne, N. J. & Naylor, T. 2008, MNRAS, 386, 261
- McCall et al. (1990) McCall, M. L., Richer, M. G., & Visvanathan, N. 1990, ApJ, 357, 502
- Meaburn (1971) Meaburn, J. 1971, Ap&SS, 13, 110
- Messier (1781) Messier, C. 1781, in Connoissance des Temps Almanac for 1784 (Paris), 217
- Mitchell et al. (1988) Mitchell, G. F., Allen, M., Beer, R., Dekany, R., Huntress, W., & Maillard, J.-P. 1988, ApJ, 327, L17
- Mitchell et al. (1991) Mitchell, G. F., Maillard, J.-P., & Hasegawa, T. I. 1991, ApJ, 371, 342
- Mitchell et al. (1992) Mitchell, G. F., Hasegawa, T. I., & Schella, J. 1992, ApJ, 386, 604
- Molinari et al. (1996) Molinari, S., Brand, J., Cesaroni, R., & Palla, F. 1996, A&A, 308, 573
- Molinari et al. (1998) Molinari, S., Brand, J., Cesaroni, R., Palla, F., & Palumbo, G. G. C 1998, A&A, 336, 339
- Mueller et al. (2002) Mueller, K. E., Shirley, Y. L., Evans, N. J, II, & Jacobson, H. R. 2002, ApJS, 143, 469
- Naylor & Jeffries (2006) Naylor, T. & Jeffries, R. D. 2006, MNRAS, 373, 1251
- Neckel & Chini (1981) Neckel, T. & Chini, R. 1981, A&AS, 45, 451
- Niemela & Morrison (1988) Niemela, V. S. & Morrison, N. D. 1988, PASP, 100, 1436
- Ogura et al. (2002) Ogura, K., Sugitani, K., & Pickles, A. 2002, AJ, 123, 2597
- Pereira et al. (2003) Pereira, C. B., Franco, C. S., & de Araújo, F. X. 2003, A&A, 397, 927
- Plume et al. (1992) Plume, R., Jaffe, D. T., & Evans, N. J., II 1992, ApJS, 78, 505
- Prisinzano et al. (2005) Prisinzano, L., Damiani, F., Micela, G., & Sciortino, S. 2005, A&A, 430, 941
- Prisinzano et al. (2007) Prisinzano, L., Damiani, F., Micela, G., & Pillitteri, I. 2007, A&A, 462, 123
- Rauw et al. (2002) Rauw, G., Nazé, Y., Gosset, E., Stevens, I.R., Blomme, R., et al. 2002, A&A, 395, 499
- Rauw et al. (2005) Rauw, G., Sana, H., Gosset, E., De Becker, M., Arias, J., et al. 2005, in Massive Stars and High-Energy Emission in OB Associations, eds. G. Rauw, Y. Nazé, R. Blomme, & E. Gosset, 85
- Reipurth (1981) Reipurth, B. 1981, A&AS, 44, 379
- Rieke & Lebofsky (1985) Rieke, G. H. & Lebofsky, M. J. 1985, ApJ, 288, 618
- Roberts et al. (2007) Roberts, L. C. Jr, Turner, N. H., & ten Brummelaar, T. A. 2007, AJ, 133, 545
- Roeser & Bastian (1988) Roeser, S. & Bastian, U. 1988, A&AS, 74, 449
- Sagar & Joshi (1978) Sagar, R. & Joshi, U. C. 1978, MNRAS, 184, 467
- Sanduleak & Stephenson (1973) Sanduleak, N. & Stephenson, C. B. 1973, ApJ, 185, 899
- Simon et al. (1984) Simon, M., Cassar, L., Felli, M., Fischer, J., Massi, M., & Sanders, D. 1984, ApJ, 278, 170
- Simon et al. (1985) Simon, M., Peterson, D. M., Longmore, A. J., Storey, J. W. V., & Tokunaga, A. T., 1985, ApJ, 298, 328
- Slysh et al. (1997) Slysh, V. I., Kalenskii, S. V., Val’tts, I. E., & Golubev, V. V. 1997, ApJ, 478, L37
- St. Clair Dinger et al. (1979) St. Clair Dinger, A., Dickinson, D. F., Gottlieb, C. A, & Gottlieb, E. W. 1979, PASP, 91, 830
- Stecklum et al. (1995) Stecklum, B., Henning, T., Eckart, A., Howell, R. R., & Hoare, M. G. 1995, ApJ, 445, L153
- Stecklum et al. (1998) Stecklum, B., Henning, T., Feldt, M., Hayward, T. L., Hoare, M. G., Hofner, P., & Richter, S. 1998, AJ, 115, 767
- Stecklum et al. (1999) Stecklum, B., Hayward, T. L., & Hofner, P. 1999, in Astronomy with Adaptive Optics, ed. D. Bonaccini (Garching: ESO), 421
- Sugitani & Ogura (1994) Sugitani, K. & Ogura, K. 1994, ApJS, 92, 163
- Sung et al. (2000) Sung, H., Chun, M.-Y., & Bessell, M. S. 2000, AJ, 120, 333
- Taylor et al. (1989) Taylor, B. J., Joner, M. D., & Johnson, S. B. 1989, AJ, 97, 1798
- Teixeira et al. (2000) Teixeira, R., Ducourant, C., Sartori, M. J., Camargo, J. I. B., Périé, J. P., Lépine, J. R. D., & Benevides-Soares, P. 2000, A&A, 361, 1143
- Thackeray (1950) Thackeray, A. D. 1950, MNRAS, 110, 343
- Thé (1960) Thé, P.-S. 1960, ApJ, 132, 40
- Thronson et al. (1979) Thronson, H. A. Jr., Loewenstein, R. F., & Stokes, G. M. 1979, AJ, 84, 1328
- Torres (1987) Torres, A. V. 1987, ApJ, 322, 949
- Tothill (1999) Tothill, N. F. H. 1999, Ph.D. Thesis, University of London
- Tothill et al. (2002) Tothill, N. F. H., White, G. J., Matthews, H. E., McCutcheon, W. H., McCaughrean, M. J. & Kenworthy, M. A. 2002, ApJ, 580, 285
- van Altena & Jones (1972) van Altena, W. F. & Jones, B. F. 1972, A&A, 20, 425
- van den Ancker et al. (1997) van den Ancker, M. E., Thé, P. S., Feinstein, A., Vázquez, R. A., de Winter, D., & Pérez. M. R. 1997, A&AS, 123, 63
- Vaz et al. (1997) Vaz, L. P. R., Cunha, N. C. S., Vieira, E. F., & Myrrha, M. L. M. 1997, A&A, 327, 1094
- Velázquez (2002) Velázquez, P. F., Dubner, G. M., Goss, W. M., & Green, A. J. 2002, AJ, 124, 2145
- Velghe (1957) Velghe, A. G. 1957, ApJ, 126, 302
- Walborn (1973) Walborn, N. R. 1973, AJ, 78, 1067
- Walker (1957) Walker, M. F. 1957, ApJ, 125, 636
- Walker (1961) Walker, M. F. 1961, ApJ, 133, 1081
- Walker & Price (1975) Walker, R. G. & Price, S. D. 1975, AFCRL Infrared Sky Survey (Air Force Cambridge Research Labs., Hanscom AFB, MA), Vol I, AFCRL-TR-75-0373
- Wallenquist (1940) Wallenquist, A. 1940, Uppsala Ann. 3
- Welsh (1983) Welsh, B. Y. 1983, MNRAS, 204, 1203
- Wen et al. (2006) Wen, W., Zhao, J.-L., & Chen, L. 2006, ChA&A, 30, 274
- White et al. (1997) White, G. J., Tothill, N. F. H., Matthews, H. E., McCutcheon, W. H., Huldtgren, M. & McCaughrean, M. J. 1997, A&A, 323, 529
- White et al. (1998) White, G. J., Nisini, B., Correia, J. C., Tothill, N. F. H., Huldtgren, M., et al. 1998, in Star Formation with the Infrared Space Observatory, ASP Conf. Ser. 132, 113 (ASP, San Francisco)
- Wood & Churchwell (1989) Wood, D. O. S. & Churchwell, E. 1989, ApJS, 69, 831
- Woodward et al. (1986) Woodward, C. E., Pipher, J. L., Helfer, H. L., Sharpless, S., Moneti, A., et al. 1986, AJ, 91, 870
- Woodward et al. (1990) Woodward, C. E., Pipher, J. L., Helfer, H. L. & Forrest, W. J. 1990, ApJ, 365, 252
- Woolf et al. (1973) Woolf, N. J, Stein, W. A., Gillett, F. C., Merrill, K. M., Becklin, E. E., et al. 1973, ApJ, 179, L111
- Wright et al. (1977) Wright, E. L., Lada, C. J., Fazio, G. G., Kleinmann, D. E., & Low, F. J. 1977, AJ, 82, 132
- Zhang et al. (2005) Zhang, Q., Hunter, T. R., Brand, J., Sridharan, T. K., Cesaroni, R., et al. 2005, ApJ, 625, 864
- Zhao et al. (2006) Zhao, J.-L., Chen, L., & Wen, W. 2006, ChJAA, 6, 435
- Zwintz & Weiss (2006) Zwintz, K. & Weiss, W. W. 2006, A&A, 457, 237