Multi-color Near Infra-red Intra-day and Short Term Variability
of the Blazar S5 0716714
Abstract
In this paper, we report results of our near-infrared (NIR) photometric variability studies of the BL Lacertae object S5 0716714. NIR photometric observations spread over 7 nights during our observing run April 29, 2007 at 1.8 meter telescope equipped with KASINICS (Korea Astronomy and Space Science Institute Near Infrared Camera System) and J, H, and Ks filters at Bohyunsan Optical Astronomy Observatory (BOAO), South Korea. We searched for intra-day variability, short term variability and color variability in the BL Lac object. We have not detected any genuine intra-day variability in any of J, H, and Ks passbands in our observing run. Significant short term variability 32.6%, 20.5% and 18.2% have been detected in J, H, Ks passbands, respectively, and 11.9% in (J-H) color.
1 Introduction
Blazars constitute a small subclass of the most enigmatic class of radio-loud active galactic nuclei (AGNs) consisting of BL Lacertae objects (BL Lacs) and flat spectrum radio quasars (FSRQs). BL Lacs show largely featureless optical continuum. Blazars exhibit strong flux variability at all wavelengths of the complete electromagnetic (EM) spectrum, strong polarization () from radio to optical wavelengths, usually core dominated radio structures, and predominantly nonthermal radiation at all wavelengths. In a unified model of radio-loud AGNs based on the angle between the line of sight and the emitted jet from the source, blazars jets make angle of 10∘ from the line of sight (Urry & Padovani 1995).
From the study of the spectral energy distributions (SEDs) of blazars, it is found that blazars SEDs have two peaks (Fossati et al. 1998; Ghisellini et al. 1998). The first component peaks at near-infrared (NIR)/optical in low energy peaked blazars (LBLs) and at UV/X-rays in high energy peaked blazars (HBLs). The second component peaks at GeV energies in LBLs and at TeV energies in HBLs. The EM emission is dominated by synchrotron component at low energies and at high energies probably by the inverse Compton (IC) component (Coppi 1999, Sikora & Madejski 2001, Krawczynski 2004).
From observations of blazars, it is known that they vary on the diverse time scales ranging from a few minutes to several years. Blazars variability can be broadly divided into three classes viz. intra-day variability (IDV) or intra-night variability or micro-variability, short term variability and long term variability. Variations in flux of a few tenth of a magnitude over the course of a day or less is often known as IDV (Wagner & Witzel 1995). Short and long term variabilities can have time scales from a few weeks to several months and several months to years, respectively.
First convincing optical IDV in blazar was reported by Miller et al. (1989), and since then variability of blazars on diverse time scales in radio to optical bands have been studied extensively and results have been reported in large number of papers (e.g. Carini 1990; Mead et al. 1990; Takalo et al. 1992, 1996; Heidt & Wagner 1996; Sillanpää et al. 1996a, 1996b; Bai et al. 1998, 1999; Fan et al. 1998, 2002, 2007; Xie, et al. 2002; Ciprini et al. 2003, 2007; Gupta et al. 2004, 2008a, 2008b; Stalin et al. 2005 and references therein). In a recent paper, Gupta & Joshi (2005) have done statistical analysis of occurrence of optical IDV in different classes of AGNs. They divided their sample of 113 optical lights curves of blazars in three different time durations and found 64%(18/28), 63%(29/46), and 82%(32/39) blazars show IDV if observed for 3h, 3h to 6h, and 6h, respectively.
S5 0716714 ( 07:21:53.4, 71:20:36.4) is one of the brightest BL Lac object which has featureless optical continuum. The non detection of its host galaxy first sets a lower limit of redshift z 0.3 (Wagner et al. 1996), and then z 0.52 (Sbarufatti et al. 2005). Very recently, Nilsson et al. (2008) have claimed of its host galaxy detection which produces a “standard candle” value of . Wagner & Witzel (1995) reported that the duty cycle of the source is one which implies that the source is almost always in the active state. The variability of S5 0716714 has been studied in the complete EM spectrum on all time scales (e.g. Raiteri et al. 2003; Gupta et al. 2008a and references therein). Large and variable optical polarization in the source has been reported (Takalo et al. 1994; Fan et al. 1997; Impey et al. 2000). Since 1994, this source has been extensively monitored in optical bands. There are 5 major optical outbursts reported in the source: at the beginning of 1995, in late 1997, in the fall of 2001, in March 2004 and in the beginning of 2007 (Raiteri et al. 2003; Foschini et al. 2006; Gupta et al. 2008a). These 5 outbursts give possible period of long term variability of 3.00.3 years.
Compared to radio and optical bands, there are only a few attempts to search for NIR flux variability on diverse timescales in blazars (e.g. Mead et al. 1990; Takalo et al. 1992; Gupta et al. 2004; Hagen-Thorn et al. 2006 and references therein). Since blazars emit radiations in the complete EM spectrum, they are ideal candidates for multi-wavelength observations. But either due to unavailability of good quality NIR detectors or unavailability of low humidity observing sites at several 1-2 meter class NIR/optical telescopes around the world, there were no focused effort to search for NIR flux variability in LBLs in which SEDs synchrotron component peaks in NIR/optical bands. Now we have an excellent opportunity to carry out such observations from the Bohyunsan Optical Astronomy Observatory (BOAO), South Korea which has 1.8 meter telescope and is equipped with KASINICS (Korea Astronomy and Space Science Institute Near Infrared Camera System) (Moon et al. 2008). We have recently started our long term pilot project to search for flux variability on diverse time scales in LBLs. Our present and future planned observations will fill the gap between radio and optical bands and will give deep insight into the important and less studied NIR flux variability properties of LBLs. Simultaneous radio to gamma-ray observations will be useful to detect the synchrotron and IC component peaks of LBLs from the SEDs and will be useful to understand the emission mechanism of LBLs in the complete EM spectrum. With this motivation, we recently carried out J, H, Ks bands photometric observations of our first target, the BL Lac object S5 0716714 which is a LBL, in 7 observing nights during April 2 April 9, 2007.
The paper is structured as follows: section 2 describes observations and data reduction methods, in section 3 we mention our results, the discussions and conclusions of the present work is reported in section 4.
2 Observations and Data Reduction
The time-series observations of S5 0716+714 were carried out in J, H and Ks bands during April 29, 2007 using KASINICS mounted at the 1.8 m telescope of BOAO in South Korea. On April 4, observations were made only in J and Ks bands. The on-source integration time in each band was 120 sec throughout the observations except 60 sec on April 4. The KASINICS has field of view of arcmin2 with a 512 512 InSb array ALADDIN III Quadrant. Image frames were obtained in four dithered positions, offset by 15 arcsec. In all image frames of S5 0716714, two standard stars, Star no. 3 and Star no. 5 of Villata et al. (1998) were always present.
Each image frame was processed to subtract the dark, to correct the pixel-to-pixel inhomogeneity (flat fielding), to remove the bad pixels and cosmic rays. In order to remove the sky background, we subtracted another dithered image at a different position from an object image frame. Then four dithered images were aligned and average-combined to improve the signal-to-noise (S/N) ratio. Instrumental magnitudes of the standard stars and the blazar in the processed image frames were measured by the aperture photometry. Data reductions and deriving the instrumental magnitudes were performed using standard routines in IRAF111IRAF is distributed by the National Optical Astronomy Observatories, which are operated by the Association of Universities for Research in Astronomy, Inc., under cooperative agreement with the National Science Foundation. (Image Reduction and Analysis Facility) software. Additional C programs were developed locally for automated data processing.
Since the object and the standard stars were observed in the same image frame, no correction for atmospheric extinction was done. Two standard stars in the blazar field were used to check the non-variable characteristics of standard stars and finally one standard star (Star no. 3) was used to calibrate the instrumental magnitudes of the blazar S5 0716+714. The reliability of the photometry is verified by differential magnitudes of standard stars (Star no. 5 Star no. 3). The results remain consistent throughout the observations within 1 sigma of 0.021, 0.028 and 0.028 in J, H and Ks bands, respectively.
3 Results
3.1 Variability Detection Criterion
Time variability of the blazar S5 0716714 is investigated by using the parameter C (Romero et al. 1999) defined as the average of C1 and C2
| (1) |
Using aperture photometry of the blazar and two standard stars in the blazar field, we determined the differential instrumental magnitude of the blazar standard star A, blazar standard star B and standard star A standard star B. We determined observational scatter from blazar standard star A ( (BL Star A)), blazar standard star B ( (BL Star B)) and standard star A standard star B ( (Star A Star B)).
If C 2.57, the confidence limit of variability is 99%. The typical uncertainty level in our calculation of C parameter itself is 1020%. Here we used Star no. 5 and 3 of Villata et al. (1998) as Star A and Star B respectively. J, H, Ks magnitude of these standard stars are taken from the 2MASS catalogue222www.ipac.caltech.edu/2mass/ (Skrutskie et al. 2006). Final calibration of S5 0716714 data is done by Star B (Star no. 3). Photometric software in IRAF does not give actual internal error of brightness but it gives photon noise. The internal photometric errors of brightness for each J, H and Ks band are estimated using artificial add star experiment as described by Stetson (1987). We found that the standard deviation () in each J, H and Ks band is 1.5 times larger than the typical photon noise. So, the typical photometric error in each J, H and Ks band is 0.01 mag.
3.2 Intra-Day Variability
J Passband
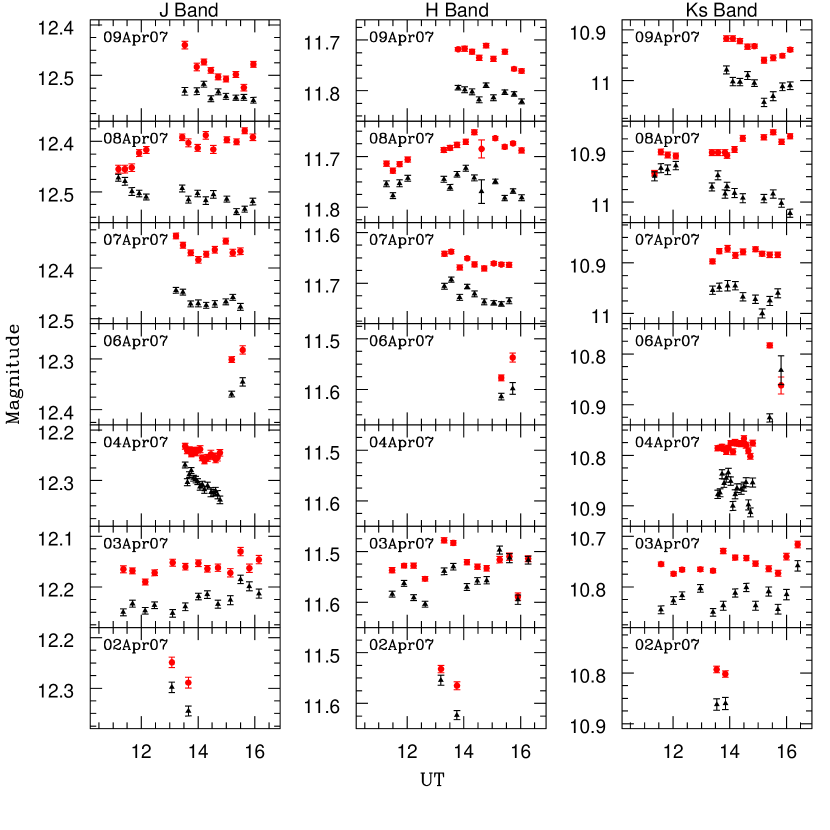
We observed the blazar S5 0716714 on April 2, 3, 4, 6, 7, 8 and 9, 2007 in J passband. The light curves of the blazar (filled circles) and differential instrumental magnitude (star 5 - star 3) (filled triangles) with different arbitrary offsets are displayed in different panels in the left column of the Fig. 1. Date of observations are marked in the panels. We performed the IDV detection test described above by equation (1), and got the value of C for April 2, 3, 4, 6, 7, 8 and 9, 2007 are 0.50, 0.75, 0.64, 0.50, 1.04, 1.83 and 2.30, respectively (see Table 1), which confirms that the source has not shown genuine IDV on any night of our 7 nights of observations in J passband. Photometric data of the observing campaign in J passband is reported in Table 2.
H Passband
We observed the blazar S5 0716714 on April 2, 3, 6, 7, 8 and 9, 2007 in H passband. The light curves of the blazar (filled circles) and differential instrumental magnitude (star 5 - star 3) (filled triangles) with different arbitrary offsets are displayed in different panels in the middle column of the Fig. 1. Date of observations are marked in the panels. We performed the IDV detection test described above by equation (1), and got the value of C for April 2, 3, 6, 7, 8 and 9, 2007 are 0.49, 0.79, 2.05, 0.62, 1.22 and 1.32, respectively (Table 1), which confirms that the source has not shown genuine IDV on any night of our 6 nights of observations in H passband. Photometric data of the observing campaign in H passband is reported in Table 3.
Ks Passband
We observed the blazar S5 0716714 on April 2, 3, 4, 6, 7, 8 and 9, 2007 in Ks passband. The light curves of the blazar (filled circles) and differential instrumental magnitude (star 5 - star 3) (filled triangles) with different arbitrary offsets are displayed in different panels in the right column of the Fig. 1. Date of observations are marked in the panels. We performed the IDV detection test described above by equation (1), and got the value of C for April 2, 3, 4, 6, 7, 8 and 9, 2007 are 7.00, 0.54, 0.63, 1.35, 0.78, 1.20 and 1.37, respectively (Table 1), which confirms that the source has not shown genuine IDV on April 3, 4, 6, 7, 8 and 9, 2007 in Ks passband. The value of C on April 2, 2007 show the source has shown IDV but data points are only 2, so, its reliability is doubtful. Photometric data of the observing campaign in Ks passband is reported in Table 4.
3.3 Short Term Variability
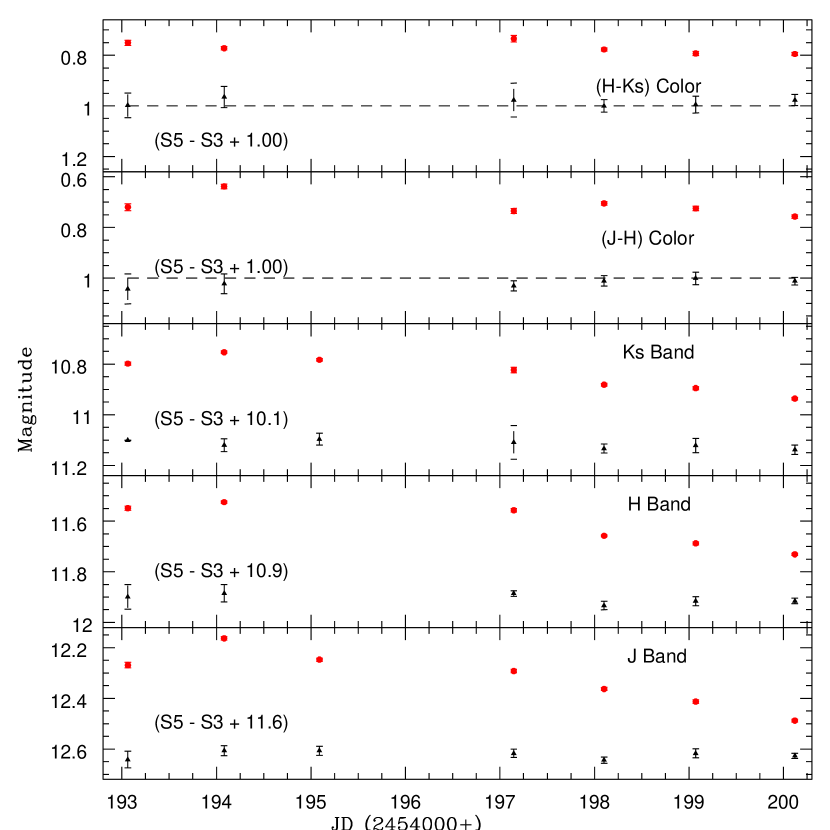
In Fig. 2, nightly averaged light curves of S5 0716714 (standard mag.) and comparison stars (differential instrumental mag. of Stars 3 and 5) in J, H, Ks, JH and HKs are plotted in the different panels from bottom to top, respectively. Here we estimate the 99% confidence detection level of short term variability using the variability detection test described in section 3.1. For a specific date of observations, we have taken mean time of all the image frames in J , H and Ks bands and then converted the mean time in Julian date (JD).
Short term variability amplitude is calculated by using the following relation (Heidt & Wagner 1996)
| (2) |
where Amax and Amin are the maximum and minimum magnitude in the calibrated light curve of the blazar in complete observing run. is the averaged measurement error of the blazar light curve. Errors in our determination of A are less than 1%.
J Passband
The short term light curve of S5 0716714 in J passband is displayed in the bottom panel of Fig. 2. The maximum variation noticed in the source is 0.325 mag (between its faintest level at 12.488 mag on JD 2454200.11894 and the brightest level at 12.163 mag on JD 2454194.08202). The value of C is calculated to be 7.05, which supports the existence of short term variation in the source in J band observations. We calculated short term variability amplitude using equation (2) and found that the source has varied 32.6%.
H Passband
The short term light curve of S5 0716714 in H passband is displayed in the second panel from bottom in Fig. 2. The maximum variation noticed in the source is 0.206 mag (between its faintest level at 11.731 mag on JD 2454200.11894 and the brightest level at 11.525 mag on JD 2454194.08202). The parameter C is 4.14, which supports the existence of short term variation in the source in H band observations. We calculated short term variability amplitude using equation (2) and found that source has varied 20.5%.
Ks Passband
The short term light curve of S5 0716714 in Ks passband is displayed in the third panel from bottom in Fig. 2. The maximum variation noticed in the source is 0.183 mag (between its faintest level at 10.936 mag on JD 2454200.11894 and the brightest level at 10.753 mag on JD 2454194.08202). The parameter C is 3.93, which supports the existence of short term variation in the source in Ks band observations. We calculated short term variability amplitude using equation (2) and found that source has varied 18.2%.
JH Color
The short term light curve of S5 0716714 in JH color is displayed in the second panel from top in Fig. 2. The maximum variation noticed in the source is 0.119 mag (between level at 0.757 mag on JD 2454200.11894 and at the level at 0.638 mag on JD 2454194.08202). The parameter C is 2.86, which supports the existence of short term variation in JH color. We calculated short term variability amplitude using equation (2) and found that source has varied 11.9%.
HKs Color
The short term light curve of S5 0716714 in HKs color is displayed in the top panel in Fig. 2. The maximum variation noticed in the source is 0.061 mag (between level at 0.795 mag on JD 2454200.11894 and at the level at 0.734 mag on JD 2454197.14597). The parameter C is 1.78. Therefore, no HKs color variation in the source is detected in our observations.
3.4 Spectral Energy Distribution
Spectral behavior of the blazar S5 0716714 in different nights of our observations are displayed by different symbols in Fig. 3. S5 0716714 is a LBL in which synchrotron component peaks in NIR/optical bands. The spectral behavior of the source in our 7 nights observations indicates that the synchrotron component would peak at wavelengths shorter than our J band. Since there is no simultaneous data in radio and optical bands, we cannot determine the peak position.
The source was brighter on April 3 compared to April 2, then it became fainter day after day until our last observation on April 9. The SED data of each day is fitted by a power-law function and we got the spectral index of , , , , , and for April 2, 3, 6, 7, 8 and 9, respectively. The spectral index increases before the maximum brightness on April 3 and decreases after it down to . The changes in spectral index between the maximum () and the minimum () is 0.24. This SED variation is owing to the larger flux variation at shorter wavelengths and is consistent with the short-term variability amplitudes reported in section 3.3.
4 Discussions and Conclusions
From our multi-band NIR observations of the blazar S5 0716714 in 7 observing nights in April 2007, genuine IDV in any of J, H and Ks is not detected. We noticed the existence of significant short term flux variability in the blazar from our observations. The total short term variation detected in our observations in J, H, Ks passbands are 32.6%, 20.5% and 18.2%, respectively. Our data show significant variation in JH color ( 11.9%) but HKs color variation was not detected. The difference in short term variations in H and Ks passbands is only 2.3% which caused no genuine HKs color variation. We have noticed variable spectral index (ranging from to ) with a mean value of in our observations. The variable spectral index is mainly due to variation in J band flux. We also found correlated flux and spectral index (higher the flux, higher the spectral index). We observed the source in the post outburst state. Outburst of the source was reported by Gupta et al. (2008a) in their January February 2007 observations and they also noticed in their March 2007 observations, the source was becoming fainter than January February 2007.
S5 0716714 was the target of three simultaneous multi-wavelength campaigns (Tagliaferri et al. 2003; Ostorero et al. 2006; Villata et al. 2008) and also several monitoring campaigns in single or two EM bands (e.g. radio-optical, optical and optical-X-ray) (Wagner et al. 1990; Quirrenbach et al. 1991; Sagar et al. 1999; Villata et al. 2000; Foschini et al. 2006; and references therein). It has shown radio and optical IDVs during all radio to optical campaigns (Heeschen et al. 1987; Wagner et al. 1990, 1996; Ghisellini et al. 1997; Sagar et al. 1999; Quirrenbach et al. 2000; Raiteri et al. 2003; Agudo et al. 2006; Gupta et al. 2008a, and references therein). It is the first IDV source in which simultaneous variations in radio and optical bands were detected which indicated a possible intrinsic origin of the observed IDV (Wagner et al. 1990; Quirrenbach et al. 1991). VLBI observations of the source over more than 20 years, show a very compact source at centimeter wavelengths with an evidence of a core-dominated jet extending several tens of milliarcseconds to the North (Eckart et al. 1986, 1987; Witzel et al. 1988; Polatidis et al. 1995; Jorstad et al. 2001). The X-ray observations have shown strong variations with short flares ( 1000s) detected with the ROentgen SATellite (ROSAT) (Cappi et al. 1994). The source was also detected in hard X-rays up to 60 keV when observed after the outburst state of 2000 (Tagliaferri et al. 2003). It has been detected by Energetic Gamma-Ray Experiment Telescope (EGRET) onboard the Compton Gamma-Ray Observatory CGRO at GeV energies with steep ray spectrum (Hartman et al. 1999). But the soft ray part of its SED is poorly known and upper limit of the source detection in 310 MeV energy from the imaging COMPton TELescope (COMPTEL) was reported by Collmar (2006). An exceptional energy sampling data of the blazar was obtained in the simultaneous multi-wavelength observing campaign in November 2003 (Ostorero et al. 2006). The source was very bright at radio frequencies and in a rather low optical state (R = 14.17 - 13.64). Significant short term variability and IDV were detected in the radio bands. The source was not detected by INTEGRAL in the observing campaign but the upper limit of the source emission in 3200 keV was estimated. On September 2007, the source was detected in rays by the recently launched satellite Astro-rivelatore Gamma a Immagini LEggero (AGILE) (Villata et al. 2008).
Several models have been developed to explain the IDV and short term variability in radio-loud AGNs viz. the shock-in-jet models, accretion disk based models (e.g. Wagner & Witzel 1995; Urry & Padovani 1995; Ulrich et al. 1997; and references therein). For blazars in the outburst state, IDV and short term variability are strongly supported by the jet based models of radio-loud AGNs. In general, blazars emission in the outburst state is nonthermal Doppler boosted emission from jets (Blandford & Rees 1978; Marscher & Gear 1985; Marscher et al. 1992; Hughes et al. 1992). On the other hand, IDV and short term variability of blazars in the low-state can be explained by the models based on some kind of instability in the accretion disk (e.g. Mangalam & Wiita 1993; Chakrabarti & Wiita 1993).
Here we rule out the possibility of emission from the accretion disk because it is expected to be relevant only in the source low-state (the source was in the post outburst period). The source was in the outburst state 2 months before the present observations (Gupta et al. 2008a). In the low-state, jet emission is less dominant over the thermal emission from the accretion disk. According to the unified scheme of radio-loud AGNs, blazars are seen nearly face on, so, any fluctuations on the accretion disk should produce a detectable change in the emission characteristics.
The observed short term variability in the blazar S5 0716714 is possibly explained by the jet based model known as turbulent jet model. According to this model, Marscher et al. (1992) suggested that the Reynolds number in the relativistic jet should be very high which will cause turbulent jet plasma. The shock will impinge upon regions of slightly different magnetic field strengths, densities and velocities, so the observed flux is expected to vary. The timescales of this proposed type of variations are shorter and their amplitudes larger at higher frequencies. In the observations reported here, we got variability amplitudes of 32.6%, 20.5% and 18.2% in J, H, Ks bands, respectively, implying larger variations at higher frequencies. The relation between flux variation amplitude and frequency is confirmed from the SED and color variation.
Since the duty cycle of the source is 1, we may expect to detect IDV. However, we have not detected any genuine IDV in our observations. It might be due to less numbers of data points and short durations of the observing runs during each night, hence in the future we plan to observe the source for a longer time each night. This will allow us to collect more data points and possibly to have a higher signal-to-noise in order to have higher sensitivity to possible genuine IDVs.
References
- (1) Agudo, I., et al. 2006, A&A, 456, 117
- (2) Bai, J. M., Xie, G. Z., Li, K. H., Zhang, X., & Liu, W. W. 1998, A&AS, 132, 83
- (3) Bai, J. M., Xie, G. Z., Li, K. H., Zhang, X., & Liu, W. W. 1999, A&AS, 136, 455
- (4) Blandford, R. D., & Rees, M. 1978, Phys. Scr., 17, 265
- (5) Cappi, M.; Comastri, A., Molendi, S., Palumbo, G. G. C., Della Ceca, R., & Maccacaro, T. 1994, MNRAS, 271, 438
- (6) Carini, M. T. 1990, Ph.D. dissertation, Georgia State University, USA
- (7) Chakrabarti, S. K., & Wiita, P. J. 1993, ApJ, 411, 602
- (8) Ciprini, S., et al. 2007, A&A, 467, 465
- (9) Ciprini, S., Tosti, G., Raiteri, C. M., Villata, M., Ibrahimov, M. A., Nucciarelli, G., & Lanteri, L. 2003, A&A, 400, 487
- (10) Collmar, W. 2006, in Proc. Blazar Variability Workshop II: Entering the GLAST era, ed. H. R. Miller, ASP Conf. Series, Vol. 350, p.120
- (11) Coppi, P. S. 1999, in workshop summary for the Cracow Workshop on Relativistic Jets in AGNs, ed. M. Ostrowski, M. Sikora, G. Madejski & M. Begelman, Jagellonian University Press, p. 333
- (12) Eckart, A., Witzel, A., Biermann, P., Johnston, K. J., Simon, R., Schalinski, C., & Kuhr, H. 1986, A&A, 168, 17
- (13) Eckart, A., Witzel, A., Biermann, P., Johnston, K. J., Simon, R., Schalinski, C., & Kuhr, H. 1987, A&AS, 67, 121
- (14) Fan, J. H., Cheng, K. S., Zhang, L., & Liu, C. H. 1997, A&A, 327, 947
- (15) Fan, J. H., Xie, G. Z., Pecontal, E., Pecontal, A., & Copin, Y. 1998, ApJ, 507, 173
- (16) Fan, J. H., Lin, R. G., Xie, G. Z., Zhang, L., Mei, D. C., Su, C. Y., & Peng, Z. M. 2002, A&A, 381, 1
- (17) Fan, J. H., et al. 2007, A&A, 462, 547
- (18) Foschini, L., et al. 2006, A&A, 455, 871
- (19) Fossati, G., Maraschi, L., Celotti, A., Comastri, A., & Ghisellini, G. 1998, MNRAS, 299, 433
- (20) Ghisellini, G., Celotti, A., Fossati, G., Maraschi, L., & Comastri, A. 1998, MNRAS, 301, 451
- (21) Ghisellini, G., et al. 1997, A&A, 327, 61
- (22) Gupta, A. C., Banerjee, D. P. K., Ashok, N. M., & Joshi, U. C. 2004, A&A, 422, 505
- (23) Gupta, A. C., & Joshi, U. C. 2005, A&A, 440, 855
- (24) Gupta, A. C., Fan, J. H., Bai, J. M., & Wagner, S. J. 2008a, AJ, 135, 1384
- (25) Gupta, A. C., Deng, W. G., Joshi, U. C., Bai, J. M., & Lee, M. G. 2008b, New Astronomy, 13, 375
- (26) Hagen-Thorn, V. A., et al. 2006, Astronomy Reports, 50, 458
- (27) Hartman, R. C., et al. 1999, ApJS, 123, 79
- (28) Heeschen, D. S., Krichbaum, T. P., Schalinski, C. J., & Witzel, A. 1987, AJ, 94, 1493
- (29) Heidt, J., & Wagner, S. J. 1996, A&A, 305, 42
- (30) Hughes, P. A., Aller, H. D., & Aller, M. F. 1992, ApJ, 396, 469
- (31) Impey, C. D., Bychkov, V., Tapia, S., Gnedin, Y., & Pustilnik, S. 2000, AJ, 119, 1542
- (32) Jorstad, S. G., Marscher, A. P., Mattox, J. R., Wehrle, A. E., Bloom, S. D., & Yurchenko, A. V. 2001, ApJS, 134, 181
- (33) Krawczynski, H. 2004, New Astronomy Rev., 48, 376
- (34) Mangalam, A. V., & Wiita, P. J. 1993, ApJ, 406, 420
- (35) Marscher, A. P., & Gear, W. K. 1985, ApJ, 298, 114
- (36) Marscher, A. P., Gear, W. K. & Travis, J. P., 1992, in Variability of Blazars, ed. E. Valtaoja, M. Valtonen, Cambridge University Press, p. 85
- (37) Mead, A. R. G., Ballard, K. R., Brand, P. W. J. L., Hough, J. H., Brindle, C., & Bailey, J. A. 1990, A&AS, 83, 183
- (38) Miller, H. R., Carini, M. T., & Goodrich, B. D. 1989, Nature, 337, 627
- (39) Moon, B., et al. 2008, PASJ, in press
- (40) Nilsson, K., Pursimo, T., Sillanpää, A., Takalo, L. O., & Lindfors, E. 2008, arXiv:0807.0203
- (41) Ostorero, L., et al. 2006, A&A, 451, 797
- (42) Polatidis, A. G., Wilkinson, P. N., Xu, W., Readhead, A. C. S., Pearson, T. J., Taylor, G. B., & Vermeulen, R. C. 1995, ApJS, 98, 1
- (43) Quirrenbach, A., et al. 1991, ApJ, 372, L71
- (44) Quirrenbach, A., et al. 2000, A&AS, 141, 221
- (45) Raiteri, C. M., et al. 2003, A&A, 402, 151
- (46) Romero, G. E., Cellone, S. A., & Combi, J. A. 1999, A&AS, 135, 477
- (47) Sagar, R., Gopal-Krishna, Mohan, V., Pandey, A. K., Bhatt, B. C., & Wagner, S. J. 1999, A&AS, 134, 453
- (48) Sbarufatti, B., Treves, A., & Falomo, R., 2005, ApJ, 635, 173
- (49) Sikora, M., & Madejski, G., 2001, in AIP Conf. Proc. 558, High Energy Gamma-Ray Astronomy, ed. F. A. Aharonian & H. J. Völk (new York: AIP), p. 463
- (50) Sillanpää, A., et al. 1996a, A&A, 305, 17L
- (51) Sillanpää, A., et al. 1996b, A&A, 315, 13L
- (52) Skrutskie, M. F., et al. 2006, AJ, 131, 1163
- (53) Stalin, C. S., Gupta, A. C., Gopal-Krishna, Wiita, P. J., & Sagar, R. 2005, MNRAS, 356, 607
- (54) Stetson, P. B. 1987, PASP, 99, 191
- (55) Tagliaferri, G., et al. 2003, A&A, 400, 477
- (56) Takalo, L. O., Sillanpää, A., Nilsson, K., Kidger, M., de Diego, J. A., & Piirola, V. 1992, A&AS, 94, 37
- (57) Takalo, L. O., Sillanpää, A., & Nilsson, K. 1994, A&AS, 107, 497
- (58) Takalo, L. O., et al. 1996, A&AS, 120, 313
- (59) Ulrich, M.-H., Maraschi, L., & Urry, C. M. 1997, ARA&A, 35, 445
- (60) Urry, C. M., & Padovani, P. 1995, PASP, 107, 803
- (61) Villata, M., Raiteri, C. M., Lanteri, L., Sobrito, G., & Cavallone, M., 1998, A&AS, 130, 305
- (62) Villata, M., et al. 2000, A&A, 363, 108
- (63) Villata, M., et al. 2008, A&A, 481, L79
- (64) Wagner, S. J., & Witzel, A. 1995, ARA&A, 33, 163
- (65) Wagner, S. J., Sanchez-Pons, F., Quirrenbach, A., & Witzel, A. 1990, A&A, 235, L1
- (66) Wagner, S. J., et al. 1996, AJ, 111, 2187
- (67) Witzel, A., Schalinski, C. J., Johnston, K. J., Biermann, P. L., Krichbaum, T. P., Hummel, C. A., & Eckart, A. 1988, A&A, 206, 245
- (68) Xie, G. Z.; Zhou, S. B., Dai, B. Z., Liang, E. W., Li, K. H., Bai, J. M., Xing, S. Y., & Liu, W. W. 2002, MNRAS, 329, 689
| Date | Band | N | Diff. mag | Diff. mag | Diff. mag | Variable | C |
|---|---|---|---|---|---|---|---|
| dd.mm.yyyy | BL - SA | BL - SB | SA - SB | ||||
| 02.04.2007 | J | 2 | 0.9500.028 | 0.0920.005 | 1.0420.033 | NV | 0.50 |
| H | 2 | 0.4860.023 | 0.5130.025 | 0.9990.049 | NV | 0.49 | |
| Ks | 2 | 0.1810.006 | 1.1820.008 | 1.0010.001 | PV | 7.00 | |
| JH | 2 | 0.4640.036 | 0.4210.025 | 0.0430.059 | NV | 0.52 | |
| HKs | 2 | 0.6670.024 | 0.6690.026 | 0.0020.049 | NV | 0.51 | |
| 03.04.2007 | J | 13 | 0.8420.014 | 0.1640.016 | 1.0070.020 | NV | 0.75 |
| H | 13 | 0.4620.028 | 0.5240.026 | 0.9850.034 | NV | 0.79 | |
| Ks | 13 | 0.2250.006 | 1.2450.021 | 1.0200.025 | NV | 0.54 | |
| JH | 13 | 0.3800.031 | 0.3600.031 | 0.0220.039 | NV | 0.79 | |
| HKs | 13 | 0.6870.029 | 0.7210.033 | 0.0350.042 | NV | 0.74 | |
| 04.04.2007 | J | 16 | 0.9280.008 | 0.0790.015 | 1.0070.018 | NV | 0.64 |
| Ks | 16 | 0.1950.009 | 1.1910.020 | 0.9960.023 | NV | 0.63 | |
| 06.04.2007 | J | 2 | 0.9730.013 | 0.0450.004 | 1.0170.017 | NV | 0.50 |
| H | 2 | 0.4940.028 | 0.4920.017 | 0.9860.011 | NV | 2.05 | |
| Ks | 2 | 0.1560.056 | 1.1650.122 | 1.0090.066 | NV | 1.35 | |
| JH | 2 | 0.4790.031 | 0.4470.017 | 0.0310.020 | NV | 1.20 | |
| HKs | 2 | 0.6500.063 | 0.6730.123 | 0.0230.067 | NV | 1.39 | |
| 07.04.2007 | J | 9 | 1.0440.014 | 0.0010.011 | 1.0440.012 | NV | 1.04 |
| H | 9 | 0.5950.012 | 0.4380.009 | 1.0330.017 | NV | 0.62 | |
| Ks | 9 | 0.0970.008 | 1.1300.020 | 1.0330.018 | NV | 0.78 | |
| JH | 9 | 0.4490.018 | 0.4370.014 | 0.0110.021 | NV | 0.76 | |
| HKs | 9 | 0.6920.014 | 0.6920.022 | 0.0000.025 | NV | 0.72 | |
| 08.04.2007 | J | 14 | 1.0940.025 | 0.0770.041 | 1.0170.018 | NV | 1.83 |
| H | 14 | 0.6250.021 | 0.3910.023 | 1.0160.018 | NV | 1.22 | |
| Ks | 14 | 0.0830.021 | 1.1040.046 | 1.0210.028 | NV | 1.20 | |
| JH | 14 | 0.4690.033 | 0.4680.047 | 0.0010.025 | NV | 1.60 | |
| HKs | 14 | 0.7080.030 | 0.7130.051 | 0.0050.033 | NV | 1.23 | |
| 09.04.2007 | J | 9 | 1.1690.024 | 0.1420.022 | 1.0270.010 | NV | 2.30 |
| H | 9 | 0.6680.018 | 0.3470.011 | 1.0150.011 | NV | 1.32 | |
| Ks | 9 | 0.0420.016 | 1.0800.010 | 1.0380.019 | NV | 1.37 | |
| JH | 9 | 0.5010.030 | 0.4890.025 | 0.0120.015 | NV | 1.83 | |
| HKs | 9 | 0.7100.024 | 0.7330.015 | 0.0230.022 | NV | 0.89 |
| Date | UT | Magnitude | Error |
|---|---|---|---|
| yyyy.mm.dd | hour | ||
| 2007.04.02 | 13.0767 | 12.249 | 0.0103 |
| 2007.04.02 | 13.6577 | 12.289 | 0.0108 |
| 2007.04.03 | 11.3628 | 12.165 | 0.0067 |
| 2007.04.03 | 11.6856 | 12.168 | 0.0058 |
| 2007.04.03 | 12.1344 | 12.190 | 0.0058 |
| 2007.04.03 | 12.4653 | 12.172 | 0.0058 |
| 2007.04.03 | 13.1033 | 12.152 | 0.0067 |
| 2007.04.03 | 13.5543 | 12.160 | 0.0067 |
| 2007.04.03 | 14.0155 | 12.153 | 0.0067 |
| 2007.04.03 | 14.3276 | 12.164 | 0.0067 |
| 2007.04.03 | 14.7036 | 12.162 | 0.0072 |
| 2007.04.03 | 15.1420 | 12.172 | 0.0081 |
| 2007.04.03 | 15.5005 | 12.130 | 0.0081 |
| 2007.04.03 | 15.8084 | 12.163 | 0.0081 |
| 2007.04.03 | 16.1480 | 12.146 | 0.0081 |
| 2007.04.04 | 13.5451 | 12.232 | 0.0058 |
| 2007.04.04 | 13.6240 | 12.241 | 0.0058 |
| 2007.04.04 | 13.6928 | 12.239 | 0.0058 |
| 2007.04.04 | 13.7610 | 12.247 | 0.0058 |
| 2007.04.04 | 13.8381 | 12.240 | 0.0058 |
| 2007.04.04 | 13.9185 | 12.245 | 0.0058 |
| 2007.04.04 | 13.9874 | 12.240 | 0.0058 |
| 2007.04.04 | 14.0717 | 12.238 | 0.0067 |
| 2007.04.04 | 14.1499 | 12.255 | 0.0058 |
| 2007.04.04 | 14.2285 | 12.261 | 0.0058 |
| 2007.04.04 | 14.3353 | 12.255 | 0.0067 |
| 2007.04.04 | 14.4575 | 12.248 | 0.0081 |
| 2007.04.04 | 14.5378 | 12.252 | 0.0067 |
| 2007.04.04 | 14.6199 | 12.258 | 0.0067 |
| 2007.04.04 | 14.6928 | 12.254 | 0.0072 |
| 2007.04.04 | 14.7733 | 12.245 | 0.0067 |
| 2007.04.06 | 15.1859 | 12.301 | 0.0058 |
| 2007.04.06 | 15.5757 | 12.282 | 0.0081 |
| 2007.04.07 | 13.2219 | 12.337 | 0.0058 |
| 2007.04.07 | 13.4691 | 12.355 | 0.0058 |
| 2007.04.07 | 13.7392 | 12.370 | 0.0058 |
| 2007.04.07 | 14.0084 | 12.384 | 0.0067 |
| 2007.04.07 | 14.2890 | 12.373 | 0.0058 |
| 2007.04.07 | 14.5922 | 12.364 | 0.0067 |
| 2007.04.07 | 14.9806 | 12.347 | 0.0058 |
| 2007.04.07 | 15.2281 | 12.370 | 0.0067 |
| 2007.04.07 | 15.4945 | 12.367 | 0.0067 |
| 2007.04.08 | 11.1906 | 12.455 | 0.0076 |
| 2007.04.08 | 11.4216 | 12.455 | 0.0076 |
| 2007.04.08 | 11.6621 | 12.452 | 0.0076 |
| 2007.04.08 | 11.9226 | 12.423 | 0.0067 |
| 2007.04.08 | 12.1747 | 12.417 | 0.0067 |
| 2007.04.08 | 13.4435 | 12.392 | 0.0067 |
| 2007.04.08 | 13.6623 | 12.403 | 0.0076 |
| 2007.04.08 | 13.9838 | 12.413 | 0.0067 |
| 2007.04.08 | 14.2744 | 12.388 | 0.0076 |
| 2007.04.08 | 14.5426 | 12.416 | 0.0076 |
| 2007.04.08 | 15.0147 | 12.397 | 0.0058 |
| 2007.04.08 | 15.3563 | 12.401 | 0.0058 |
| 2007.04.08 | 15.6473 | 12.379 | 0.0058 |
| 2007.04.08 | 15.9339 | 12.392 | 0.0067 |
| 2007.04.09 | 13.5311 | 12.440 | 0.0076 |
| 2007.04.09 | 13.9564 | 12.483 | 0.0076 |
| 2007.04.09 | 14.2050 | 12.473 | 0.0058 |
| 2007.04.09 | 14.4568 | 12.490 | 0.0058 |
| 2007.04.09 | 14.7123 | 12.503 | 0.0058 |
| 2007.04.09 | 14.9869 | 12.507 | 0.0058 |
| 2007.04.09 | 15.3351 | 12.498 | 0.0058 |
| 2007.04.09 | 15.6168 | 12.524 | 0.0067 |
| 2007.04.09 | 15.9539 | 12.478 | 0.0058 |
| Date | UT | Magnitude | Error |
|---|---|---|---|
| yyyy.mm.dd | hour | ||
| 2007.04.02 | 13.1916 | 11.532 | 0.0072 |
| 2007.04.02 | 13.7532 | 11.565 | 0.0081 |
| 2007.04.03 | 11.4691 | 11.537 | 0.0050 |
| 2007.04.03 | 11.8890 | 11.528 | 0.0042 |
| 2007.04.03 | 12.2291 | 11.528 | 0.0050 |
| 2007.04.03 | 12.6306 | 11.554 | 0.0042 |
| 2007.04.03 | 13.3047 | 11.478 | 0.0050 |
| 2007.04.03 | 13.6283 | 11.483 | 0.0050 |
| 2007.04.03 | 14.1066 | 11.521 | 0.0050 |
| 2007.04.03 | 14.4783 | 11.530 | 0.0050 |
| 2007.04.03 | 14.8032 | 11.533 | 0.0057 |
| 2007.04.03 | 15.2618 | 11.516 | 0.0064 |
| 2007.04.03 | 15.6085 | 11.510 | 0.0072 |
| 2007.04.03 | 15.9071 | 11.589 | 0.0071 |
| 2007.04.03 | 16.2718 | 11.514 | 0.0058 |
| 2007.04.06 | 15.3187 | 11.577 | 0.0057 |
| 2007.04.06 | 15.7229 | 11.537 | 0.0092 |
| 2007.04.07 | 13.3143 | 11.642 | 0.0050 |
| 2007.04.07 | 13.5536 | 11.638 | 0.0042 |
| 2007.04.07 | 13.8537 | 11.669 | 0.0050 |
| 2007.04.07 | 14.1191 | 11.651 | 0.0036 |
| 2007.04.07 | 14.3754 | 11.663 | 0.0050 |
| 2007.04.07 | 14.7183 | 11.671 | 0.0050 |
| 2007.04.07 | 15.0560 | 11.661 | 0.0036 |
| 2007.04.07 | 15.3214 | 11.663 | 0.0036 |
| 2007.04.07 | 15.5968 | 11.664 | 0.0050 |
| 2007.04.08 | 11.2673 | 11.714 | 0.0050 |
| 2007.04.08 | 11.4962 | 11.728 | 0.0050 |
| 2007.04.08 | 11.7304 | 11.715 | 0.0050 |
| 2007.04.08 | 12.0194 | 11.706 | 0.0050 |
| 2007.04.08 | 13.2942 | 11.687 | 0.0050 |
| 2007.04.08 | 13.5133 | 11.683 | 0.0050 |
| 2007.04.08 | 13.7582 | 11.677 | 0.0050 |
| 2007.04.08 | 14.0690 | 11.671 | 0.0050 |
| 2007.04.08 | 14.3667 | 11.652 | 0.0050 |
| 2007.04.08 | 14.6240 | 11.685 | 0.0180 |
| 2007.04.08 | 15.1095 | 11.664 | 0.0036 |
| 2007.04.08 | 15.4417 | 11.681 | 0.0042 |
| 2007.04.08 | 15.7355 | 11.674 | 0.0036 |
| 2007.04.08 | 16.0395 | 11.688 | 0.0050 |
| 2007.04.09 | 13.7980 | 11.718 | 0.0036 |
| 2007.04.09 | 14.0295 | 11.717 | 0.0050 |
| 2007.04.09 | 14.2900 | 11.723 | 0.0050 |
| 2007.04.09 | 14.5404 | 11.735 | 0.0050 |
| 2007.04.09 | 14.7849 | 11.711 | 0.0045 |
| 2007.04.09 | 15.0437 | 11.737 | 0.0050 |
| 2007.04.09 | 15.4440 | 11.723 | 0.0045 |
| 2007.04.09 | 15.7708 | 11.757 | 0.0036 |
| 2007.04.09 | 16.0364 | 11.761 | 0.0042 |
| Date | UT | Magnitude | Error |
|---|---|---|---|
| yyyy.mm.dd | hour | ||
| 2007.04.02 | 13.5410 | 10.793 | 0.0064 |
| 2007.04.02 | 13.8485 | 10.802 | 0.0064 |
| 2007.04.03 | 11.5766 | 10.755 | 0.0042 |
| 2007.04.03 | 12.0182 | 10.774 | 0.0042 |
| 2007.04.03 | 12.3193 | 10.766 | 0.0042 |
| 2007.04.03 | 12.9633 | 10.765 | 0.0042 |
| 2007.04.03 | 13.4103 | 10.768 | 0.0042 |
| 2007.04.03 | 13.7719 | 10.729 | 0.0050 |
| 2007.04.03 | 14.1940 | 10.742 | 0.0050 |
| 2007.04.03 | 14.5875 | 10.743 | 0.0050 |
| 2007.04.03 | 14.9135 | 10.754 | 0.0050 |
| 2007.04.03 | 15.3751 | 10.764 | 0.0057 |
| 2007.04.03 | 15.7039 | 10.773 | 0.0057 |
| 2007.04.03 | 16.0015 | 10.740 | 0.0064 |
| 2007.04.03 | 16.3985 | 10.716 | 0.0064 |
| 2007.04.04 | 13.5776 | 10.786 | 0.0050 |
| 2007.04.04 | 13.6598 | 10.785 | 0.0050 |
| 2007.04.04 | 13.7267 | 10.783 | 0.0050 |
| 2007.04.04 | 13.7985 | 10.787 | 0.0050 |
| 2007.04.04 | 13.8766 | 10.793 | 0.0050 |
| 2007.04.04 | 13.9520 | 10.785 | 0.0050 |
| 2007.04.04 | 14.0338 | 10.776 | 0.0050 |
| 2007.04.04 | 14.1124 | 10.793 | 0.0057 |
| 2007.04.04 | 14.1902 | 10.774 | 0.0050 |
| 2007.04.04 | 14.2609 | 10.777 | 0.0050 |
| 2007.04.04 | 14.4067 | 10.777 | 0.0064 |
| 2007.04.04 | 14.5010 | 10.767 | 0.0057 |
| 2007.04.04 | 14.5757 | 10.780 | 0.0057 |
| 2007.04.04 | 14.6575 | 10.791 | 0.0057 |
| 2007.04.04 | 14.7303 | 10.802 | 0.0057 |
| 2007.04.04 | 14.8092 | 10.776 | 0.0057 |
| 2007.04.06 | 15.4085 | 10.783 | 0.0050 |
| 2007.04.06 | 15.8120 | 10.862 | 0.0170 |
| 2007.04.07 | 13.3938 | 10.897 | 0.0050 |
| 2007.04.07 | 13.6301 | 10.877 | 0.0050 |
| 2007.04.07 | 13.9250 | 10.872 | 0.0064 |
| 2007.04.07 | 14.1989 | 10.885 | 0.0057 |
| 2007.04.07 | 14.4659 | 10.878 | 0.0057 |
| 2007.04.07 | 14.9096 | 10.873 | 0.0050 |
| 2007.04.07 | 15.1434 | 10.882 | 0.0050 |
| 2007.04.07 | 15.4132 | 10.884 | 0.0057 |
| 2007.04.07 | 15.6956 | 10.884 | 0.0057 |
| 2007.04.08 | 11.3472 | 10.943 | 0.0057 |
| 2007.04.08 | 11.5714 | 10.901 | 0.0057 |
| 2007.04.08 | 11.8080 | 10.907 | 0.0057 |
| 2007.04.08 | 12.0997 | 10.909 | 0.0057 |
| 2007.04.08 | 13.3733 | 10.902 | 0.0057 |
| 2007.04.08 | 13.5831 | 10.902 | 0.0057 |
| 2007.04.08 | 13.8364 | 10.902 | 0.0057 |
| 2007.04.08 | 14.1698 | 10.896 | 0.0057 |
| 2007.04.08 | 14.4618 | 10.874 | 0.0057 |
| 2007.04.08 | 13.9064 | 10.908 | 0.0057 |
| 2007.04.08 | 15.2049 | 10.872 | 0.0050 |
| 2007.04.08 | 15.5335 | 10.862 | 0.0050 |
| 2007.04.08 | 15.8278 | 10.881 | 0.0050 |
| 2007.04.08 | 16.1308 | 10.870 | 0.0050 |
| 2007.04.09 | 13.8834 | 10.917 | 0.0057 |
| 2007.04.09 | 14.1093 | 10.917 | 0.0057 |
| 2007.04.09 | 14.3602 | 10.922 | 0.0050 |
| 2007.04.09 | 14.6315 | 10.933 | 0.0050 |
| 2007.04.09 | 14.8720 | 10.932 | 0.0042 |
| 2007.04.09 | 15.2103 | 10.960 | 0.0057 |
| 2007.04.09 | 15.5332 | 10.955 | 0.0057 |
| 2007.04.09 | 15.8579 | 10.951 | 0.0042 |
| 2007.04.09 | 16.1326 | 10.939 | 0.0042 |