A SURVEY FOR A COEVAL, COMOVING GROUP ASSOCIATED WITH HD 141569
Abstract
We present results of a search for a young stellar moving group associated with the star HD 141569, a nearby, isolated Herbig AeBe primary member of a 53 Myr-old triple star system on the outskirts of the Sco-Cen complex. Our spectroscopic survey identified a population of 21 Li-rich, 30 Myr-old stars within 30° of HD 141569 which possess similar proper motions with the star. The spatial distribution of these Li-rich stars, however, is not suggestive of a moving group associated with the HD 141569 triplet, but rather this sample appears cospatial with Upper Scorpius and Upper Centaurus Lupus. We apply a modified moving cluster parallax method to compare the kinematics of these youthful stars with Upper Scorpius and Upper Centaurus Lupus. Eight new potential members of Upper Scorpius and five new potential members of Upper Centaurus Lupus are identified. A substantial moving group with an identifiable nucleus within 15°(30 pc) of HD 141569 is not found in this sample. Evidently, the HD 141569 system formed 5 Myr ago in relative isolation, tens of parsecs away from the recent sites of star formation in the Ophiucus-Scorpius-Centaurus region.
1 INTRODUCTION
The HD 141569 stellar system initially garnered the interest of Rossiter (1943) as a potential triple star system. The existence of this group was confirmed over half a century later when Weinberger et al. (2000) showed that the stars’ position angles relative to one another had not changed since Rossiter’s 1938 observations, thus confirming common proper motions. They also noted that all three stars are consistent with being the same age, indicating a comoving and coeval system. This triumvirate is particularly interesting because all components are quite young; the system was found to be 53 Myr (Weinberger et al., 2000), and recently the A star’s age was constrained using surface gravities and effective temperatures to be 4.7 Myr (Merín et al., 2004). HD 141569 itself is near enough to resolve its large, dusty disk, and near-infrared signatures indicate perturbations to the disk’s structure which could be explained by planet formation (Weinberger et al., 1999). Were a coherent group present, it would therefore be distinctly possible to similarly observe additional young, disk-bearing stars. Furthermore, surveying a coeval sample at this distance would be useful for determining disk frequency and mechanisms by which they arise and evolve.
In some cases, seemingly isolated young stars have later been found to have an entourage of other low-mass young stars which constitute a stellar association (e.g. HD 104237, HR 4796, Pictoris; cf. Mamajek et al., 2002; Li, 2005). The lower mass members of these associations have been useful, indeed critical, for estimating the age of the massive star in question, as often the massive star is on the main sequence and uncertainty in its HR diagram position is substantial enough to impede an isochronal age estimate. Any additional association members should be identifiable by their similar space motions. The youth of these objects makes them useful for studies of circumstellar disks and stellar evolution. In this region of sky rich with already identified associations such as Ophiucus, Upper Scorpius (US) and Upper Centaurus Lupus (UCL), placing an “HD 141569 Association” into context with surrounding moving groups could aid in the understanding of star formation histories in giant molecular clouds.
So motivated, in this paper we seek to identify a sample of stars associated with HD 141569. Previous studies (e.g. Mamajek et al., 2002; Li, 2005) have shown that catalog searches based on X-ray activity, proper motions, and distance criteria can yield new members of associations. Here we also identify candidate members with a catalog search for X-ray active stars in the vicinity of HD 141569 possessing proper motions consistent with HD 141569 (§2.1). From new spectroscopic observations (§2.2), in §3 we identify a subset of 21 stars which we claim as youthful using Li I equivalent widths; furthermore, we also note the presence of H emission as an interesting quantity usually indicative of chromospheric activity. Lacking direct distance measurements for these stars, we derive distances using a modified version of the traditional moving cluster parallax method (de Bruijne, 1999; de Zeeuw et al., 1999; Mamajek, 2005), with which we further determine the probability that the sample stars are comoving with HD 141569 (§3.4).
Placing these stars on a Hertzsprung-Russell diagram (hereafter HRD or HR diagram, §4.3), we find that the stars’ distances—and hence ages—are most consistent with their strong lithium abundances when we derive their moving cluster parallaxes assuming comovement with Upper Scorpius or UCL associations of young stars. In §5 we summarize our study and present thirteen newly identified Sco-Cen members.
2 DATA
2.1 Target Selection
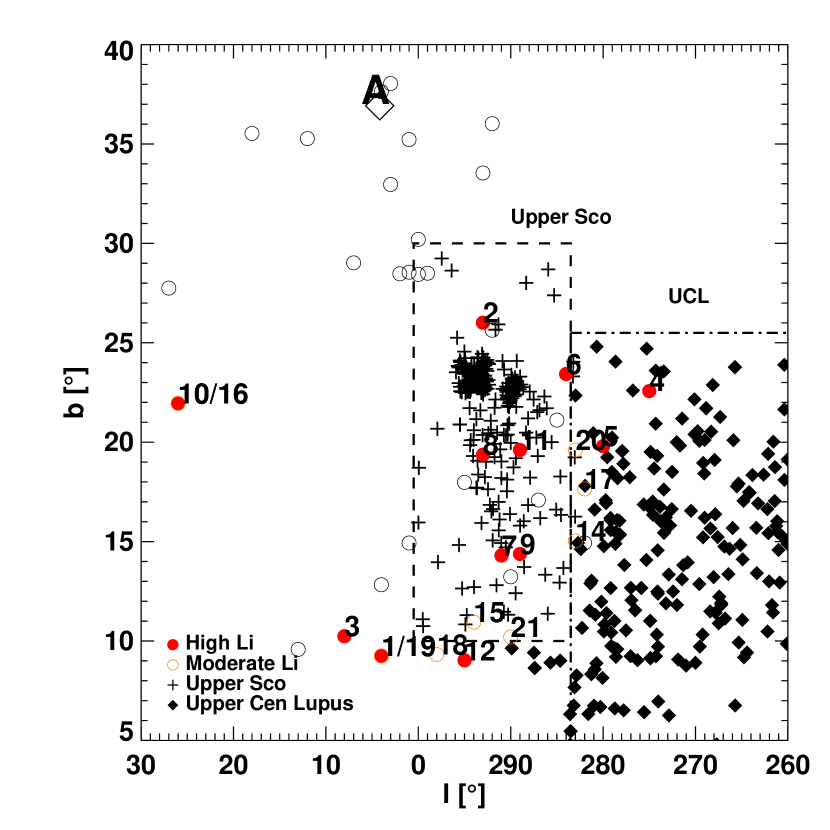
Potential targets for observation were found by two catalog queries for stellar properties indicative of youth and comovement with HD 141569. In the first search, 10 stars were found through a query of the Hipparcos catalog (Perryman & ESA, 1997) for objects within 10° of HD 141569 with similar distances (998pc, as reported in Perryman & ESA, 1997) and proper motions. Eight objects from the ROSAT Faint Source Catalog (Voges et al., 2000) supplemented this sample, as previous low-resolution observations (A. Weinberger, unpublished data) showed evidence for spectroscopic signatures indicative of youth. A second search was performed in which the ROSAT Bright Source Catalog (Voges et al., 1999) was probed for X-ray sources within a 30° radius of HD 141569. Of the 1,114 resulting targets, 400 sources had Tycho-2 (Høg et al., 2000) catalogued proper motions. We required proper motions to be within and mas yr-1 in RA and Dec of HD 141569’s proper motion, respectively, based on the range of proper motions observed in the widely dispersed and similarly aged TW Hydrae Association (Zuckerman et al., 2001; Webb et al., 1999). Finally, we required that the ROSAT sources not be extended and that they be cospatial with the Tycho coordinates. This procedure resulted in 70 objects desirable for further study to establish youth and space motions. A map of the observed sample is shown in Fig. 1; members of other nearby associations are also shown for added context and perspective.
2.2 Observations
Forty-nine (49) stars of our input catalog were observed spectroscopically over the course of three observing runs in order to measure spectral types, radial velocities, and Li I and H equivalent widths. Four targets were found to be close visual binaries so their companions were observed as well; of these four, two were determined to be background objects on the basis of apparent magnitudes and spectral type in comparison to the primary and are thus not discussed further. An observing log of the 51 stars (49 targets 2 visual companions) which form our final sample for this work is presented in Table 1. Photometry, proper motions, and parallax measurements from the literature are documented in Table 2.
On 2001 June 18 (UT), the ten Hipparcos selected targets and five FSC targets were observed using the Hamilton Echelle Spectrometer at Lick Observatory. The Hamilton echelle covers a wavelength range of 3500-10000Å with a resultant resolving power of 60,000 at 6000Å when using a slit width of 1.2″. During April 2002, a further 36 target stars of the second catalog search were observed using the echelle spectrograph on the Irénée du Pont telescope at Las Campanas Observatory. The du Pont spectrograph observes a wavelength range of 3700-9800Å with a resolving power of 40,000 at a slit width of 0.75″. On both observing runs, comparison arc spectra were taken to establish a pixel to wavelength calibration. At LCO, Thorium-Argon lamp spectra were taken between each object exposure because the spectrograph is situated at the Cassegrain focus, whereas the Coudé-fed Hamilton echelle required less frequent arc calibration, with arc spectra be taken at the beginning and end of the night.
2.3 Reduction Procedure
The echelle data were reduced using IRAF111Image Reduction and Analysis Facility, IRAF, is distributed by the National Optical Astronomy Observatories, which are operated by the Association of Universities for Research in Astronomy, Inc., under cooperative agreement with the National Science Foundation. to perform standard spectral reduction procedures. Instrumental effects were accounted for via measurement of bias level and read noise, variations in pixel-to-pixel CCD response were removed in the flat fielding process, and dead columns were identified (which then prevented measurement of the H 6563 Å line). A basic reduction process was then followed to locate and extract the echelle orders as well as remove scattered light. The Thorium-Argon arcs were similarly extracted, their features identified so as to wavelength calibrate the object spectra. Examples of IRAF routines employed include apall, ecidentify, refspec, and dispcor.
3 ANALYSIS
We aim to identify the subset of our sample which shows evidence for youth consistent with membership to a young, 5 Myr-old association. Additionally, we wish to assess kinematic properties and test for comovement. To these ends, from the literature, we obtain effective temperatures as well as near infrared photometry and proper motions. From the spectra, we measure Li I equivalent widths as well as radial velocities. Utilizing these data, we estimate ages and select a youthful, high lithium sample, and we test for kinematic similarity against the velocity models of nearby, young moving groups.
3.1 Effective Temperatures
Spectral types for the majority of our sample are reported in the literature (Houk, 1982; Houk & Smith-Moore, 1988; Houk & Swift, 1999; Torres et al., 2006). These are converted to using the main-sequence spectral type– relationship of Kenyon & Hartmann (1995). We supplement these with spectral types determined from low-resolution spectra obtained with the Lick KAST spectrograph (A. Weinberger, unpublished data) as well as determined from the Fe I to Sc I line ratio (cf. Stassun et al., 2004; Steffen et al., 2001) observed in our high-resolution spectra (§2.2). The line ratios measured for our spectral type standards are in good agreement with the calibration of Basri & Batalha (1990); we thus adopt their line ratio-spectral type scale in assigning types to our sample. In some cases, primarily for more massive stars, the Fe I and Sc I lines were not present or could not be measured with confidence above the noise level. values are summarized in Table 3. Where multiple values are available, they generally show good consistency with one another to within K (corresponding to spectral subclasses). For our final set of effective temperatures, we adopt literature spectral types where available, line ratio spectral types if not. For one object, HD 157310B, neither were available, and thus we interpolated its 2MASS (2 Micron All Sky Survey, Skrutskie et al., 2006) color over the effective temperature-color relationship of Kenyon & Hartmann (1995). The set of adopted temperatures is reported in the final column of Table 3.
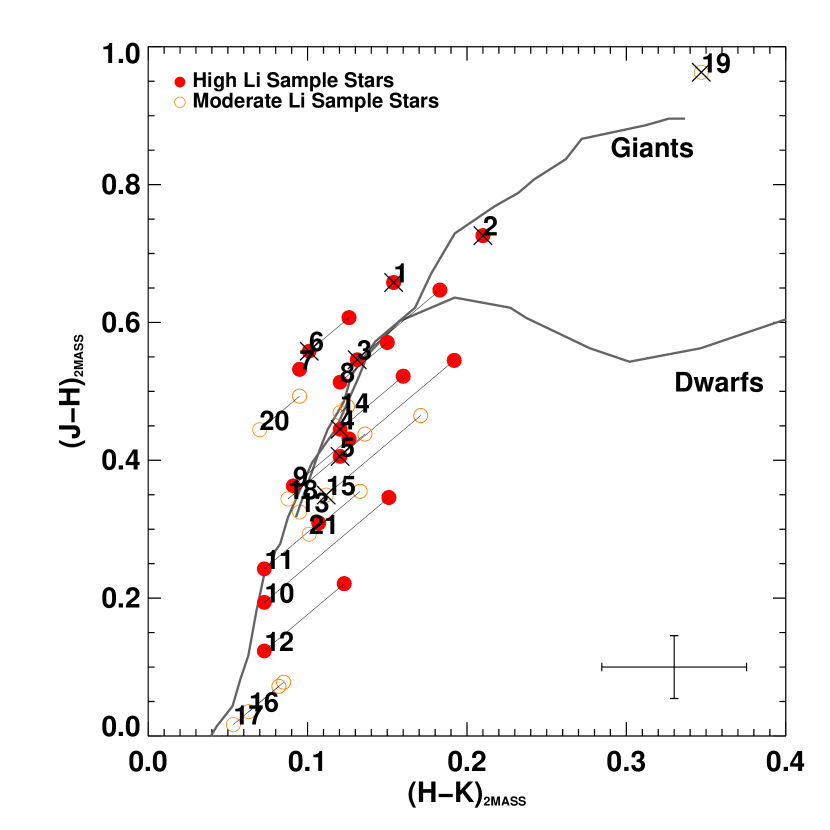
In Fig. 2 we show these effective temperatures as a function of the objects’ observed 2MASS colors; also plotted is the relationship from Kenyon & Hartmann (1995). For comparison, the standard stars observed (Table 1) are also shown in this parameter space. The observed colors follow the expected relationship with with a scatter of K, consistent with the scatter in from spectral types above. This indicates that our sample in general suffers relatively little extinction. Indeed, radio survey column-density measurements (Kalberla et al., 2005) in the direction of our targets indicate that reddening toward our sample should be mag. Via comparison with expected intrinsic for a star of given effective temperature, we derive band extinction values, , and deredden the sample accordingly. colors are plotted in Fig. 3; lines illustrate dereddening by connecting colors before and after dereddening. Also displayed for comparison are the dwarf sequence from Bessell & Brett (1988) as well as reddening vectors assuming the standard ratio of total-to-selective extinction . For visual clarity, we only display the 21 targets identifed as lithium rich (§3.2). The -band extinction corresponding to the applied dereddenings is in all cases mag, with the exceptions of 2MASS J17215666-2010498 and TYC 6191-0552-1 (objects #19 and #2 in the data tables) for which mag and mag, respectively. We have checked Spitzer 24m data (A. Weinberger, private communication) and find that while most of the high Lithium sample lacks 24m excess, 2MASS J17215666-2010498 has a substantial excess. TYC 6191-0552-1 was analyzed by Meyer et al. (2008) and was found to have moderate 24m excess. For both objects, apparent excess in the and bands in concert with 24um excess confirms disk presence and thus we cannot and do not apply a standard interstellar dereddening law.
3.2 Lithium Equivalent Width
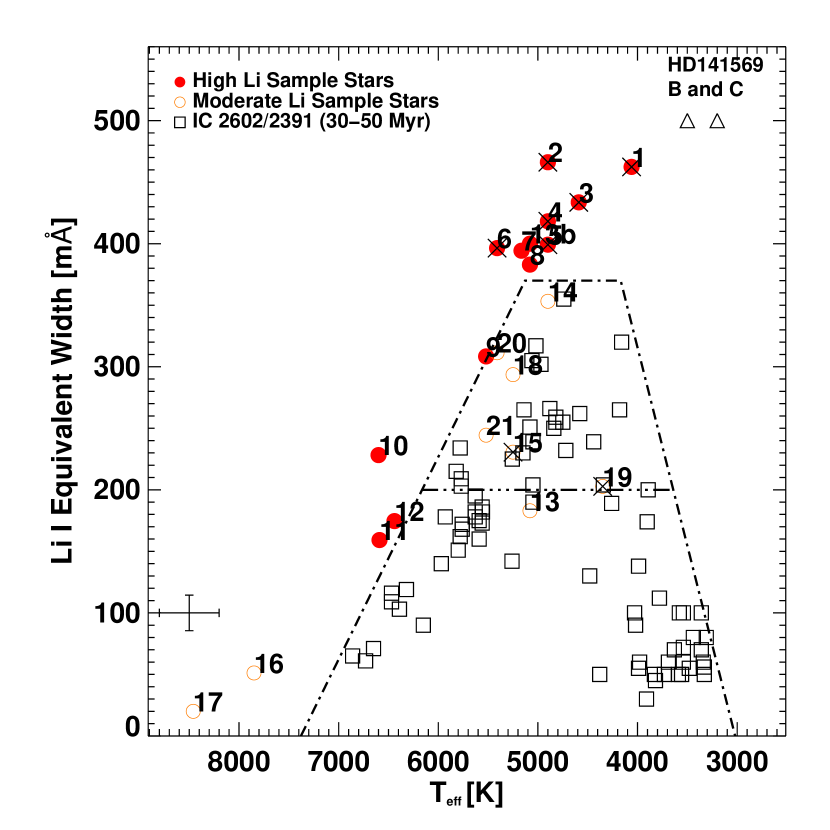
We measured the equivalent width (EW) of the 6707 line of Li I from our spectra using the IRAF routine Splot. For each star, EW measurements were obtained by both directly integrating the flux in the line and by calculating the area of a best-fitting Gaussian. Our measured EW values include contributions from the small Fe I+CN line at 6707.44Å, leading to measured Li I EWs that are representative of a slightly (10-20 mÅ) over-estimated photospheric Li presence. For instance Soderblom et al. (1993) report that this Fe line blend has an EW = [20(B-V)0-3]mÅ for main sequence solar-type stars. We correct for contamination following this prescription and find the median value for the sample is 10 mÅ; we report in Table 3 the Li I EWs for each target via both measurement methods as well as the Fe line blend contribution. For all targets, the rms of the difference between the EWs determined using both methods is 18.4 mÅ. With the aim of conservatively selecting a sample, we utilize the lower of the two measured values; these are plotted in Fig. 4.
To identify the young stars in the sample, Li I EWs were compared to the upper envelope of EWs as a function of reported in the literature for the Myr-old clusters IC 2602 and IC 2391 (Randich et al., 1997, 2001, our Fig. 4). Twelve stars are found to have Li I EWs above this envelope, compelling evidence of youth. In what follows we refer to these 12 stars as the “High Li” sample.
Also of interest, the H profiles of several objects are in emission in our spectra and some possess double-peaked profiles. Another 6 stars show elevated lithium levels (mÅ but are below the threshold shown in Fig. 4), placing them in the upper envelope of the IC 2602 and IC 2391 loci. An additional two stars have temperatures greater than 7500K and equivalent widths above the locus; although these are potentially older stars which simply lack deep enough convective zones to deplete primordial lithium abundances, we include them in the analyses for completeness. We also include star #13 in this group as it is in a double system separated by 1.2″while the seeing that night was 1.5″, making Li line filling likely. In Fig. 4, this star is plotted with its measured equivalent width doubled (denoted “13b”) to demonstrate which sample group it would potentially belong to. In what follows, we refer to these 9 stars as the “Moderate Li” sample, two of which show double-peaked H in emission (Table 3).
These 21 stars, which are the most likely in our sample to be of comparable age to HD 141569, will be the focus of the remainder of our analyses. For ease in tracking these stars through our analysis, they are labeled with a running numerical identifier in the data tables and figures, and all EW and line profile information is reported in Table 3.
3.3 Radial Velocity
Heliocentric radial velocities were obtained using the IRAF task fxcor to cross correlate each target spectrum against the radial-velocity standard star of closest spectral type (Table 1). Four echelle orders spanning the wavelength ranges 6025-6150Å, 6150-6275Å, 6625-6750Å, and 5120-5220Å were employed as they contain many deep metallic lines and little or no telluric contamination. In Table 4 we report the mean radial velocities from the four orders.
To determine the extent to which our radial-velocity measurements may be affected by the and signal-to-noise (S/N) of our target spectra, we performed a Monte Carlo simulation in which a narrow-lined, high S/N standard star spectrum was randomly degraded one hundred times. This process created artificially noisy spectra at S/N levels of 10–100, well representing the full range of S/N found in our sample. Each degraded spectrum was artificially broadened and cross-correlated against its original high S/N spectrum. These degraded spectra were furthermore cross-correlated against the other standard stars to assess the effects of spectral-type mismatch on the resulting radial velocities. We find that these effects are negligible (i.e. affecting the resulting radial velocities by km s-1) unless km s-1 or S/N . As all of our target spectra have S/N , only very fast rotators are potentially affected (by up to 2.3 km s-1 for km s-1). Measured and radial velocity values are documented in Table 4. In addition to these effects, we note that on an aperture-to-aperture basis, errors in wavelength calibration could affect the measured radial velocity; this can be quantified as the standard deviation of the mean radial velocity measured from the four selected apertures. The final radial-velocity uncertainties quoted in Table 4 are the quadrature sum of the internal uncertainty (the standard deviation of the four spectral orders used) and the uncertainty arising from rotational broadening.
3.4 Moving Cluster Parallaxes
With observed proper motions and measured radial velocities for the 21 “High” and “Moderate” lithium stars, a kinematic picture of the sample is almost complete. Tycho-2 proper motions were used for consistency throughout (Table 2), the only exception being one of the two close visual binary companions, HD 157310B, for which only UCAC2 (Zacharias et al., 2004) proper motions were available. Proper motion data are not available for the other close companion, 2MASS J17215666-2010498; in what follows, we assume common proper motion with its primary star, TYC 6242-0104-1. Hipparcos parallaxes are unavailable for the high lithium stars, thus a moving cluster parallax method (de Bruijne, 1999) provides a means for determining their parallaxes and hence their distances. With distances, it can be tested then whether these objects are consistent with being members of a coherent moving group.
Our procedure is rooted in the derivation of de Bruijne (1999, see their 2 and references therein). The process is executed assuming a velocity vector, and hence a convergent point, for the moving group to which we are testing membership. In analyzing the spatial distribution of the 21 stars of our youthful sample, we note they are all in closer proximity to Upper Sco and UCL than HD 141569 (see Fig. 5). The youthful sample is highly spatially separated from HD 141569, and these separations indicate two kinematic issues. First, it is unlikely for objects with such large separations to be comoving. Second, had these stars indeed formed together, large initial velocities (6 km s-1, inconsistent with the observed 1-2 km s-1 velocity dispersions of young associations) would be required to bring about the separations presently observed after 5 Myr of motion. As it is unlikely these objects are associated with HD 141569, we require estimates of the mean velocity vectors for Upper Sco and UCL. The velocity vector for Upper Sco is adopted from Mamajek (2008): = [5.2,16.6,7.3] km s-1. This vector incorporates a mean radial velocity for 120 Upper Sco members, an improvement over prior velocity vectors which solely rely upon proper motion and parallax information. For UCL, the velocity model used for comparison is derived from the median position, proper motion, and radial velocities of UCL members (de Zeeuw et al., 1999); = [5.4,19.7,4.4] km s-1. We calculate these vectors for Upper Sco and UCL to precisions of 0.3 and 0.4 km/s respectively, but note, there exist discrepancies between vectors derived by various authors.222For example, Madsen et al. (2002) calculate for Upper Sco = [0.9,16.9,5.3] km s-1. de Bruijne et al. (2001) cite = [4.1,17.9,3.7] km s-1 (with model-observation discrepancy parameter “g” set to equal nine) while de Zeeuw et al. (1999) report = [0.0,16.1,4.6] km s-1. The reason for the systematic differences between published convergent points and velocity vectors for the OB subgroups is not completely clear. The leading candidates for these systematic differences are unaccounted-for expansion of the subgroups, and the probable presence of unresolved spatial and kinematic substructure within the subgroups. For robustness, we include all available radial velocity measurements in derivation of UVW vectors.
For each of the 21 stars in our “High Lithium” and “Moderate Lithium” samples, we derive moving cluster parallaxes using the HD 141569 and Upper Sco velocity vectors (Table 4). The formalism for this is:
| (1) |
where is the parallax, A is 4.74 km yr s-1 (the ratio of one AU in km to a Julian Year in s), is the parallel component of proper motion (proper motion in the direction of the convergent point), is the velocity of the group in km s-1, and is the angular separation between the star and the convergent point (formula 1, Mamajek, 2005). An additionally useful parameter, the comovement probability, can also be calculated. Comovement probability is defined as , where is the likelihood that the star’s proper motion is entirely perpendicular to the direction of the convergent point; the projection of proper motion in this direction is denoted , and a close to 0 is indicative of comovement.
4 RESULTS
4.1 Distances, comovement probabilities, and membership
The spatial proximity of our youthful sample stars to Upper Sco and UCL (Fig. 5) suggests that these objects are not likely related kinematically to the farther away HD 141569 system. It is important to stress at this juncture that derived comovement probabilities are not absolute probabilities per se; their derivation depends directly on the velocity model assumed a priori. We do know with certainty that the stars in our sample are young (by virtue of their high Li abundances) and that they are moreover in projected proximity to other stars known to be young, nearby, and comoving (Fig. 1). Thus there is a strong “prior” favoring the velocity models that we have chosen to test. Still, the comovement probabilities reported in Table 4 should be regarded as measures of consistency with the assumed velocity models, not proof of membership. We therefore adopt the very simple criterion of spatial proximity to a group in application of velocity modeling, and report the resulting distances and comovement probabilities for objects when tested against the velocity vectors of Upper Sco and UCL. Parallax distances and comovement probabilities calculated as previously described (§3.4) are reported in Table 4.
Based on two simple criteria, youth determined via measurement of the 6707 line and spatial position, objects 2, 6, 7, 8, 9, 11, 13, 15, and 21 lie within the Upper Scorpius “box” as defined by de Zeeuw et al. (1999). Similarly, stars 4, 5, 14, 17, and 20 appear to be UCL members. These “spatial matches” are summarized in column 3 of Table 5. Due to the similarities of velocity vectors in the Ophiucus-Sco-Cen region, it is unsurprising that in some cases, objects we deem US or UCL members have higher comovement probabilities when tested against the velocity vector of the other group. Factors which create blurring of kinematic boundaries include internal velocity dispersions inherent to a given moving group and observational uncertainties which then propagate into the convergent point solution. We thus take position as the strongest indicator of group membership and then examine comovement probabilities as a supplement. Outside of the Upper Sco box, stars 3, 12, and 18 have high comovement probabilities with Upper Sco. We would present 12 and 18 with some caution as Upper Sco members, as they are within a few degrees of the most extended, already known Upper Sco members.
Object 3 is almost ten degrees away from the southernmost US stars and thus its association with Upper Sco is also dubious. For these three objects, we tentatively suggest Upper Sco membership and denote their membership in Table 5 as “US?” In two cases we note objects with low comovement probabilities with their spatially matched groups: objects 1 and 19 do not have velocities consistent with US and are spatially inconsistent with being UCL members. Object 15, while spatially coincident with Upper Sco, has low enough comovement probability to be suspect. Finally, stars 10 and 16 have high comovement probabilities with Upper Sco, but appear to be too far away in space to be considered part of Upper Sco. These remaining five objects we also classify as being of “Indeterminate” membership. In summary, the total number of new Upper Sco members presented here is eight, and five new members of UCL are also identified.
4.2 Space Motions
To illustrate kinematic association in a familiar way, we could utilize the transformation matrices of Johnson & Soderblom (1987) to calculate space motions for the sample stars. motions, however, depend on distance, a quantity we have obtained via assumption of comovement with a given vector. The resulting plot is thus degenerate and does not provide additional criteria by which we can further examine association.
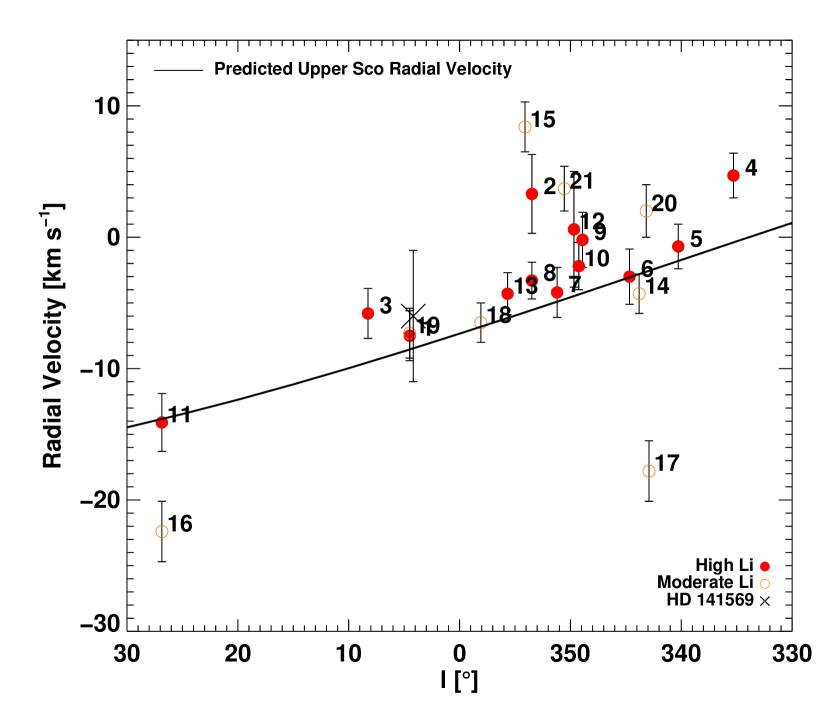
As an additional check on the application of each velocity model, given an assumed velocity vector, radial velocities for each object can be predicted based on their proper motions and positions. We find good consistency between the predicted radial velocities and those measured when comparing measured radial velocity to predicted radial velocity for whichever velocity model we would naïvely expect need be applied given simple spatial proximity to a given moving group. Illustrating the radial velocity structure of the sample in context with nearby groups can be a measurement-based, assumption-free way of analyzing space motions. In the selection criteria we constrained proper motions to agree with those of HD 141569 within a wide range of values which includes proper motions generally observed in Upper Sco. Measured radial velocities and projected radial velocities for the Upper Sco velocity vector are plotted as a function of galactic longitude in Fig. 6. Most notably, the entire “High Li” sample agrees well with the predicted radial velocities of Upper Sco within 2-3. The farthest outlying points are from the “Moderate Li” sample.
4.3 H-R Diagram
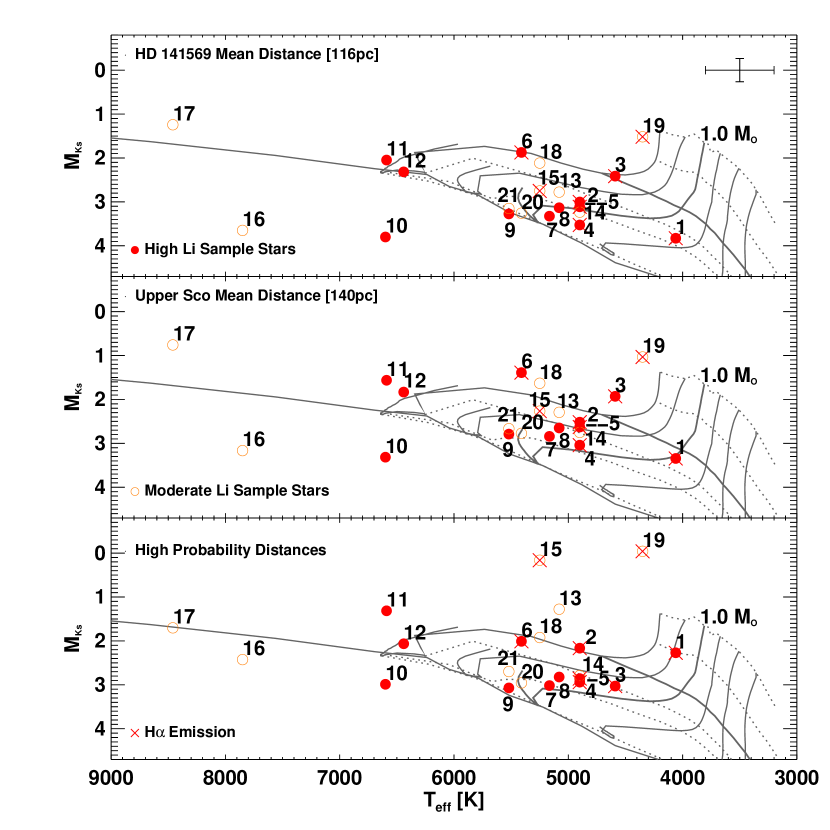
In Fig. 7 we show the placement of the sample stars on three HR diagrams to illustrate shifts in MKs magnitude due to changes in distance. Absolute magnitudes were calculated from the observed 2MASS KS magnitudes (Table 2) and one of three distances. Uncertainties in MKs are the propagated errors of the 2MASS photometry together with the formal errors in distance. The uncertainty in is taken to be two spectral subtypes (see §3.1). To derive ages for our sample stars we also show the pre-main-sequence (PMS) evolutionary tracks of Baraffe et al. (1998) and D’Antona & Mazzitelli (1997).
In the upper panel, we illustrate placement of the sample on the HRD when we apply the distance to the HD 141569 system to every individual object. The isochronal ages inferred for most stars in our sample using the HD 141569 mean distance are in general older (–100 Myr) than what would be expected for the stars based on their lithium abundances and comovement with the HD 141569 system (age Myr). In concert with the lack of spatial proximity, we further rule out the potential for a coeval, coherent moving group near HD 141569.
In contrast, the inferred ages using the Upper Sco mean distance (145pc, effectively equivalent that of UCL, 142pc) are entirely consistent with the expectation of 30 Myr as imposed by the Li EW measurements. All stars appear on or above the 30 Myr isochrone, save objects #10 and #16, which, despite their high comovement probabilities with Upper Sco, do not appear to be in close enough spatial proximity to be members of that moving group. In the third HR diagram, applied distances are determined by which velocity model, US or UCL, provides the highest comovement probability with a given object. This particular representation is not only mostly consistent with the age range expected from Li I presence, it also “correctly” places the higher mass objects closer to the ZAMS; particularly, objects 10, 16, and 17 have derived distances which make them appear to be ZAMS stars rather than anomalous objects far above or below the theoretical isochrones.
Scatter in an HRD generally can be attributed to many factors; the radial extent of a young association (Mamajek, 2005, e.g., TW Hydra 55pc), observational errors, or even the choice of evolutionary tracks can generate shifts and enhance spread in isochronal age of a sample expected to be coeval. Using the D’Antona & Mazzitelli (1997) evolutionary models, our sample stars all appear to have isochronal ages 10 Myr. In general, these tracks appear shifted by 400K to higher temperatures with respect to the Baraffe et al. (1998) tracks. For an illustration of these track-based discrepancies, see Simon et al. (2000). In spite of obstacles posed by apparently discrepant HR diagrams, we can say with confidence based on Li I presence that these objects are indeed young, 30 Myr. The HR diagram, when applying high comovement probability derived distances, provides a higher degree of confidence in adopting these distances as the ages are indeed as expected from Li measurements.
4.4 Is HD 141569 Related to Upper Sco?
HD 141569 is an apparently isolated system located within tens of degrees (and parsecs) of known sites of recent (5 Myr) and ongoing star formation, all apparently associated with the Sco-Cen star forming complex ( = 100-200 pc; Preibisch & Mamajek, 2008, in press), which appears contiguous with the Aquila Rift regions (Dame et al., 1987, 30;). HD 141569 appears to agree with the projected velocity model of Upper Sco (see Fig. 6, but we can rule out the possibility of HD 141569 originating or being kinematically associated with Upper Sco. The hypothesis that HD 141569 could have been ejected at high velocity from a known high density stellar nursery can be strongly discounted on two grounds. First, HD 141569 has two low-mass companions at wide separation (103 AU, with likely orbital motion of 1 km s-1). A velocity kick of 2-3 km s-1 to either A or B+C would have likely disintegrated the system. A low velocity ejection (2-3 km s-1) would have placed the birth site within 10-15 pc (5∘-7∘), but no such known young clusters or molecular clouds appear there.
Position and velocity information for these nearby groups was entered into an orbit code which employs the epicyclic approximation. The separations between these groups and HD 141569 were evaluated during the past 10 Myr; combined distance and velocity vector uncertainties result in 15 pc uncertainties over this time frame. Presently, HD 141569 is 55 pc away from the center of Upper Sco, and was only slightly closer at its minimum separation of 53 pc (2.7 Myr ago). In , the only substantial difference is in the component of velocity: while Upper Sco has negligible vertical motion with respect to the Local Standard of Rest (Mamajek, 2008), HD 141569 is moving northward out of the disk at 5 km s-1. This anomalous component of motion is discrepant with any known molecular cloud or star forming region near HD 141569. Further, given the kinematic data and the isochronal age of HD 141569 (4-5 Myr), it appears that HD 141569 could not have formed from any of the known sites of recent star-formation in its vicinity. The list of excluded birth-sites includes Upper Sco, UCL, Lower Centaurus Crux (LCC), and the Ophiuchus, Corona Australis, and Lupus clouds.
Combining the kinematic, position, and age data, we conclude that the HD 141569 triple system likely formed in isolation or with a small entourage of companions in a cloud. It appears to have formed 25 pc closer to the Galactic plane than its present position, and its anomalously large W velocity component has carried it to its modern high latitude position ( +37, 90 pc above the Galactic plane).
5 Summary and Conclusions
We have identified a group of 21 PMS stars within 30° of HD 141569 on the basis of strong Li I absorption and, in 9 of those 21 cases, H in emission. These stars were selected through a joint catalog search for X-ray sources with spatial and proper-motion characteristics similar to those of HD 141569, a B9.5Ve star at 116 pc that harbors a circumstellar disk and for which two low-mass companions had previously been identified (Weinberger et al., 2000). For these 21 stars, we have applied a moving cluster parallax technique to proper-motion data from the literature.
Table 5 outlines our final membership assessments: we present eight potential new members of Upper Sco and five new potential members of UCL. These stars possess lithium presence consistent with youth and futhermore appear youthful on the HR diagram. Primarily we utilize spatial position as the principal criterion for determining membership and supplement that with comovement probabilties from the moving cluster parallax derivation. Additionally, we examine the motion of the HD 141569 system away from the galactic midplane over its lifetime. The system, surprisingly, appears to have formed in isolation, well outside of presently known star forming regions and molecular clouds.
| Object Name | Right Ascension | Declination | Observation Time | Integration | S/N(1)(1)footnotemark: | Comment(s) |
|---|---|---|---|---|---|---|
| [J2000] | [J2000] | [UT] | Time [s] | |||
| 2001-06-18 : UCO / Lick | ||||||
| Alpha Boo | 14:15:39.67 | +19:10:56.7 | 04:17:13.0 | 1 | 200 | K2III Standard |
| HD 137396 | 15:26:05.91 | -11:41:55.7 | 04:28:35.0 | 720 | 127 | |
| RHS 48 | 15:23:46.0 | -00:44:25 | 04:52:38.0 | 1500 | 158 | |
| HD 138969 | 15:35:47.41 | -12:51:32.9 | 05:25:23.0 | 720 | 105 | |
| HD 140574 | 15:44:26.30 | -03:50:18.5 | 05:45:22.0 | 720 | 132 | |
| HD 141612 | 15:50:11.35 | -06:32:14.6 | 06:05:08.0 | 1500 | 178 | |
| HD 141693 | 15:50:11.86 | +05:57:17.2 | 06:37:21.0 | 360 | 105 | |
| HD 142987 | 15:58:20.558 | -18:37:25.09 | 06:50:42.0 | 1800 | 75 | |
| TYC 6191-0552 | 15:58:47.724 | -17:57:59.79 | 07:30:24.0 | 2400 | 31 | |
| HD 143332 | 16:00:02.65 | -07:07:21.8 | 08:17:18.0 | 600 | 126 | |
| HIP 79354 | 16:11:44.57 | +00:47:38.6 | 08:34:18.0 | 1000 | 97 | |
| HD 145551 | 16:11:56.93 | -10:37:20.3 | 08:58:01.0 | 600 | 98 | |
| BD -06 4414 | 16:22:17.866 | -06:23:03.93 | 09:15:34.0 | 600 | 72 | |
| HD 143810 | 16:02:47.47 | -10:37:56.7 | 09:32:25.0 | 600 | 72 | |
| HD 144726 | 16:07:44.91 | -11:55:13.1 | 09:49:16.0 | 600 | 145 | |
| HD 145169 | 16:09:50.80 | -11:07:56.5 | 10:06:16.0 | 450 | 95 | |
| HD 177178 | 19:03:32.25 | +01:49:07.6 | 10:20:40.0 | 300 | 175 | A4V Standard |
| HD 187691 | 19:51:01.64 | +10:24:56.6 | 10:33:26.0 | 240 | 184 | F8V Standard |
| 16 Cyg/HD186427 | 19:40:32.06 | +50:31:03.1 | 10:45:50.0 | 240 | 197 | G2V Standard |
| HD 184467 | 19:31:07.97 | +58:35:09.6 | 10:59:00.0 | 300 | 139 | K2V Standard |
| 2002-04-17 : LCO | ||||||
| HD 80170 | 09:16:57.08 | -39:24:00.5 | 01:07:53.4 | 30 | 107 | K5III Standard |
| HD 102870 | 11:50:41.72 | +01:45:53.0 | 01:16:31.1 | 20 | 131 | F9V Standard |
| TYC 6141-0525-1 | 14:06:06.475 | -18:10:37.41 | 03:17:19.9 | 1080 | 81 | |
| TYC 0909-0125-1 | 14:19:33.692 | +08:38:09.59 | 03:43:18.4 | 1080 | 79 | |
| TYC 7312-0236-1 | 15:12:44.473 | -31:16:48.10 | 00:00:00.0 | 1500 | 89 | |
| TYC 7327-0689-1 | 15:37:51.344 | -30:45:16.15 | 04:37:09.7 | 1500 | 77 | |
| TYC 5003-0138-1 | 15:26:52.727 | -00:53:11.74 | 05:09:45.3 | 1500 | 112 | |
| TYC 0937-0754-1 | 15:38:00.94 | +11:34:57.30 | 05:41:42.1 | 1500 | 75 | |
| TYC 6781-0415-1 | 15:41:31.212 | -25:20:36.39 | 06:16:54.2 | 900 | 86 | |
| TYC 6790-1227-1 | 15:48:02.922 | -29:08:37.02 | 06:40:12.4 | 1500 | 101 | |
| HD 142016 | 15:53:12.969 | -30:46:44.17 | 07:26:45.0 | 255 | 58 | |
| TYC 0376-0769-1 | 16:19:59.977 | +04:36:46.33 | 07:42:44.8 | 1200 | 85 | |
| TYC 7346-1182-1 | 16:42:07.711 | -30:38:37.87 | 08:12:47.3 | 1200 | 117 | |
| HD 153439 | 17:00:42.963 | -27:25:17.55 | 08:37:23.9 | 750 | 136 | |
| CD -25 11942 | 17:06:01.190 | -25:20:30.40 | 08:57:16.9 | 900 | 150 | |
| TYC 6817-1757-1 | 16:49:35.996 | -27:28:07.78 | 09:18:32.5 | 1350 | 80 | |
| HD 188376 | 19:55:50.36 | -26:17:58.2 | 09:47:46.4 | 65 | 109 | G5V Standard |
| HD 165341 | 18:05:27.29 | +02:30:00.4 | 09:58:15.0 | 45 | 206 | K0V Spectral Type Standard |
| HD 209290 | 22:02:10.27 | 01:24:00.8 | 10:06:48.1 | 750 | 52 | M0.5V Spectral Type Standard |
| 2002-04-18 : LCO | ||||||
| TYC 5022-0263-1 | 15:48:40.942 | -03:10:44.22 | 06:22:52.4 | 1500 | 116 | |
| HD 143358 | 16:01:07.927 | -32:54:52.53 | 06:54:12.0 | 900 | 117 | |
| HD 144713 | 16:08:05.223 | -24:55:33.2 | 07:14:23.6 | 900 | 153 | |
| HD 144732 | 16:08:26.317 | -28:25:49.3 | 07:34:59.7 | 1200 | 105 | |
| TYC 6806-0888-1 | 16:23:46.978 | -28:50:02.43 | 07:59:41.7 | 1800 | 100 | |
| TYC 6803-0897-1 | 16:29:49.911 | -27:28:49.96 | 08:35:31.7 | 1800 | 99 | |
| HD 148982 | 16:32:50.876 | -28:20:39.89 | 09:11:17.0 | 1200 | 115 | |
| HD 157310 | 17:22:23.477 | +04:45:24.83 | 09:38:10.9 | 1200 | 99 | Double star - brighter component |
| BD 04 3405B | 17:22:23.5 | +04:45:13.3 | 09:59:37.2 | 1200 | 60 | Double star - fainter component |
| 2002-04-19 : LCO | ||||||
| HD 141813 | 15:51:54.393 | -26:22:05.52 | 05:41:33.5 | 900 | 120 | |
| HD 148396 | 16:28:51.327 | -30:16:55.26 | 06:06:32.7 | 1500 | 119 | Catalogued Double star |
| TYC 0976-1617-1 | 17:01:57.543 | +07:33:32.45 | 06:40:26.6 | 2400 | 100 | SB (2) |
| HD 154922 | 17:09:07.521 | -18:15:22.78 | 07:27:02.2 | 450 | 107 | |
| 2MASS J17215666-2010498 | 17:21:56.67 | -20:10:49.8 | 08:03:30.1 | 3600 | 52 | Double star - brighter component |
| TYC 6242-0104-1 | 17:21:56.048 | -20:10:51.97 | 09:09:59.6 | 3600 | 71 | Double star - fainter component |
| 2002-04-20 : LCO | ||||||
| HD 109524 | 12:35:33.55 | -34:52:54.9 | 04:11:22.8 | 750 | 238 | K2V Standard |
| HIP 75685 | 15:27:42.638 | -02:45:18.56 | 05:43:37.4 | 900 | 122 | |
| TYC 6234-1287-1 | 17:26:56.545 | -16:31:34.85 | 06:06:12.0 | 1800 | 118 | |
| TYC 7334-0429-1 | 16:04:30.557 | -32:07:28.7 | 06:43:18.0 | 1500 | 110 | |
| TYC 5668-0365-1 | 17:40:55.47 | -12:16:27.75 | 07:14:42.1 | 2400 | 134 | |
| HD 144393 | 16:06:06.470 | -12:18:15.22 | 08:01:37.6 | 360 | 109 | |
| TYC 6214-2384-1 | 16:19:33.958 | -22:28:29.41 | 08:59:30.1 | 1800 | 99 | |
| TYC 6215-0184-1 | 16:29:48.700 | -21:52:11.89 | 09:35:25.5 | 2400 | 129 | SB (2) |
| HD 177178 | 19:03:32.25 | +01:49:07.6 | 10:24:04.7 | 150 | 109 | A4V Standard |
Note. —
| Plot | Object Name | (1)(1)footnotemark: | (1)(1)footnotemark: | (1)(1)footnotemark: | (2)(2)footnotemark: | (2)(2)footnotemark: | Parallax(3)(3)footnotemark: |
|---|---|---|---|---|---|---|---|
| ID | [mas yr-1] | [mas yr-1] | [mas] | ||||
| A | HD 141569 | 6.8720.027 | 6.8610.040 | 6.2810.026 | -18.31.1 | -20.51.1 | 8.630.59 |
| 1 | TYC 6242-0104-1 | 9.9630.027 | 9.3050.026 | 9.1510.024 | -11.73.6 | -13.74.0 | |
| 2 | TYC 6191-0552 | 9.2610.022 | 8.5350.042 | 8.3250.024 | -15.03.3 | -20.23.7 | |
| 3 | TYC 6234-1287-1 | 8.6590.025 | 8.0120.024 | 7.8290.020 | -10.12.6 | -39.02.7 | |
| 4 | TYC 7312-0236-1 | 9.6010.024 | 9.0790.024 | 8.9190.019 | -20.53.3 | -20.53.2 | |
| 5 | TYC 7327-0689-1 | 9.3000.024 | 8.7550.036 | 8.5630.019 | -19.73.2 | -27.53.1 | |
| 6 | TYC 6781-0415-1 | 7.9740.030 | 7.3670.033 | 7.2410.024 | -19.52.7 | -30.12.4 | |
| 7 | TYC 6803-0897-1 | 9.2750.024 | 8.7430.049 | 8.6480.025 | -15.62.5 | -28.62.5 | |
| 8 | TYC 6214-2384-1 | 9.2300.019 | 8.6590.036 | 8.5090.019 | -18.73.5 | -26.23.8 | |
| 9 | TYC 6806-0888-1 | 9.2160.025 | 8.7850.027 | 8.6590.026 | -13.43.0 | -27.52.7 | |
| 10 | BD 04 3405B | 9.7590.022 | 9.4130.031 | 9.2620.019 | -5.31.5* | -14.91.8* | |
| 11 | HD 144713 | 7.8470.021 | 7.5380.034 | 7.4310.020 | -11.71.7 | -20.71.6 | |
| 12 | HD 153439 | 8.0730.020 | 7.8520.049 | 7.7290.047 | -6.71.6 | -28.61.6 | |
| 13 | HD 148396 | 8.4200.023 | 8.0950.019 | 8.1000.020 | -6.92.4 | -15.42.4 | |
| 14 | TYC 7334-0429-1 | 9.1680.018 | 8.6900.049 | 8.5650.021 | -17.52.2 | -25.52.2 | |
| 15 | TYC 6817-1757-1 | 8.8150.021 | 8.3500.042 | 8.1790.031 | -10.12.8 | -7.42.5 | |
| 16 | HD 157310 | 9.1600.022 | 9.0880.047 | 9.0060.021 | -5.41.5 | -12.01.5 | |
| 17 | HD 142016 | 6.7850.020 | 6.7070.034 | 6.6220.018 | -26.41.2 | -38.81.3 | |
| 18 | CD -25 11942 | 8.0990.020 | 7.6610.029 | 7.5250.038 | -9.82.0 | -28.21.8 | |
| 19 | 2MASS J17215666-2010498 | 8.1500.023 | 7.1870.047 | 6.8400.023 | |||
| 20 | TYC 6790-1227-1 | 9.2120.023 | 8.7190.026 | 8.6240.023 | -20.42.8 | -26.02.3 | |
| 21 | TYC 7346-1182-1 | 9.0180.027 | 8.6630.053 | 8.5300.019 | -14.32.3 | -27.02.2 | |
| HD 142987 | 8.2790.035 | 7.7740.063 | 7.6140.021 | -15.42.1 | -22.32.2 | ||
| HD 143358 | 8.4700.023 | 8.1640.036 | 8.0740.020 | -18.31.4 | -29.61.5 | ||
| BD -06 4414 | 8.3590.027 | 8.0430.038 | 7.9360.033 | -27.02.1 | -33.72.2 | ||
| HD 137396 | 7.6320.023 | 7.4930.033 | 7.4190.027 | -14.91.4 | -12.01.0 | ||
| HD 138969 | 7.9460.027 | 7.6930.040 | 7.6660.017 | -11.31.4 | -8.51.0 | 10.691.4 | |
| HD 140574 | 7.6230.018 | 7.4950.036 | 7.4590.029 | -27.21.3 | -30.20.9 | 10.81.15 | |
| HD 141612 | 8.8080.024 | 8.4970.057 | 8.3980.031 | -17.72.4 | -10.71.8 | 9.621.74 | |
| HD 141693 | 6.8860.020 | 6.8880.034 | 6.8280.023 | -29.71.2 | -26.50.7 | 8.960.96 | |
| HD 141813 | 8.2320.023 | 7.9630.036 | 7.8620.020 | -22.71.7 | -38.11.9 | ||
| HD 143332 | 6.9870.024 | 6.7830.044 | 6.6800.023 | -10.61.3 | -24.91.3 | 9.961.36 | |
| HD 143810 | 8.9530.030 | 8.7660.061 | 8.6430.019 | -24.81.5 | -13.71.5 | 9.261.51 | |
| HD 144393 | 7.3230.027 | 7.0990.046 | 6.9800.021 | -6.31.2 | -23.91.1 | 10.971.14 | |
| HD 144726 | 7.5270.027 | 7.3220.036 | 7.2440.026 | -16.71.4 | -19.41.3 | 8.491.20 | |
| HD 144732 | 8.5310.023 | 8.2310.051 | 8.1470.026 | -15.22.1 | -33.21.9 | ||
| HD 145169 | 7.1590.039 | 6.9120.040 | 6.8760.023 | -20.21.1 | -30.51.1 | 12.751.78 | |
| HD 145551 | 7.9060.029 | 7.6770.042 | 7.6000.018 | -20.31.3 | -19.41.3 | 9.481.51 | |
| HD 148982 | 8.6690.026 | 8.3810.036 | 8.3080.023 | -15.82.0 | -25.41.7 | ||
| HD 154922 | 7.7420.023 | 7.5400.042 | 7.4560.021 | -7.41.3 | -13.11.2 | ||
| HIP 75685 | 9.1860.024 | 8.8700.042 | 8.8100.024 | -28.81.5 | -19.41.4 | 8.921.72 | |
| HIP 79354 | 8.0900.023 | 7.7520.031 | 7.6490.021 | -12.11.0 | -29.81.0 | 9.181.99 | |
| RHS 48 | 8.4650.029 | 7.8300.053 | 7.6240.024 | -15.11.6 | -10.61.7 | ||
| TYC 0376-0769-1 | 8.1960.024 | 7.6490.031 | 7.4960.036 | -18.81.8 | -4.41.7 | ||
| TYC 0909-0125-1 | 9.4330.026 | 8.9870.022 | 8.8960.023 | -16.22.7 | -17.62.6 | ||
| TYC 0937-0754-1 | 9.0160.029 | 8.5250.040 | 8.4040.023 | -13.12.0 | -1.42.0 | ||
| TYC 0976-1617-1 | 10.1580.026 | 9.7980.026 | 9.6640.021 | -11.03.0 | -15.13.1 | ||
| TYC 5003-0138-1 | 9.0840.023 | 8.4920.027 | 8.3170.026 | -27.31.6 | -13.11.5 | ||
| TYC 5022-0263-1 | 8.8550.029 | 8.4010.047 | 8.2440.031 | -6.73.2 | -24.53.4 | ||
| TYC 5668-0365-1 | 9.5640.024 | 9.0330.026 | 8.8400.025 | -2.82.2 | -18.72.3 | ||
| TYC 6141-0525-1 | 9.3350.027 | 8.9570.024 | 8.8720.024 | -15.22.3 | -35.92.4 | ||
| TYC 6215-0184-1 | 8.6770.026 | 8.0030.036 | 7.7560.024 | -3.62.9 | -21.83.1 |
Note. — For star #19, we adopt proper motions of its companion, #1.
| Plot | Object Name | Li I EW | Li I EW | Ctmn. | H | Spectral | Type | Teff | 6200/6210 | Spectral | Teff | Adopted Teff |
|---|---|---|---|---|---|---|---|---|---|---|---|---|
| ID | [mÅ] Integ. | [mÅ] GFit | [mÅ] | Flag(1)(1)footnotemark: | Type | Source(2)(2)footnotemark: | [K] | Line Ratio | Type | [K] | [K] | |
| 1 | TYC 6242-0104-1 | 491 | 487 | 25 | e* | K5 Ve | 2 | 4350 | 1.07 | K5 | 4350 | 4350 |
| 2 | TYC 6191-0552 | 481 | 492 | 15 | e* | K2 | 1 | 4900 | 1.91 | K2 | 4900 | 4900 |
| 3 | TYC 6234-1287-1 | 464 | 452 | 18 | e* | K4 Ve | 2 | 4590 | 2.65 | K1.5 | 4990 | 4590 |
| 4 | TYC 7312-0236-1 | 434 | 433 | 15 | e* | K2 Ve | 2 | 4900 | 2.30 | K2 | 4900 | 4900 |
| 5 | TYC 7327-0689-1 | 416 | 414 | 15 | e* | K2 Ve | 2 | 4900 | 2.52 | K2 | 4900 | 4900 |
| 6 | TYC 6781-0415-1 | 409 | 426 | 13 | e* | G9 IVe | 2 | 5410 | 4.69 | G9.5 | 5330 | 5410 |
| 7 | TYC 6803-0897-1 | 408 | 413 | 14 | a | 3.62 | K0.5 | 5165 | 5165 | |||
| 8 | TYC 6214-2384-1 | 397 | 398 | 14 | a | K1 IV | 2 | 5080 | 2.48 | K2 | 4900 | 5080 |
| 9 | TYC 6806-0888-1 | 320 | 345 | 12 | a | G8 IV | 2 | 5520 | 11.3 | G3 | 5830 | 5520 |
| 10 | BD 04 3405B | 233 | 242 | 5 | a | 6600⋆ | ||||||
| 11 | HD 144713 | 164 | 193 | 5 | a | F4 | 5 | 6590 | 6590 | |||
| 12 | HD 153439 | 180 | 198 | 5 | a | F5 V | 3 | 6440 | 6440 | |||
| 13 | HD 148396 | 197 | 216 | 14 | a | K1/2 + F | 3 | 5080 | 8.09 | G8.5 | 5465 | 5080 |
| 14 | TYC 7334-0429-1 | 368 | 378 | 15 | a | K2e | 2 | 4900 | 3.99 | K0 | 5250 | 4900 |
| 15 | TYC 6817-1757-1 | 274 | 244 | 13 | e* | K0 Ve | 2 | 5250 | 6.03 | G9 | 5410 | 5250 |
| 16 | HD 157310 | 52 | 76 | 1 | a | A7 II/III | 5 | 7850 | 7850 | |||
| 17 | HD 142016 | 20 | 57 | 0 | a | A4 IV/V | 3 | 8460 | 8460 | |||
| 18 | CD -25 11942 | 307 | 324 | 13 | a | K0 IV | 2 | 5250 | 8.72 | G8.5 | 5250 | |
| 19 | 2MASS J17215666-2010498 | 223 | 226 | 20 | e* | 0.58 | K7.5 | 4060 | 4060 | |||
| 20 | TYC 6790-1227-1 | 324 | 344 | 13 | a | G9 IV | 2 | 5410 | 4.53 | G9.5 | 5330 | 5410 |
| 21 | TYC 7346-1182-1 | 256 | 262 | 12 | a | G8 V | 2 | 5520 | 5.94 | G9 | 5410 | 5520 |
| BD -06 4414 | 10 | c | G5 | 1 | 5770 | 5770 | ||||||
| HD 137396 | 47 | 77 | 4 | a | F2/3 IV/V | 5 | 6890 / 6740 | 6815 | ||||
| HD 138969 | 113 | 109 | 9 | c | G1 V | 4 | 5945 | 4.68 | K9.5 | 3955 | 5945 | |
| HD 140574 | 1 | a | A9 V / A3 | 5 / 1 | 7390 / 8720 | 8055 | ||||||
| HD 141612 | 128 | 120 | 10 | a | G5 V | 5 | 5770 | 4.25 | K0 | 5250 | 5770 | |
| HD 141693 | a | A0 | 1 | 9520 | 9520 | |||||||
| HD 141813 | 201 | 187 | 14 | a | G8/K2 III + F/G | 3 | 5520 / 4900 | 31.4 | G2 | 5860 | 5210 | |
| HD 142987 | 150 | 216 | 10 | e* | G3/6 / G5 | 4 / 6 | 5830-5700/5770 | 5770 | ||||
| HD 143332 | 5 | a | F5 V | 5 | 6440 | 4.01 | K0 | 5250 | 6440 | |||
| HD 143358 | 196 | 215 | 9 | a | G1 / G2V | 3 | 5945 / 5860 | 5900 | ||||
| HD 143810 | 66 | 67 | 6 | a | F5/6 V | 5 | 6440 / 6360 | 9.25 | G8 | 5520 | 6400 | |
| HD 144393 | 7 | a | F7/8 V | 4 | 6280 / 6200 | 13.8 | G2 | 5860 | 6240 | |||
| HD 144726 | 29 | 36 | 5 | a | F5 V | 5 | 6440 | 6440 | ||||
| HD 144732 | 178 | 195 | 9 | a | G0 V / G0 | 3 / 6 | 6030 | 27.1 | G2 | 5860 | 6030 | |
| HD 145169 | 51 | 46 | 10 | a | G3 V | 5 | 5830 | 13.5 | G2 | 5945 | 5830 | |
| HD 145551 | 26 | 25 | 6 | a | F5/6 V | 5 | 6440 / 6360 | 9.17 | G8.5 | 5465 | 6400 | |
| HD 148982 | 181 | 216 | 8 | a | F8 / G0 | 3 | 6200 / 6030 | 6115 | ||||
| HD 154922 | 12† | 1 | a | A7 III | 4 | 7850 | 7850 | |||||
| HIP 75685 | 99 | 99 | 11 | a | G6 | 1 | 5700 | 9.05 | G8.5 | 5465 | 5700 | |
| HIP 79354 | 38 | 41 | 8 | a | F8 | 1 | 6200 | 2.87 | K1 | 5080 | 6200 | |
| RHS 48 | 157 | 153 | 15 | e* | K2 | 1 | 4900 | 1.77 | K2 | 4900 | 4900 | |
| TYC 0376-0769-1 | 12 | 21 | a | |||||||||
| TYC 0909-0125-1 | 53 | 54 | 14 | a | 4.19 | K0.5 | 5165 | 5165 | ||||
| TYC 0937-0754-1 | 99 | 97 | 16 | c | 1.89 | K2.5 | 4815 | 4815 | ||||
| TYC 0976-1617-1 | 3 | a | A9 V | 5 | 7390 | 7390 | ||||||
| TYC 5003-0138-1 | 79 | 79 | 16 | e*,p | 1.85 | K2.5 | 4815 | 4815 | ||||
| TYC 5022-0263-1 | o | |||||||||||
| TYC 5668-0365-1 | 61 | 70 | e | |||||||||
| TYC 6141-0525-1 | a | |||||||||||
| TYC 6215-0184-1 | 49 | 52 | 15 | e* | K2IVe | 2 | 4900 | 4900 |
Note. — We report here two Li 6707 measurements- “Integ.” in column 3 refers to direct integration over the line profile, and “Gfit” in column 4 indicates the result of fitting a Gaussian to the absorption feature. In column 5, we also report contamination (denoted “Ctmn.”) of the Li I line; see § 3.2 for description of its derivation. Blended line; result indicates Gaussian feature fit to Li I in deblending. denotes cases in which the line ratio could not be measured from the spectrum either due to extreme rotational broadening or the lack of presence of either or both lines in question. ⋆ Effective temperature determined via interpolation of dereddened color over the color-effective temperature relationship of Kenyon & Hartmann (1995), see Fig. 2.
| Plot | Object Name | Measured vr | Predicted vr | Comovement | Distance | Predicted vr | Comovement | Distance | |||
|---|---|---|---|---|---|---|---|---|---|---|---|
| ID | [km s-1] | [km s-1] | [km s-1] | [mas yr-1] | Probability | [pc] | [km s-1] | [mas yr-1] | Probability | [pc] | |
| Upper Sco Velocity Model | UCL Velocity Model | ||||||||||
| A | HD 141569 | -65 | -9.4 | -4.9 1.1 | 15.5 | 127 11 | -8.1 | -0.7 1.1 | 95.4 | 148 11 | |
| 1 | TYC 6242-0104-1 | 14 | -7.51.9 | -7.5 | -8.4 3.6 | 9.0 | 228 59 | -7.5 | -5.1 3.7 | 41.7 | 238 56 |
| 2 | TYC 6191-0552-1 | 10 | 3.33.0 | -6.1 | -4.2 3.4 | 56.4 | 151 25 | -4.7 | 0.0 3.4 | 100.0 | 171 26 |
| 3 | TYC 6234-1287-1 | 22 | -5.81.9 | -8.7 | -1.7 2.6 | 92.0 | 87 9 | -8.8 | 6.5 2.6 | 22.7 | 101 9 |
| 4 | TYC 7312-0236-1 | 24 | 4.71.7 | -0.7 | -6.3 3.3 | 26.2 | 140 19 | 1.4 | -1.8 3.3 | 88.7 | 152 20 |
| 5 | TYC 7327-0689-1 | 16 | -0.71.7 | -1.8 | -4.0 3.2 | 61.3 | 118 14 | 0.0 | 1.6 3.2 | 91.8 | 130 15 |
| 6 | TYC 6781-0415-1 | 29 | -3.02.1 | -3.4 | -2.6 2.6 | 77.8 | 109 11 | -1.7 | 3.1 2.6 | 65.8 | 123 12 |
| 7 | TYC 6803-0897-1 | 22 | -4.21.9 | -4.3 | -4.3 2.5 | 46.8 | 120 13 | -3.3 | 1.5 2.5 | 89.3 | 134 13 |
| 8 | TYC 6214-2384-1 | 15 | -3.31.4 | -5.5 | -6.8 3.5 | 27.8 | 121 17 | -4.4 | -1.2 3.6 | 95.6 | 134 18 |
| 9 | TYC 6806-0888-1 | 43 | -2.21.8 | -3.7 | -2.2 3.0 | 84.6 | 127 15 | -2.7 | 3.3 2.9 | 64.6 | 144 16 |
| 10 | BD 04 3405B‡ | 39 | -14.12.2 | -13.9 | -0.6 1.5 | 96.2 | 169 23 | -14.3 | 3.3 1.6 | 29.2 | 207 27 |
| 11 | HD 144713 | 70 | 0.64.4 | -4.4 | -1.9 1.7 | 72.7 | 163 16 | -3.1 | 2.1 1.7 | 64.0 | 184 17 |
| 12 | HD 153439 | 56 | -4.31.6 | -5.0 | 1.4 1.6 | 88.3 | 130 12 | -4.5 | 6.8 1.6 | 2.0 | 151 13 |
| 13 | HD 148396 | 36 | -0.22.1 | -3.4 | -0.9 2.4 | 94.4 | 231 37 | -2.4 | 2.1 2.4 | 72.6 | 261 41 |
| 14 | TYC 7334-0429-1 | 27 | -4.31.5 | -2.2 | -5.2 2.2 | 25.3 | 129 13 | -0.8 | 0.1 2.2 | 99.9 | 142 14 |
| 15 | TYC 6817-1757-1 | 11 | 8.41.9 | -4.8 | -7.4 2.8 | 3.8 | 379 99 | -4.1 | -5.4 2.7 | 16.5 | 382 90 |
| 16 | HD 157310 | 70 | -22.42.3 | -13.9 | -1.6 1.5 | 74.1 | 204 28 | -14.3 | 1.7 1.5 | 67.7 | 245 32 |
| 17 | HD 142016 | -17.82.3 | -2.3 | -6.2 1.2 | 22.6 | 85 7 | -0.7 | 1.7 1.2 | 87.3 | 94 6 | |
| 18 | CD-25 11942 | 53 | -6.51.5 | -5.7 | -2.1 2.0 | 78.0 | 127 12 | -5.4 | 3.6 2.0 | 43.4 | 144 13 |
| 19 | 2MASS J17215666-2010498 | 10 | -7.31.9 | -7.5 | -8.4 3.6 | 9.0 | 228 59 | -7.5 | -5.1 3.7 | 41.7 | 238 56 |
| 20 | TYC 6790-1227-1 | 33 | 2.02.0 | -2.6 | -6.1 2.7 | 23.7 | 121 13 | -1.0 | -0.7 2.6 | 98.1 | 133 13 |
| 21 | TYC 7346-1182-1 | 28 | 3.71.7 | -3.6 | -4.8 2.3 | 31.8 | 129 13 | -2.8 | 0.7 2.3 | 97.1 | 143 14 |
Note. — Very broadened, featureless spectra. Radial velocity derived via centroid measurement of the H line. Uncertainty reflects an assumed centroid measurement error of 0.05Å. For a full discussion of error analysis, see 3.3.


| Plot | Object | Spatial | Velocity Model / | US/UCL Vr | Determined |
|---|---|---|---|---|---|
| ID | Name | Match | Probability | Prediction | Membership |
| 1 | TYC 6242-0104-1 | ? | US / 9% | 1/1 | I |
| 2 | TYC 6191-0552 | US | US / 56% | no/3 | US |
| 3 | TYC 6234-1287-1 | ? | US / 92% | 2/2 | US? |
| 4 | TYC 7312-0236-1 | UCL | UCL / 89% | no/2 | UCL |
| 5 | TYC 7327-0689-1 | UCL | UCL / 92% | 1/1 | UCL |
| 6 | TYC 6781-0415-1 | US | US / 78% | 1/1 | US |
| 7 | TYC 6803-0897-1 | US | US / 47% | 1/1 | US |
| 8 | TYC 6214-2384-1 | US | US / 28% | 2/1 | US |
| 9 | TYC 6806-0888-1 | US | US / 85% | 1/1 | US |
| 10 | BD 04 3405B | ? | US / 96% | 1/1 | I |
| 11 | HD 144713 | US | US / 73% | 2/1 | US |
| 12 | HD 153439 | ? | US / 88% | 1/1 | US? |
| 13 | HD 148396 | US | US / 94% | 2/2 | US |
| 14 | TYC 7334-0429-1 | UCL | UCL / 100% | 2/3 | UCL |
| 15 | TYC 6817-1757-1 | US | US / 4% | no/no | I |
| 16 | HD 157310 | ? | US / 78% | no/no | I |
| 17 | HD 142016 | UCL | UCL / 87% | no/no | UCL |
| 18 | CD-25 11942 | ? | US / 78% | 2/2 | US? |
| 19 | 2MASS J17215666-2010498 | ? | US / 9% | 1/1 | I |
| 20 | TYC 6790-1227-1 | UCL | UCL / 98% | 3/2 | UCL |
| 21 | TYC 7346-1182-1 | US | US / 32% | no/no | US |
Note. — In column three, we note with which moving group each object is spatially consistent. Column four summarizes the results of velocity vector modeling and shows the vector with which each object had the highest comovement probability. In column five, we report the models which predicted radial velocities within 2 of our measured values, and in the rightmost column we comment on membership; I denotes “indeterminate”. See text ( 5) for further discussion of our final membership determinations.
References
- Baraffe et al. (1998) Baraffe, I., Chabrier, G., Allard, F., & Hauschildt, P. H. 1998, A&A, 337, 403
- Basri & Batalha (1990) Basri, G., & Batalha, C. 1990, ApJ, 363, 654
- Bessell (1991) Bessell, M. S. 1991, AJ, 101, 662
- Bessell & Brett (1988) Bessell, M. S., & Brett, J. M. 1988, PASP, 100, 1134
- Dame et al. (1987) Dame, T. M., et al. 1987, ApJ, 322, 706
- D’Antona & Mazzitelli (1997) D’Antona, F., & Mazzitelli, I. 1997, Memorie della Societa Astronomica Italiana, 68, 807
- de Bruijne (1999) de Bruijne, J. H. J. 1999, MNRAS, 306, 381
- de Bruijne et al. (2001) de Bruijne, J. H. J., Hoogerwerf, R., & de Zeeuw, P. T. 2001, A&A, 367, 111
- de Zeeuw et al. (1999) de Zeeuw, P. T., Hoogerwerf, R., de Bruijne, J. H. J., Brown, A. G. A., & Blaauw, A. 1999, AJ, 117, 354
- Høg et al. (2000) Høg, E., et al. 2000, A&A, 355, L27
- Houk (1982) Houk, N. 1982, in Michigan Spectral Survey, Ann Arbor, Dep. Astron., Univ. Michigan, 3 (1982) (Ann Arbor : Dept. of Astronomy, University of Michigan), 0–+
- Houk & Smith-Moore (1988) Houk, N., & Smith-Moore, M. 1988, in Michigan Spectral Survey, Ann Arbor, Dept. of Astronomy, Univ. Michigan (Vol. 4) (1988) (Ann Arbor : Dept. of Astronomy, University of Michigan), 0–+
- Houk & Swift (1999) Houk, N., & Swift, C. 1999, Michigan catalogue of two-dimensional spectral types for the HD Stars ; vol. 5 (Ann Arbor : Dept. of Astronomy, University of Michigan)
- Johnson & Soderblom (1987) Johnson, D. R. H., & Soderblom, D. R. 1987, AJ, 93, 864
- Kalberla et al. (2005) Kalberla, P. M. W., Burton, W. B., Hartmann, D., Arnal, E. M., Bajaja, E., Morras, R., & Pöppel, W. G. L. 2005, A&A, 440, 775
- Kenyon & Hartmann (1995) Kenyon, S. J., & Hartmann, L. 1995, ApJS, 101, 117
- Li (2005) Li, J. Z. 2005, Ap&SS, 298, 525
- Madsen et al. (2002) Madsen, S., Dravins, D., & Lindegren, L. 2002, A&A, 381, 446
- Mamajek (2005) Mamajek, E. E. 2005, ApJ, 634, 1385
- Mamajek (2008) ——. 2008, Astronomische Nachrichten, 329, 10
- Mamajek et al. (2002) Mamajek, E. E., Meyer, M. R., & Liebert, J. 2002, AJ, 124, 1670
- Merín et al. (2004) Merín, B., et al. 2004, A&A, 419, 301
- Meyer et al. (2008) Meyer, M. R., et al. 2008, ApJ, 673, L181
- Ochsenbein et al. (2000) Ochsenbein, F., Bauer, P., & Marcout, J. 2000, A&AS, 143, 23
- Perryman & ESA (1997) Perryman, M. A. C., & ESA, eds. 1997, ESA Special Publication, Vol. 1200, The HIPPARCOS and TYCHO catalogues. Astrometric and photometric star catalogues derived from the ESA HIPPARCOS Space Astrometry Mission
- Preibisch et al. (2002) Preibisch, T., Brown, A. G. A., Bridges, T., Guenther, E., & Zinnecker, H. 2002, AJ, 124, 404
- Randich et al. (1997) Randich, S., Aharpour, N., Pallavicini, R., Prosser, C. F., & Stauffer, J. R. 1997, A&A, 323, 86
- Randich et al. (2001) Randich, S., Pallavicini, R., Meola, G., Stauffer, J., & Balachandran, S. C. 2001, A&A, 372, 862
- Robichon et al. (1999) Robichon, N., Arenou, F., Mermilliod, J.-C., & Turon, C. 1999, VizieR Online Data Catalog, 334, 50471
- Rossiter (1943) Rossiter, R. A. 1943, Publications of Michigan Observatory, 8, 133
- Simon et al. (2000) Simon, M., Dutrey, A., & Guilloteau, S. 2000, ApJ, 545, 1034
- Skrutskie et al. (2006) Skrutskie, M. F., et al. 2006, AJ, 131, 1163
- Soderblom et al. (1993) Soderblom, D. R., Jones, B. F., Balachandran, S., Stauffer, J. R., Duncan, D. K., Fedele, S. B., & Hudon, J. D. 1993, AJ, 106, 1059
- Stassun et al. (2004) Stassun, K. G., Mathieu, R. D., Vaz, L. P. R., Stroud, N., & Vrba, F. J. 2004, ApJS, 151, 357
- Steffen et al. (2001) Steffen, A. T., et al. 2001, AJ, 122, 997
- Torres et al. (2006) Torres, C. A. O., Quast, G. R., da Silva, L., de La, R. R., Melo, C. H. F., & Sterzik, M. 2006, VizieR Online Data Catalog, 346, 695
- van Leeuwen (2007) van Leeuwen, F. 2007, Hipparcos, the New Reduction of the Raw Data, Vol. 20 (Cambridge University, Cambridge, UK Series: Astrophysics and Space Science Library)
- Voges et al. (1999) Voges, W., et al. 1999, A&A, 349, 389
- Voges et al. (2000) ——. 2000, IAU Circ., 7432, 1
- Webb et al. (1999) Webb, R. A., Zuckerman, B., Platais, I., Patience, J., White, R. J., Schwartz, M. J., & McCarthy, C. 1999, ApJ, 512, L63
- Weinberger et al. (1999) Weinberger, A. J., Becklin, E. E., Schneider, G., Smith, B. A., Lowrance, P. J., Silverstone, M. D., Zuckerman, B., & Terrile, R. J. 1999, ApJ, 525, L53
- Weinberger et al. (2000) Weinberger, A. J., Rich, R. M., Becklin, E. E., Zuckerman, B., & Matthews, K. 2000, ApJ, 544, 937
- Zacharias et al. (2004) Zacharias, N., Urban, S. E., Zacharias, M. I., Wycoff, G. L., Hall, D. M., Monet, D. G., & Rafferty, T. J. 2004, AJ, 127, 3043
- Zuckerman & Song (2004) Zuckerman, B., & Song, I. 2004, ARA&A, 42, 685
- Zuckerman et al. (2001) Zuckerman, B., Song, I., Bessell, M. S., & Webb, R. A. 2001, ApJ, 562, L87