Evidence for a Photoevaporated Circumbinary Disk in Orion11affiliation: Based on observations made with the NASA/ESA Hubble Space Telescope, obtained at the Space Telescope Science Institute, which is operated by the Association of Universities for Research in Astronomy, Inc., under NASA contract NAS 5-26555. These observations are associated with program 10246.
Abstract
We have found a photoevaporated disk in the Orion Nebula that includes a wide binary. HST/ACS observations of the proplyd 124-132 show two point-like sources separated by , or about 60 AU at the distance of Orion. The two sources have nearly identical and magnitudes. We analyze the brightest component, Source N, comparing the observed magnitudes with those predicted using a 1 Myr Baraffe/NEXTGEN isochrone with different accretion luminosities and extinctions. We find that a low mass () brown dwarf 1 Myr old with mass accretion rate , typical for objects of this mass, and about 2 magnitudes of visual extinction provides the best fit to the data. This is the first observation of a circumbinary disk undergoing photoevaporation and, if confirmed by spectroscopic observations, the first direct detection of a wide substellar pair still accreting and enshrouded in its circumbinary disk.
1 Introduction and Observations
We report on the discovery of a circumbinary disk seen in silhouette against the bright nebular background of the Orion Nebula. Using multicolor observations taken with the Hubble Space Telescope as part of the HST Treasury Program on the Orion Nebula Cluster, we show that source 124-132, a photoevaporated disk north of the Trapezium previously imaged in H (Smith et al., 2005), harbors a binary.
Binaries represent a typical product of the gravitational collapse of cores with high angular momentum. In fact, the majority of stars in star-forming regions are in binary or multiple systems (see Duchene 1999; Monin et al. 2007; and for a review Mathieu 2000 and references therein). Also the ONC contains a large number of binary stars (Prosser et al., 1994; Padgett et al., 1997; Petr et al., 1998; Köhler et al., 2006; Reipurth et al., 2007), although the current counts indicate that the binary frequency, especially at the low-mass end, is lower by a factor 2 to 5 than in star-forming T Associations like Taurus-Auriga (Köhler et al., 2006; Reipurth et al., 2007). Whether the relative paucity of binary systems in the ONC is due to the initial conditions of the cloud or to a “feedback” effect, like the ejection of binary companions in the cluster core caused by close dynamic encounters, is still a subject of debate.
There can be three disks in a young binary system: two circumstellar disks and a circumbinary one (Lin & Papaloizou, 1993; Artymowicz & Lubow, 1994; Bate & Bonnell, 1997), with a complex geometry due to the potential variety of alignments between the disks and orbital planes (Monin et al., 2007), and interacting through transfer of energy and angular momentum (Günther & Kley, 2002). Disks have been detected around many spectroscopic binaries. Direct imaging of disks around wide, well separated binary systems, either circumstellar or circumbinary, is much rarer, the two most notable examples being the circumbinary disks around GG Tau (Dutrey et al., 1994) and UY Aur (Duvert et al., 1998).
The data presented here are part of the large dataset (520 images) of ACS exposures obtained for the HST Treasury Program on the Orion Nebula Cluster (GO-10246). We mapped with ACS/WFC an area of about 450 square arcmin nearly centered on the Trapezium Cluster in five filters: F435W (Johnson , 420s); F555W (Johnson , 385s); F685N (H+[N II] , 340s); F775W (Cousins , 385s); and F850LP (-band, 385s). Due to the adopted dithering strategy, most of the field has been exposed two times so the total integration time is typically twice that listed. The drizzled ACS images have been visually inspected and a master catalog of 219 circumstellar disks has been compiled (Ricci et al., 2008). Figure 1 is extracted from this last paper, which also provides the fits files in electronic form. Further details on the HST Treasury Program observing strategy and data products will be given elsewhere (Robberto et al. 2008, in preparation).
2 Results
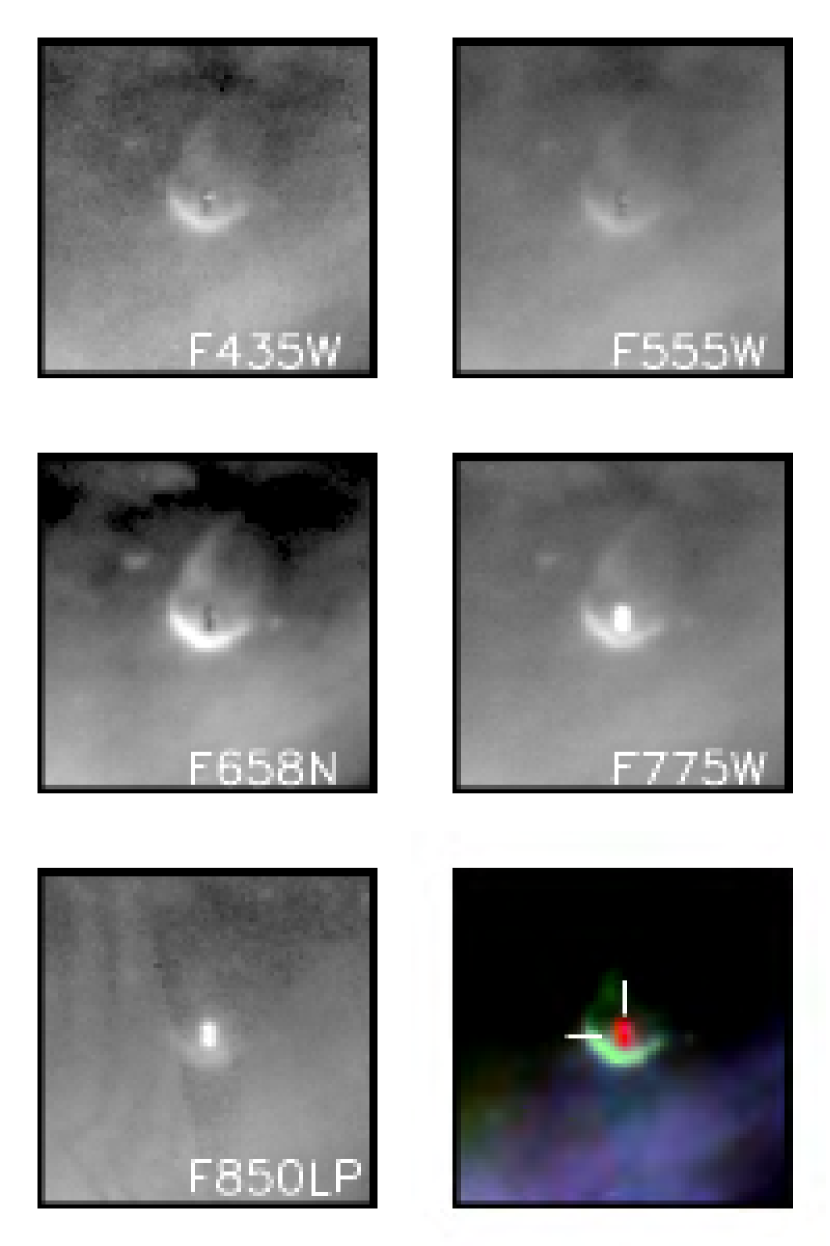
Figure 1 shows ACS/WFC images of source 124-132. Smith et al. (2005) have already illustrated the H morphology of this object, a bright proplyd with a well resolved dark disk nearly perpendicular to the vertex of the ionization front. From their H analysis, they estimate a disk tilt angle of . The disk shows some point-like H emission on the west (right) side, which they interpret as either emission from a bipolar reflection nebula or a microjet perpendicular to the major disk axis.
A more careful look at the H image shows that the point-like source is not centered on the dark disk axis, but shifted approximately 2 pixels () to the north, away from the ionization front. Since the brightness of the ionization front does not allow us to trace the full extension of the disk to the south, this asymmetry is probably real. The situation becomes clearer when our other images are considered. At shorter wavelengths (F435W and F555W), the point-like source remains visible to the west of the disk axes, suggesting that the silhouette disk is slightly tilted with the western face toward us. More interestingly, at longer wavelengths (F775W and F850LP), two point-like sources appear well resolved along the disk axes.
In Figure 2 we plot the counts measured through the central part of the disk (column 50 of the images in Fig. 1). In order to remove the contribution of the sky background and of the proplyd we have subtracted from each cut the counts measured two pixels to the west (column 52). Figure 2 clearly shows the two well resolved point sources appearing at the same position in the F775W and F850LP filters. The F658N cut reveals the extent of the disk and shows that the disk is darker and possibly wider at the location of Source S. For the F658N filter we have also added a line, corresponding to column 51, to show the location of the H source discussed by Smith et al. (2005). Source N remains visible in the F555W and F435W filters, whereas Source S is perhaps barely detectable only in the F555W filter. In Figure 2 we also indicate the limits of the disk, showing that the disk extends further on the northern side. This may be due to the presence of the ionized rim, which prevents tracking the disk in the vicinity of the ionization front. In any case, we estimate a disk diameter of approximately 10 pixels, i.e., 05 ( AU), whereas the projected separation of the two stars is 3 pixels, corresponding to 60 AU.
In Table 1 we present the magnitudes of the two sources measured by integrating the counts in a 3 pixel diameter aperture; the sky has been measured at a close offset position free from ionized emission. We have applied the ACS zero points (Vega photometric system) and aperture corrections from Sirianni et al. (2005), averaging the encircled energy reported in Table 3 of Sirianni et al. for aperture radii of 1 and 2 pixels. Being HST diffraction limited, the PSF in the widest filters depends on the source color. Following Sirianni et al. (2005), we adjust the aperture correction in the F850LP filter to account for the extremely red colors of our sources. By repeating the measures with subpixel shifts of the centroid, we estimate an uncertainty of approximately 0.1 mag in the F775W and F850LP passbands, and 0.2 mag in the bluer filters due to the faintness of the source and the highly non-uniform background. The most striking result is the similarity between the magnitudes and colors of the two sources, with both of them having F775WF850LP = 1.5.
3 Discussion
Our images reveal the presence of a dark silhouette disk harboring two faint, similar objects. In the F775W and F850LP filters the sources appear clearly point-like, well separated, and without any evidence of bipolar extended emission from either sides of the disk, as normally observed when edge-on disks obscure their central stars (Luhman et al., 2007, and references therein). We will thus assume that we are seeing the reddened central stars rather than their diffuse light scattered by the disk surface.
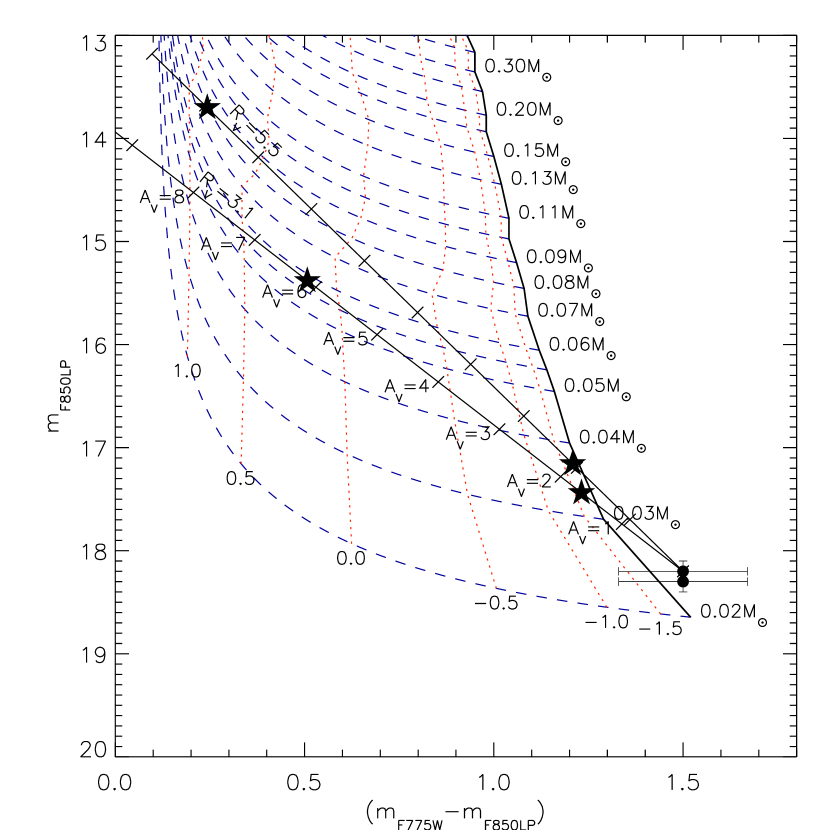
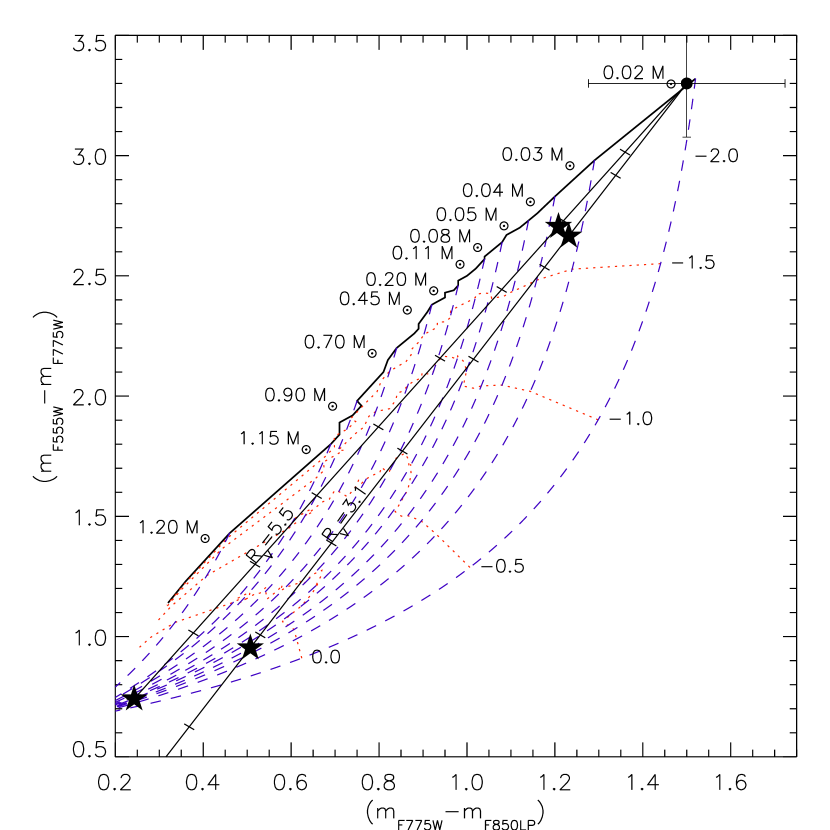
To constrain the nature of the two sources, we plot their position in a color-magnitude diagram (Fig. 3) and (for Source N only) in a color-color diagram (Fig. 4) with respect to the 1 Myr PMS isochrone of Baraffe et al. (1998), calculated in our passbands using the NextGenII synthetic atmosphere models (Hauschildt et al., 1999). We show the stellar population of the ONC, we also show the displacement from the isochrone caused by extinction and mass accretion, both combined with the synthetic stellar spectra before convolution with the filter passbands. For the extinction we use both the standard reddening law and the reddening law, considered more appropriate for the Orion Nebula (Baade & Minkowski, 1937; Johnson, 1967). The accretion spectrum is reproduced following the Calvet & Gullbring (1998) recipe, combining of a K black body, accounting for the optically thick emission from the photospheric region heated by the shock of accreting material, with of optically thin emission from a dense slab ( cm-3) of photoionized gas also at K, accounting for the pre-shock region. The accretion luminosity, , and the stellar bolometric luminosity, , are both calculated integrating the model spectra, with finally multiplied by a normalizing factor. This approximate treatment is adequate for our purposes, as we are interested in the intensity in broad-band filters rather than in the details of the true accretion spectrum.
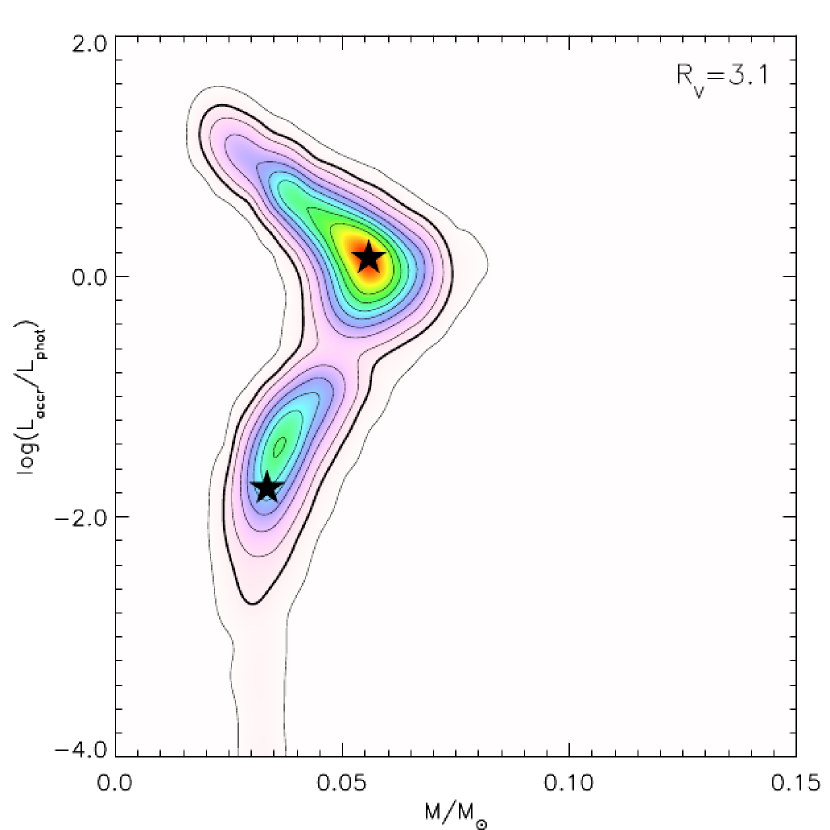
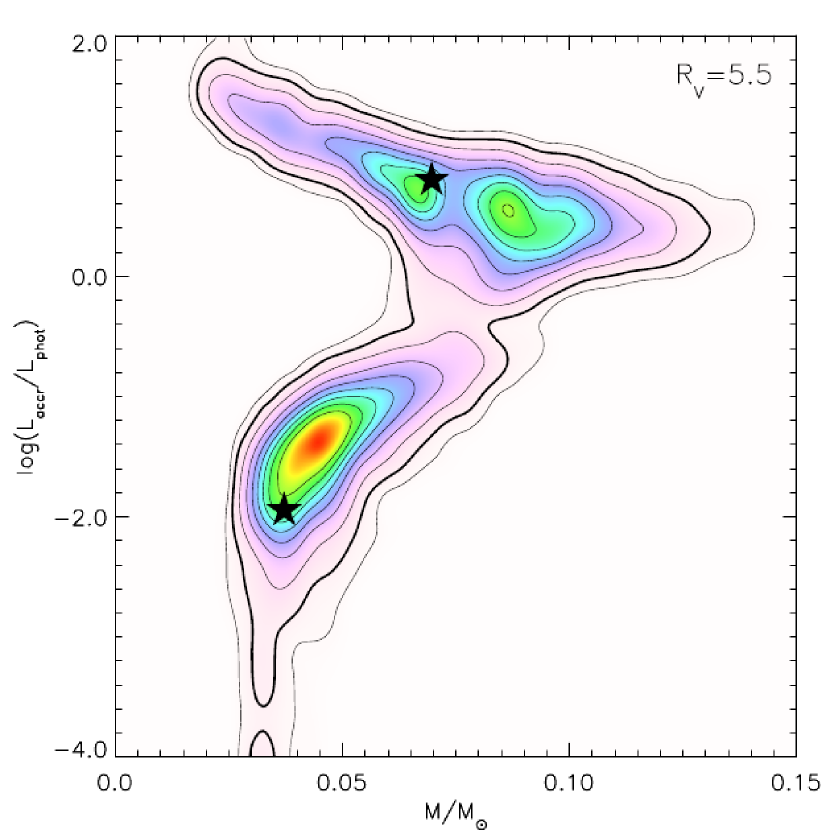
Figures 3 and 4 show that the observed magnitudes of Source N can be reproduced by different combinations of , and stellar mass. To find the best combinations of parameters, we calculate a large 3-d grid of models covering the full range of viable , and stellar mass, derive the synthetic photometry and search for the best match with the data. The results are summarized in Table 2 and marked as stars in Figures 3 and 4. It turns out that for each reddening law, there are typically two intersection points. For each reddening law, the two intersections provide combinations of lower and higher mass, extinction and accretion, (the low and high solutions). All four solutions place Source N in the brown dwarf regime. To test the robustness of this result and to find the optimal solution, we have assumed that the uncertainties are dominated by photometric errors and performed a Monte Carlo simulation. We generated a set of 10,000 trial stars populating a gaussian error distribution for the three magnitudes; we then iterated our procedure to find the corresponding mass, accretion luminosity and extinction. Figure 5 shows the results for the two choices of . The two areas at the top and bottom of each figure correspond to the high and low solutions, respectively. The height of the peaks shows that the high solution is more compatible with , vice versa if . Only if the strongly degenerate high solution may lead to masses above the hydrogen burning limit ().
Another clue to the nature of the sources may come from a comparison of our estimated mass accretion rate with the values normally found for similar stars. Using Eq. (2) of Muzerolle et al. (2003) with the stellar parameters from our Baraffe/NEXTGEN models, we derive for the values reported in Table 2. A comparison with Figure 8 of Muzerolle et al. (2003), or Figure 2 of Mohanty et al. (2005), shows that only our low solutions provide mass accretion rates similar to those found in low-mass BDs, whereas the high solutions give values in excess by 2 orders of magnitudes. If we exclude the high values on this basis, the most consistent solution for Source N is the low case, corresponding to a brown-dwarf accreting at a rather standard yr-1, with about and , indicative of grains larger than those typically found in the interstellar medium. Similar conclusions should hold for Source S, given the nearly identical and magnitudes. Even if IR spectroscopy will be needed to firmly establish the nature of these objects, the possibility that the two sources have sub-stellar mass appears quite robust. If confirmed, this would be the first direct observation of a young brown-dwarf binary still accreting in its circumbinary disk.
Whereas our images shows the presence of a large-scale circumbinary disk, the evidence for mass accretion points to to the presence of at least one circumstellar disk. Theory provides a consistent scenario, predicting that circumstellar and circumbinary disks emerge as the mature outcome of the evolution of the original circumstellar disk in which the binary system formed (Günther & Kley, 2002). Due to the exchange of angular momentum from the binary to the disk, an inner gap develops between the inner and outer disk regions. Material can flow through the gap along spiral arms, feeding the circumstellar disks and therefore sustaining mass accretion into the central stars. A detailed comparison of our system with the extant theoretical models is hindered, however, by the fact that our circumbinary disk is being photoevaporated, the first time such a phenomenon is observed. The influence of UV flux from an external source on a circumstellar disk has been studied only for single stars by Robberto et al. (2002), who have shown that the extra heating of a disk face produces an increase of the disk flaring angle, leading to photoevaporation and possibly a warping of the system. This may explain why Source S remains undetected in our bluest filters: the southern side of the disk is the one more directly exposed to the UV flux and the stronger photoevaporation may locally increase the optical depth on this side. Assuming the sources are identical, a line-of-sight difference would bring Source S below our detection limit at the shortest wavelengths while being compatible with the magnitudes observed in the red filters.
References
- Artymowicz et al. (1991) Artymowicz, P., Clarke, C. J., Lubow, S. H., & Pringle, J. E. 1991, ApJ, 370, L35
- Artymowicz & Lubow (1994) Artymowicz, P., & Lubow, S. H. 1994, ApJ, 421, 651
- Baade & Minkowski (1937) Baade, W., & Minkowski, R. 1937, ApJ, 86, 123
- Baraffe et al. (1998) Baraffe, I., Chabrier, G., Allard, F., & Hauschildt, P. H. 1998, A&A, 337, 403
- Bate & Bonnell (1997) Bate, M. R., & Bonnell, I. A. 1997, MNRAS, 285, 33
- Calvet & Gullbring (1998) Calvet, N. & Gullbring, E. 1998, ApJ, 509, 802
- Duchene (1999) Duchêne, G. 1999, A&A, 341, 547
- Dutrey et al. (1994) Dutrey, A., Guilloteau, S., & Simon, M. 1994, A&A, 286, 149
- Duvert et al. (1998) Duvert, G., Dutrey, A., Guilloteau, S., Menard, F., Schuster, K., Prato, L., & Simon, M. 1998, A&A, 332, 867
- Günther & Kley (2002) Günther, R., & Kley, W. 2002, A&A, 387, 550
- Hauschildt et al. (1999) Hauschildt, P. H., Allard, F., Baron, E. 1999, ApJ, 512, 377
- Johnson (1967) Johnson, H. L. 1967, ApJ, 150, L39
- Köhler et al. (2006) Köhler, R., Petr-Gotzens, M. G., McCaughrean, M. J., Bouvier, J., Duchêne, G., Quirrenbach, A., & Zinnnecker, H. 2006, A&A, 458, 461
- Lin & Papaloizou (1993) Lin, D. N. C., & Papaloizou, J. C. B. 1993, Protostars and Planets III, 749
- Luhman (2004) Luhman, K. L. 2004, ApJ, 614, 398
- Luhman et al. (2007) Luhman, K. L., et al. 2007, ApJ, 666, 1219
- Mathieu (2000) Mathieu, R. D. 2000, “Pre-main-sequence Binary Stars” in Encyclopedia of Astronomy and Astrophysics, Edited by Paul Murdin, article 2384. Bristol: Institute of Physics Publishing, 2001
- Menten et al. (2007) Menten, K. M., Reid, M. J., Forbrich, J., & Brunthaler, A. 2007, A&A, 474, 515
- Mohanty et al. (2005) Mohanty, S., Basri, G., & Jayawardhana R. 2005, Astron. Nachr. 326, 891
- Monin et al. (2007) Monin, J.-L., Clarke, C. J., Prato, L., & McCabe, C. 2007, Protostars and Planets V, 395
- Muzerolle et al. (2003) Muzerolle, J., Hillenbrand, L., Calvet, N., Briceño, C., Hartmann, L. 2003, ApJ, 592, 266
- Padgett et al. (1997) Padgett, D. L., Strom, S. E., & Ghez, A. 1997, ApJ, 477, 705
- Petr et al. (1998) Petr, M. G., Coude Du Foresto, V., Beckwith, S. V. W., Richichi, A., & McCaughrean, M. J. 1998, ApJ, 500, 825
- Prosser et al. (1994) Prosser, C. F., Stauffer, J. R., Hartmann, L., Soderblom, D. R., Jones, B. F., Werner, M. W., & McCaughrean, M. J. 1994, ApJ, 421, 517
- Reipurth et al. (2007) Reipurth, B., Guimaraẽs, M. M., Connelley, M. S., & Bally, J. 2007, AJ, 134, 2272
- Ricci et al. (2008) Ricci, L., Robberto, M., & Soderblom, D. R., 2008, AJ, in press
- Robberto et al. (2004) Robberto, M., Song, J., Mora Carrillo, G., Beckwith, S. V. W., Makidon, R. B., & Panagia, N. 2004, ApJ, 606, 952
- Robberto et al. (2002) Robberto, M., Beckwith, S. V. W., & Panagia, N. 2002, ApJ, 578, 897
- Sirianni et al. (2005) Sirianni, M., et al. 2005, PASP, 117, 1049
- Smith et al. (2005) Smith, N., Bally, J., Licht, D., & Walawender, J. 2005, AJ, 129, 382
| Filter | Source N | Source S |
|---|---|---|
| F435W | 23.3 | – |
| F555W | 23.0 | 23.5 |
| F658N | 19.2 | – |
| F775W | 19.7 | 19.8 |
| F850LP | 18.2 | 18.3 |
Note. — Magnitudes in Vega photometric system.
| case | |||||
|---|---|---|---|---|---|
| () | ( yr-1) | ||||
| low | 1.76 | ||||
| 1.95 | |||||
| high | |||||