Luminous Blue Variable Stars In The Two Extremely Metal-Deficient Blue Compact Dwarf Galaxies DDO 68 and PHL 293B
Abstract
We present photometric and spectroscopic observations of two luminous blue variable (LBV) stars in two extremely metal-deficient blue compact dwarf (BCD) galaxies, DDO 68 with 12+logO/H = 7.15 and PHL 293B with 12+logO/H = 7.72. These two BCDs are the lowest-metallicity galaxies where LBV stars have been detected, allowing to study the LBV phenomenon in the extremely low metallicity regime, and shedding light of the evolution of the first generation of massive stars born from primordial gas. We find that the strong outburst of the LBV star in DDO 68 occurred sometime between February 2007 and January 2008. We have compared the properties of the broad line emission in low-metallicity LBVs with those in higher metallicity LBVs. We find that, for the LBV star in DDO 68, broad emission with a P Cygni profile is seen in both H and He i emission lines. On the other hand, for the LBV star in PHL 293B, P Cygni profiles are detected only in H lines. For both LBVs, no heavy element emission line such as Fe ii was detected. The H luminosities of LBV stars in both galaxies are comparable to the one obtained for the LBV star in NGC 2363 (Mrk 71) which has a higher metallicity 12+logO/H = 7.89. On the other hand, the terminal velocities of the stellar winds in both low-metallicity LBVs are high, 800 km s-1, a factor of 4 higher than the terminal velocities of the winds in high-metallicity LBVs. This suggests that stellar winds at low metallicity are driven by a different mechanism than the one operating in high-metallicity winds.
1 INTRODUCTION
The most massive stars evolve on very short timescales of a few million years compared to the very long time scales of billion years of solar-type stars. Thus, important evolutionary events in the life of very massive stars such as core-collapse supernovae or giant eruptions of luminous blue variables (LBVs; Conti, 1984) are hard to catch and study. To maximize the probability of catching such an event, it is best to observe objects known to contain many massive stars. Blue compact dwarf (BCD) galaxies are ideal laboratories for such studies as they are undergoing intense bursts of star formation and their star-forming regions are known to harbor up to tens of thousands of massive stars (Thuan & Izotov, 2005). Furthermore, mass loss is a critical factor in determining the evolution of a massive star. The mass loss rate depends in turn on the metallicity of the gas, if driven by line opacity. BCDs are also excellent laboratories to test metallicity effects on mass loss as they are metal-deficient, their metallicity ranging from about half to a few percent the Sun’s metallicity (Izotov et al., 2007). Thus BCDs are the only galaxies in the local Universe where low-metallicity massive stars do exist. They are unique objects for studying processes related to massive star formation and evolution and their interaction with the interstellar medium, and for testing models of massive stellar evolution. They are the best local approximations to primordial galaxies.
BCDs have been used to investigate mass loss through observational signatures of stellar winds from massive stars. The prevailing belief is that the efficiencies of stellar winds in massive stars are significantly reduced at low metallicities. However, this conclusion is based mainly on theoretical extrapolations and observations of relatively high-metallicity massive stars in our Galaxy (12 + log O/H 8.7), the Large Magellanic Cloud (12 + log O/H 8.4) and the Small Magellanic Cloud (12 + log O/H 8.1) and some other nearby high-metallicity galaxies. There is growing evidence suggesting that massive stars do have stellar winds, even in the most metal-deficient BCDs known, with oxygen abundances 12 + log O/H 7.6. Thus, Izotov et al. (1997a) and Legrand et al. (1997) discovered a Wolf-Rayet (WR) stellar population in I Zw 18, the most metal-deficient emission-line galaxy known at the time, with oxygen abundance 12+logO/H = 7.17 0.01 (Izotov et al., 1999). Guseva et al. (2000) have shown that the observed ratio of the number of WR stars to the number of O stars in I Zw18 cannot be reproduced by theoretical population synthesis models based on non-rotating stellar evolution models and observational properties of high-metallicity WR stars. To achieve agreement between observations and theory, Crowther & Hadfield (2006) have suggested that WR stars in I Zw 18 have lower emission-line luminosities than their high-metallicity counterparts. Furthermore, Thuan & Izotov (1997) have observed P Cygni profiles for the Si iv 1394, 1403 absorption lines in the spectrum of the emission-line galaxy SBS 0335–052E, one of the most metal-deficient BCD known, with 12 + log O/H = 7.30 0.01 (Izotov et al., 2007). It thus appears that extremely low-metallicity massive stars do possess stellar winds, although the properties of these stellar winds may significantly differ from those of their high-metallicity counterparts.
To find more objects with observational signatures of massive star activity, we have recently assembled a large sample of about 40 emission-line dwarf galaxies which exhibit broad components in their strong emission lines, mainly in H, [O iii] 4959, 5007, and H (Izotov et al., 2007). Except for four objects which appear to contain intermediate-mass black holes (Izotov & Thuan, 2008), the broad emission of all the other objects can be attributed to some evolutionary stage of massive stars and to their interaction with the circumstellar and interstellar medium: WR stars, supernovae, superbubbles or LBV stars. In particular, our attention was drawn to the peculiar spectrum of the BCD PHL 293B SDSS J2230–0006, with an oxygen abundance 12 + log O/H = 7.66 0.04, which shows broad hydrogen emission lines with P Cygni profiles, spectral features that are characteristic of a LBV star. Coincidentally, several months after our finding, Pustilnik et al. (2008b) discovered another bright LBV in the BCD DDO 68. This BCD, with an oxygen abundance 12 + log O/H = 7.14 0.03 is even more metal-deficient than PHL 293B (Izotov & Thuan, 2007). It is the second most metal-deficient star-forming galaxy known, after SBS 0335–052W.
The study of these newly discovered LBV stars in the two very metal-deficient galaxies DDO 68 and PHL 293B is the focus of this paper. Giant eruptions of LBV stars, with a brightening greater than 3 mag, are exceedingly rare. In the Galaxy, although there are some 35 confirmed or candidate LBVs (Clark et al., 2005), only two, Carinae and P Cygni, are known to have undergone such giant eruptions over the last 5 centuries, Carinae between 1837 and 1860, and P Cygni, twice in the 17th century. P Cygni was discovered in 1600 as a naked eye star, and remained bright for many years, before fading and re-appearing in 1655, and then fading again. Typically, LBVs exhibit day-to-day microvariations in brightness of 0.1-0.2 mag, and “normal” irregular variations of 1–2 mag on a timescale of years, in which the spectral type may vary from an early B supergiant at visual minimum to a late B or early A supergiant at visual maximum (e.g. Conti, 1984; Humphreys & Davidson, 1994; Leitherer et al., 1994; Nota et al., 1996; Drissen et al., 1997, 2001; Crowther, 2004; Petit et al., 2006; Walborn et al., 2008). There have been also LBVs observed in the Large Magellanic Cloud and other Local Group galaxies (Massey et al., 2007).
The LBV phase is believed to represent a critical transition in the late evolution of all stars with initial masses greater than about 50 . During this phase, the stars lose sufficiently large amounts of mass in recurrent explosive events, to go from the stage of O stars burning hydrogen on the main-sequence to that of core-helium burning classical WR stars. In the HR diagram, LBVs lie just to the left of the Humphreys-Davidson limit (Humphreys & Davidson, 1994), beyond which no stars are observed. They appear to define the locus of an instability that prevents further redward evolution.
The understanding of the physical processes operating during the LBV phase is thus crucial for modeling massive star evolution. However, the exact mechanism giving rise to a LBV outburst is still unknown, even if many LBVs at solar metallicity have been studied. The situation is worse at low metallicity because the only relatively low-metallicity LBV star that has been observationally investigated in detail is the star V1 in the H ii region NGC 2363 (Mrk 71) of the dwarf cometary galaxy NGC 2366 (Drissen et al., 1997, 2001; Petit et al., 2006), with 12+log O/H = 7.89 (Gonzalez-Delgado et al., 1994; Izotov et al., 1997b). High-quality spectroscopic studies of LBV stars in two more extremely metal-deficient galaxies should help us to better understand how the LBV phase depends on metallicity.
We present here new spectroscopic observations of the LBVs in DDO 68 and PHL 293B and derive their emission line parameters. We also discuss new photometric observations of DDO 68 to better constrain the epoch of the LBV outburst in it. The observations are described in §2. We discuss in §3 the photometric variations of the two LBV stars. We derive the element abundances in the two host galaxies and show how the main properties of the stellar winds in low-metallicity LBVs differ significantly from those in their high-metallicity counterparts. Our conclusions are summarized in §4.
2 OBSERVATIONS
2.1 Imaging
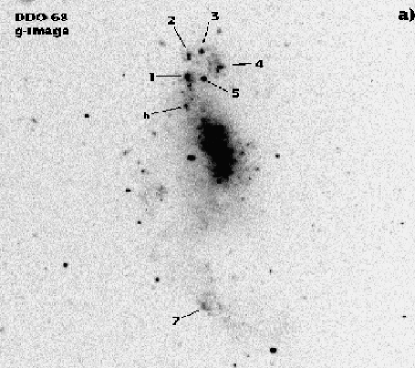
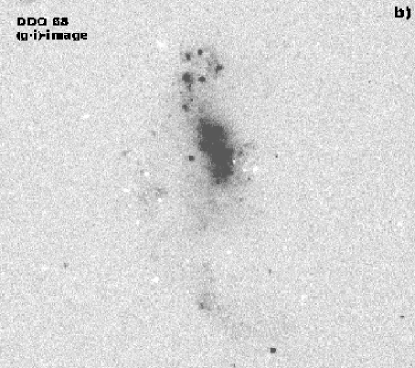
New deep images of DDO 68 were obtained with the SDSS and filters (Fukugita et al., 1996) using the 2.1m telescope at Kitt Peak National Observatory111Kitt Peak National Observatory is operated by the Association of Universities for Research in Astronomy (AURA) under cooperative agreement with the National Science Foundation. on the night 9 February 2007. The details of the observations are shown in Table 1. These observations were compared to the SDSS images of DDO 68 in the same filters obtained on 16 April 2004. The details of these observations are also shown in Table 1. To process the 2.1m KPNO images we have used the standard data reduction procedures in IRAF222IRAF is distributed by National Optical Astronomy Observatory, which is operated by the Association of Universities for Research in Astronomy, Inc., under cooperative agreement with the National Science Foundation., which include bias subtraction and flat-field correction. For photometric calibration, we have used bright stars in the field of SDSS images. The resulting and 2.1m KPNO images of DDO 68 are shown in Fig. 1, with the most prominent H ii regions labeled, following the numbering system of Pustilnik et al. (2005). It is seen from the image that the light of DDO 68 is dominated by blue young stellar populations (in black) without evidence for a red halo. This suggests that DDO 68 may be a young system, with an age less than 1 Gyr, as discussed by Pustilnik et al. (2008a). The several compact red objects in the image (in white) are either foreground Galactic stars or distant background galaxies.
2.2 Spectroscopy
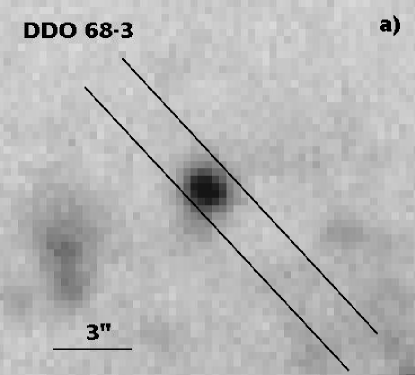
New high signal-to-noise ratio optical spectra of DDO 68 were obtained using the 3.5 m Apache Point Observatory (APO)333The Apache Point Observatory 3.5-meter telescope is owned and operated by the Astrophysical Research Consortium. telescope and the 6.5 m MMT444The MMT is operated by the MMT Observatory (MMTO), a joint venture of the Smithsonian Institution and the University of Arizona. on the nights of 2 February 2008 and 28 March 2008, respectively. The APO observations of DDO 68 were made with the Dual Imaging Spectrograph (DIS), which covers both the blue and red wavelength ranges. A 15360″ slit was used. In the blue range, we use the B400 grating with a linear dispersion of 1.83 Å/pix and a central wavelength of 4400Å, while in the red range we use the R300 grating with a linear dispersion of 2.31 Å/pix and a central wavelength of 7500Å. The above instrumental set-up gave a spatial scale along the slit of 04 pixel-1, a spectral range of 3600 – 9600Å and a spectral resolution of 7Å (FWHM). The slit was oriented in such a way as to include both regions 3 and 4 (hereafter DDO 68-3 and DDO 68-4) (Figure 1). The MMT observations of DDO 68 were made with the Blue Channel spectrograph. We used a 15180″ slit and a 800 grooves/mm grating in first order. The above instrumental set-up gave a spatial scale along the slit of 06 pixel-1, a scale perpendicular to the slit of 0.75Å pixel-1, a spectral range 3200 – 5000Å and a spectral resolution of 3Å (FWHM). We show the MMT slit location superposed on an expanded image of DDO 68-3 in Fig. 2a. The star-forming region is nearly unresolved. However, the brightness distribution along the slit suggests that the LBV star is contained within it (Fig. 2c).
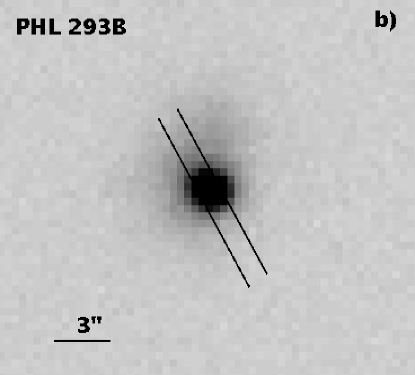
As for PHL 293B, we did not obtain new observations but used a high spectral resolution spectrum of PHL 293B in the archives of the European Southern Observatory (ESO). The spectrum was obtained with the UVES spectrograph on the 8m VLT555Based on observations made with ESO Telescopes at the La Silla Paranal Observatory under programme ID 70.B-0717(A) during the night of 8 November 2002, in both the blue arm (grating CD#2, central wavelength 3900Å, slit 1″8″) and the red arm modes (grating CD#3, central wavelength 5800Å, slit 1″12″), giving a wavelength range 3100 – 6800Å. The resolving power was 80,000, resulting in a spectral resolution 0.2Å. The VLT slit superposed on a band SDSS image of PHL 293B is shown in Fig. 2b. As in the case of DDO 68-3, the brightness distribution along the slit (Fig. 2d) suggests that the LBV star resides within the bright, compact and barely resolved star-forming region. The ESO spectrum of PHL 293B was supplemented by the SDSS spectrum, obtained on 22 August 2001, with a wavelength range 3800 – 9200Å and a spectral resolution of 3Å. The details of the spectroscopic observations are also given in Table 1.
For both APO and MMT observations, several Kitt Peak and CTIO IRS spectroscopic standard stars were observed for flux calibration. Spectra of He-Ne-Ar comparison arcs were obtained at the beginning of each night for wavelength calibration. As for the high spectral resolution VLT/UVES observations, calibration was done by observing the standard star Feige 110, and wavelength calibration was done using the spectrum of a Thorium comparison arc.
The data reduction procedures of the spectroscopic observations are the same as described in Izotov & Thuan (2007). Briefly, the two-dimensional spectra were first bias subtracted and flat-field corrected with IRAF. We then use the IRAF software routines IDENTIFY, REIDENTIFY, FITCOORD, TRANSFORM to perform wavelength calibration and correct for distortion and tilt for each frame. Background subtraction was performed using the routine BACKGROUND. The level of background emission was determined from the closest regions to the galaxy that are free of galaxian stellar and nebular line emission, as well as of emission from foreground and background sources. A one-dimensional spectrum was then extracted from the two-dimensional frame using the APALL routine. Before extraction, separate two-dimensional spectra of each object were carefully aligned using the location of the brightest part in each spectrum, so that spectra were extracted at the same positions in all subexposures. We then summed the individual spectra from each subexposure after manual removal of the cosmic rays hits.
The resulting MMT spectra of DDO 68-3 and DDO 68-4 are shown in Fig. 3. The spectrum of DDO 68-3 is strikingly different from normal spectra of H ii regions: it shows strong broad hydrogen and helium emission lines with P Cygni profiles superposed on narrow nebular emission lines (Fig. 3a). No emission lines of heavy elements (e.g., Fe ii and N iii lines) were detected, in contrast to high-metallicity quiescent LBV spectra which show the presence of many such lines. The absence of permitted heavy element emission lines in the visible spectrum of the LBV star in DDO 68-3 is most likely due to its very low metallicity, but probably also to temperature effects in the pseudo-photosphere of the LBV star as it is likely in an eruptive phase. No broad emission is detected in DDO 68-4 (Fig. 1b). The [O iii] 4363 emission line is detected in both DDO 68-3 and DDO 68-4, allowing a direct determination of the electron temperature and element abundances.
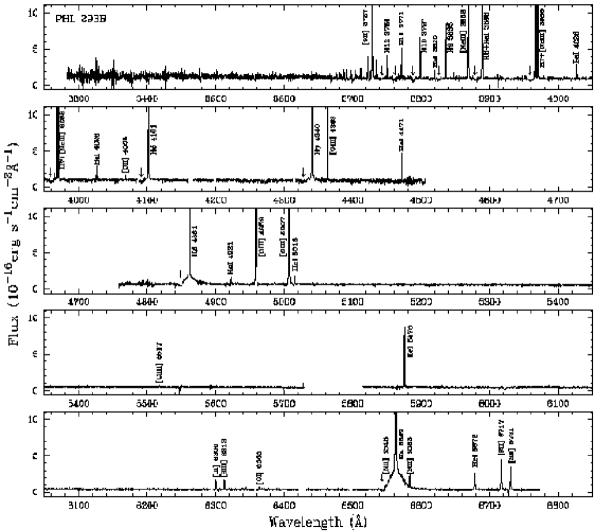
The high-resolution VLT spectrum of PHL 293B is shown in Fig. 4. Broad emission and P Cygni profiles are clearly seen for the H, H and H lines, superposed on narrow nebular emission lines. The broad emission is not evident in the higher-order hydrogen lines, even if blue absorption is present (marked by arrows in Fig. 4). However, at variance with DDO 68, no broad He i emission is seen in the spectrum of PHL 293B. Similar to DDO 68, no permitted heavy element emission lines with P Cygni profiles were detected in the spectrum of PHL 293B, again a consequence of the low metallicity of the LBV star.
3 RESULTS AND DISCUSSION
3.1 Photometry of the LBV star in DDO 68
We now examine the temporal variation of the brightness of the LBV star in DDO 68, in an attempt to narrow down the time of its outburst. It was first seen by Pustilnik et al. (2008b) thanks to the presence of broad emission in the spectrum of DDO 68-3 obtained on 11 January 2008. Earlier spectroscopic observations of the same region by Pustilnik et al. (2005) in 2005 did not reveal anything abnormal. This implies that outburst occurred sometime during the 2005 – 2007 period. We can use the SDSS and our 2.1m KPNO imaging observations of DDO 68 to narrow down this range further. With the IRAF APPHOT package, we have measured on both sets of images and magnitudes of the H ii regions in DDO 68 that are labeled in Fig. 1a. The SDSS images were obtained on 16 April 2004 and the KPNO images on 9 February 2007. The results of our photometric measurements are shown in Table 2. Examination of this table shows that the magnitudes of regions 1 – 6 derived from KPNO and SDSS images are in very good agreement when measurement errors are taken into account. Thus, the magnitude difference between the two sets of images for DDO 68-3 (where the LBV star has been identified spectroscopically) is only -0.06 mag and can be attributed to photometric errors. The agreement between the magnitudes is not as good, primarily because of the noisy short exposure SDSS image. We thus conclude that no drastic luminosity change has occurred in DDO 68-3 up to 9 February 2007, and that the LBV outburst has occurred sometime between 9 February 2007 and 11 January 2008.
As for PHL 293B, except for the SDSS images, we do not possess other images of it taken at subsequent times. All we can say is that the LBV outburst in it occurred prior to 22 August 2001, the date of the SDSS spectrum, as it already showed broad emission by then. Clearly, imaging of both DDO 68 and PHL 293B is urgently needed to constrain the magnitude jump of the LBV outburst in the two BCDs. Are both eruptions “normal” LBV outbursts with 1-2 mag, or major outbursts with 3 mag?
3.2 Element abundances
We now derive element abundances for both objects from the narrow emission line fluxes. These fluxes have been measured using Gaussian fitting with the IRAF SPLOT routine. They have been corrected for both extinction, using the reddening curve of Whitford (1958), and underlying hydrogen stellar absorption, derived simultaneously by an iterative procedure as described by Izotov et al. (1994) and using the observed decrements of the narrow hydrogen Balmer lines. It is assumed in this procedure that hydrogen line emission is produced only by spontaneous transitions in recombination cascades, i.e. we neglect possible collisional excitation. Such a situation usually holds in low-density H ii regions ionized by stellar radiation such as those considered here. The extinction-corrected fluxes 100()/(H) of the narrow lines for each galaxy, together with the extinction coefficient (H), the equivalent width of the H emission line EW(H), the H observed flux (H) and the equivalent widths of the underlying hydrogen absorption lines EW(abs) are given in Table 3. The physical conditions and element abundances of DDO 68-3 (APO and MMT observations) and DDO 68-4 (MMT observations) and of the H ii region in PHL 293B (VLT observations) are derived from the narrow line fluxes following Izotov et al. (2006). Briefly, we adopt a two-zone photoionized H ii region model: a high-ionization zone with electron temperature ([O iii]), where O iii, Ne iii, and Ar iv originate, and a low-ionization zone with electron temperature ([O ii]), where O ii, N ii, S ii and Fe iii originate. The temperature ([O iii]) is derived from the [O iii] 4363/(4959+5007) flux ratio. This temperature is used for the determination of the O2+ and Ne2+ ionic abundances. The temperature ([O ii]) is obtained from the relation between ([O ii] and ([O iii] derived by Izotov et al. (2006) by fitting photoionization models. This temperature is used for the determination of the O+ and N+ ionic abundances. The electron number density is derived from the [S ii] 6717/6731 flux ratio when it is available, and is set to 10 cm-3 when it is not. The total element abundances are obtained using ionization correction factors given by Izotov et al. (2006). The element abundances are given in Table 4.
Within the errors, the oxygen abundance derived for DDO 68-3 from the APO spectrum is in agreement with the one derived from the MMT spectrum. Note, however, that the abundance determination from the lower signal-to-noise ratio and lower resolution APO spectrum is much more uncertain. The derived values 12 + log O/H = 7.15 0.04 (DDO 68-3) and 12 + log O/H = 7.16 0.09 (DDO 68-4) are in very good agreement with 12 + log O/H = 7.14 0.03, 7.13 0.07 and 7.21 0.14 derived by Izotov & Thuan (2007) for regions 1, 2 and 6, respectively. They are also consistent with the abundance determinations for other regions in DDO 68 by Pustilnik et al. (2005) and Pustilnik et al. (2008b) from lower signal-to-noise ratio spectra. There appears not to be a large abundance variation among various H ii regions in DDO 68 over a spatial scale of 1 kpc. The relative abundance homogeneity puts stringent constraints on the physics of metal diffusion and mixing processes in this object. The overall conclusion is that we confirm and reenforce the finding by Izotov & Thuan (2007) that DDO 68 is the second lowest-metallicity emission-line galaxy known, after SBS 0335–052W which has 12 + log O/H = 7.12 0.03 (Izotov et al., 2005). This makes the discovery of a LBV star in DDO 68 particularly important. Being the lowest metallicity LBV known, its study will allow to put stringent constraints on evolution models of metal-deficient massive stars.
The oxygen abundance of PHL 293B derived from the VLT spectrum is significantly higher than those of the H ii regions in DDO 68, being equal to 12 + log O/H = 7.72 0.01. But if DDO 68 is excluded, it is still considerably lower than the oxygen abundances of all other galaxies with detected LBVs. Within the errors, it is consistent with 12 + log O/H = 7.66 0.04 derived by Izotov et al. (2007), from the lower resolution SDSS spectrum. It is also interesting to note that the nitrogen-to-oxygen abundance ratio log N/O = –1.55 0.02 is typical of low-metallicity emission-line galaxies (Izotov et al., 2006).
3.3 Broad emission
Using Gaussian fitting, we have measured the fluxes of the broad components of the Balmer H lines in the spectra of DDO 68-3 and PHL 293B, and of the He i lines in the spectrum of DDO 68-3 after subtraction of the narrow component. The extinction-corrected fluxes of the broad H, H and H lines together with the fluxes of the narrow [O iii] 4959 and 5007 nebular lines, derived from the MMT observations of DDO 68-3 and from the VLT observations of PHL 293B, are shown in Table 5. We also present in the same table the fluxes of the same lines, derived from the APO spectrum for DDO 68-3 and from the SDSS spectrum for PHL 293B. Comparison of the data for DDO 68-3 obtained at different epochs (2 February 2008 for the APO spectrum and 28 March 2008 for the MMT spectrum) reveals a flux increase of a factor of 2 for H over the course of nearly 2 months. This is likely a real change as the fluxes of the nebular emission lines [O iii] 4959, 5007 remain approximately constant over this period. This conclusion is further supported by the observations of DDO 68-3 by Pustilnik et al. (2008b). They derived a broad H flux of 5.4610-16 erg s-1 cm-2 on 11 January 2008, or 2 times lower than the broad H flux observed on 2 February 2008 at the APO and 4 times lower than the one observed on 28 March 2008 at the MMT, 2.5 months later. It thus appears that the LBV star in DDO 68 is experiencing a significant increase of emission line brightness. In Fig. 5, we compare the MMT spectrum (thick solid line) with the APO spectrum (thin solid line). The continuum level before the outburst as observed by Pustilnik et al. (2008b) (their Fig. 1, middle panel), is shown by a dotted line. It can be seen that the line flux brightening is accompanied by an increase in the continuum level. The continuum level of the MMT spectrum at 4686, the average wavelength of the band, is higher by a factor of 3 than the continuum level of the Pustilnik et al. (2008b) spectrum, taken before the outburst. Adopting an apparent magnitude = 20.17 for DDO 68-3 before the eruption (Table 2) and a distance modulus of 30 mag (which corresponds to a distance of 10 Mpc; Pustilnik et al., 2008b), the absolute brightness of the LBV star in DDO 68-3 is 11 mag on 28 March 2008. If we adopt the smaller distance of 6.24 Mpc given in the NED666NASA/IPAC Extragalactic Database (NED) is operated by the Jet Propulsion Laboratory, California Institute of Technology, under contract with the National Aeronautics and Space Administration., then the absolute magnitude of the LBV star is 10 mag. In either case, the absolute brightness is in the range of those of known LBVs (Humphreys & Davidson, 1994). Note that Pustilnik et al. (2008b) also found an increase in the continuum level of a factor of 2 between 11 January 2008 and 4 February 2008 (their Fig.2). We plan to obtain both images and spectra of DDO 68 at regular intervals to monitor the LBV’s brightness evolution in time.
As for PHL 293B, the fluxes of the broad H lines appear also at first glance to vary with time: they decrease by a factor of nearly 2 between the SDSS (22 August 2001) and VLT (8 November 2008) observations. However, a more detailed look casts doubt on that interpretation: the fluxes of the nebular [O iii] 4959, 5007 emission lines also decrease by a similar factor of 1.5. Therefore, these variations may not be real and could be caused by aperture differences between the VLT and SDSS observations. A narrow slit of 1″ width was used in the VLT observations while a round 3″ aperture was used during the SDSS observations. In contrast to the VLT slit, the larger SDSS aperture probably included all the light from the LBV star.
The H luminosities of the LBV stars (Table 5) have been calculated adopting distances from the NED = 6.24 Mpc and 22.7 Mpc for DDO 68 and PHL 293B, respectively. These distances have been obtained from the radial velocities corrected for Virgo Infall with a Hubble constant of 73 km s-1 Mpc-1. The derived luminosity (H) = 9.41036 erg s-1 (Table 5) for the LBV in DDO 68 from the APO spectrum is significantly lower than (H) = 3.41038 erg s-1 of the LBV in PHL 293B as derived from the SDSS spectrum. We have no data for the H flux for the DDO 68 star from the MMT observations as they did not cover the red wavelength range. However, if we accept that the H flux has brightened by a factor of 2 in the period between the APO and MMT oservations as the H flux and that the distance to DDO 68 can be as high as 10 Mpc (see discussion in Pustilnik et al., 2008b), we conclude that the H luminosity of the LBV in DDO 68 can be as high as 51037 erg s-1 on 28 March 2008. Then the H luminosities of the LBVs in DDO 68 and PHL 293B compare well with (H) 1038 erg s-1 of the V1 star in NGC 2363, the third lowest-metallicity LBV known (Drissen et al., 2001) after those in PHL 293B and DDO 68.
3.4 Stellar winds
In Table 6, we show the terminal velocities of the stellar winds associated with the outbursts and the FWHMs of the broad H and He i lines of the DDO 68 and PHL 293B LBVs, as derived from the high-resolution MMT and VLT spectra. The stellar wind terminal velocity is derived from the wavelength difference between the blue absorption minimum and the broad emission line maximum. For both LBVs, the ’s and FWHMs derived from different lines are in very good agreement. Our derived FWHMs for the LBV in DDO 68-3 of 1000 km s-1 are in good agreement with those derived by Pustilnik et al. (2008b). However, while our FWHMs are consistent from line to line (Table 6), those derived by Pustilnik et al. (2008b) show a large spread, mainly because of their lower signal-to-noise ratio spectra. The FWHMs measured for the LBV in PHL 293B are 600 km s-1, lower than those of the LBV in DDO 68 by a factor of 1.7. However, the FWHMs of both LBVs are significantly broader than those observed in the spectra of high-metallicity LBVs which are about 100-200 km s-1 (e.g. Leitherer et al., 1994). These differences are probably not all due to metallicity effects. Part of the FWHM differences may be explained by the fact that the high-metallicity LBVs are observed during their quiescent phase, while our low-metallicity LBVs are likely observed during their eruptive phase.
The same high velocities are found when is considered. Indeed, one of the most striking features of low-metallicity LBVs is that the terminal velocities of their winds are significantly higher than those of higher metallicity LBVs. The range of terminal velocities in higher metallicity LBVs, including V1 in NGC 2363, is 200 – 400 km s-1. For example, the galactic LBV P Cygni has a of only 185 km s-1 (Crowther, 2004), while in the low-metallicity LBVs is 800 km s-1. Probably, selection effects may play a role here: generally, emission-line galaxies are observed spectroscopically at low resolution, so that their spectra do not allow the finding of LBVs with low . In particular, with the spectral resolution of 2-3 Å of the SDSS spectra, it is unlikely that we can use them to find LBV with terminal velocities 200 km s-1. On the other hand, no high-metallicity LBV was ever found to have high terminal velocities. Most likely, metallicity does play a role and the stellar winds in low-metallicity LBVs are driven by a mechanism which is different from the one operating in high-metallicity LBVs, thought to be the radiation pressure due to the permitted lines of heavy elements. Smith & Owocki (2006) have considered a continuum-driven mechanism which could be more efficient at low metallicities than the line-driven mechanism. It is likely that winds in low-metallicity LBVs are more transparent and less dense, which results in higher terminal velocities.
New high spatial resolution spectral and photometric observations are necessary to shed light on the physical properties and evolution of low-metallicity LBVs. They will strongly constrain evolutionary models of low-metallicity massive stars on the post-main-sequence stages of their evolution. This will in turn increase our understanding of the evolution of the first generation of massive stars, when the gas was pristine.
4 CONCLUSIONS
We have studied here the broad line emission of two luminous blue variable (LBV) stars discovered in two low-metallicity blue compact dwarf (BCD) galaxies, DDO 68 and PHL 293B. We have arrived at the following conclusions:
1. The oxygen abundances in region 3 of DDO 68 (DDO 68-3) and in PHL 293B are respectively 12+log O/H = 7.15 0.04 and 12+log O/H = 7.72 0.01. These two BCDs are thus the lowest-metallicity galaxies with detected LBV stars. PHL 293B is also the most distant galaxy where a LBV star is seen.
2. Photometric observations of DDO 68-3 show that the outburst in its LBV star has occurred sometime between 9 February 2007 and 11 January 2008.
3. Broad H and He i emission lines with P Cygni profiles are seen in the spectrum of the LBV star in DDO 68. On the other hand, only H broad emission lines are detected in the spectrum of the LBV in PHL 293B. In both LBVs, no heavy element emission line such as Fe ii was detected, presumably because of their low metallicities. The broad H luminosities in both LBVs compare well with the one in the higher-metallicity LBV in NGC 2363 (Drissen et al., 1997, 2001; Petit et al., 2006). We find a strong increase of the H luminosity of the LBV in DDO 68: during the period from 11 January 2008 to 28 March 2008, it brightened by a factor of 4.
4. One of the most striking features of both low-metallicity LBVs is the high terminal velocities of their stellar winds. Their are 800 km s-1, several times greater than the of 100 – 200 km s-1 in their high-metallicity counterparts. Probably, metallicity plays a role and winds in low-metallicity LBVs are driven by a mechanism which differs from the one operating in high-metallicity LBVs.
References
- Clark et al. (2005) Clark, J. S., Larionov, V. M., & Arkharov, A. 2005, A&A, 435, 239
- Conti (1984) Conti, P. 1984, in IAU Symp. 105, Observational Tests of Stellar Evolution Theory, ed. A. Maeder & A. Renzini (Dordrecht: Reidel), 233
- Crowther (2004) Crowther, P. 2004, in Evolution of Massive Stars, Mass Loss and Winds, ed. M. Heydari-Malayeri, Ph. Stee & J.-P. Zahn, EAS Publications Series, v. 13, 119
- Crowther & Hadfield (2006) Crowther, P. A., & Hadfield, L. J. 2006, A&A, 449, 711
- Drissen et al. (1997) Drissen, L., Roy, J.-R., & Robert, C., 1997, ApJ, 474, L35
- Drissen et al. (2001) Drissen, L., Crowther, P. A., Smith, L. J., Robert, C., Roy, J.-R., & D. J. Hillier 2001, ApJ, 546, 484
- Fukugita et al. (1996) Fukugita, M., Ichikawa, T., Gunn, J. E., Doi, M., Shimasaku, K., & Schneider, D. P. 1996, AJ, 111, 1748
- Gonzalez-Delgado et al. (1994) Gonzalez-Delgado, R. M., et al. 1994, ApJ, 437, 239
- Guseva et al. (2000) Guseva, N. G., Izotov, Y. I., & Thuan, T. X. 2000, ApJ, 531, 776
- Humphreys & Davidson (1994) Humphreys, R. M., & Davidson, K. 1994, PASP, 106, 1025
- Izotov & Thuan (2007) Izotov, Y. I., & Thuan, T. X. 2007, ApJ, 665, 1115
- Izotov & Thuan (2008) Izotov, Y. I., & Thuan, T. X. 2008, ApJ, in press; preprint arXiv:0807.2029
- Izotov et al. (1994) Izotov, Y. I., Thuan, T. X., & Lipovetsky, V. A. 1994, ApJ, 435, 647
- Izotov et al. (1997a) Izotov, Y. I., Foltz, C. B., Green, R. F., Guseva, N. G., & Thuan, T. X. 1997a, ApJ, 487, L37
- Izotov et al. (1997b) Izotov, Y. I., Thuan, T. X., & Lipovetsky, V. A. 1997b, ApJS, 108, 1
- Izotov et al. (1999) Izotov, Y. I., Chaffee, F. H., Foltz, C. B., Green, R. F., Guseva, N. G., & Thuan, T. X. 1999, ApJ, 527, 757
- Izotov et al. (2005) Izotov, Y. I., Thuan, T. X., & Guseva, N. G. 2005, ApJ, 632, 210
- Izotov et al. (2006) Izotov, Y. I., Stasińska, G., Meynet, G., Guseva, N. G., & Thuan T. X. 2006, A&A, 448, 955
- Izotov et al. (2007) Izotov, Y. I., Thuan, T. X., & Guseva, N. G. 2007, ApJ, 671, 1297
- Legrand et al. (1997) Legrand, F., Kunth, D., Roy, J.-R., Mas-Hesse, J. M., & Walsh, J.-R. 1997, A&A, 326, L17
- Leitherer et al. (1994) Leitherer, C., et al. 1994, ApJ, 428, 292
- Massey et al. (2007) Massey, P., McNeill, R. T., Olsen, K. A. G., Hodge, P. W., Blaha, C., Jacoby, G. H., Smith, R. C., & Strong, S. B. 2007, AJ, 134, 2474
- Nota et al. (1996) Nota, A., Pasquali, A., Drissen, L., Leitherer, C., Robert, C., Moffat, A. F. J., & Schmutz, W. 1996, ApJS, 102, 383
- Petit et al. (2006) Petit, V., Drissen, L., & Crowther, P. 2006, AJ, 132, 1756
- Pustilnik et al. (2005) Pustilnik, S. A., Kniazev, A. Y., & Pramskij, A. G. 2005, A&A, 443, 91
- Pustilnik et al. (2008a) Pustilnik, S. A., Tepliakova, A. L., & Kniazev, A. Y. 2008a, Astr.Let., 34, 457
- Pustilnik et al. (2008b) Pustilnik, S. A., Tepliakova, A. L., Kniazev, A. Y., & Burenkov, A. N. 2008b, MNRAS, 388, L24
- Smith & Owocki (2006) Smith, N., & Owocki, S. P. 2006, ApJ, 645, L45
- Thuan & Izotov (1997) Thuan, T. X., & Izotov, Y. I. 1997, ApJ, 489, 623
- Thuan & Izotov (2005) Thuan, T. X., & Izotov, Y. I. 2005, ApJS, 161, 240
- Walborn et al. (2008) Walborn, N. R., et al. 2008, ApJ, in press; preprint arXiv:0807.1456
- Whitford (1958) Whitford, A. E. 1958, AJ, 63, 201
| Telescope | Object | Date | Wavelength range | Slit | Exposure | Airmass |
|---|---|---|---|---|---|---|
| 2.1m KPNO | DDO 68 | 09 Feb 2007 | -band | 1800 | 1.01 | |
| 2.1m KPNO | DDO 68 | 09 Feb 2007 | -band | 1800 | 1.05 | |
| 2.5m Sloan | DDO 68 | 16 Apr 2004 | -band | 54 | ||
| 2.5m Sloan | DDO 68 | 16 Apr 2004 | -band | 54 | ||
| 3.5m APO | DDO 68 | 02 Feb 2008 | 3600-9000 | 15300″ | 2700 | 1.70 |
| 6.5m MMT | DDO 68 | 28 Mar 2008 | 3200-5200 | 15180″ | 4500 | 1.08 |
| 2.5m Sloan | PHL 293B | 22 Aug 2001 | 3800-9200 | 3″(round) | 2400 | 1.25 |
| 8m VLT | PHL 293B | 08 Nov 2002 | 3100-4500 | 1″8″(blue) | 3300 | 1.10 |
| 4800-6800 | 1″12″(red) | 3300 | 1.10 |
| 2.1m KPNO | 2.5m Sloan | ||||||
|---|---|---|---|---|---|---|---|
| Region | aamagnitude difference between KPNO and SDSS measurements | aamagnitude difference between KPNO and SDSS measurements | |||||
| 09 Feb 2007 | 16 Apr 2004 | ||||||
| 1 | 19.440.02 | 20.270.05 | 19.410.04 | 20.460.18 | 0.030.04 | 0.190.19 | |
| 2 | 20.440.03 | 21.380.09 | 20.400.07 | 21.050.31 | 0.040.08 | 0.330.32 | |
| 3 | 20.170.02 | 20.630.06 | 20.230.05 | 21.030.29 | 0.060.05 | 0.400.30 | |
| 4 | 20.190.04 | 21.040.10 | 20.180.07 | 21.660.54 | 0.010.08 | 0.620.55 | |
| 5 | 19.130.01 | 19.410.02 | 19.080.02 | 19.540.08 | 0.050.02 | 0.130.08 | |
| 6 | 20.400.04 | 20.840.06 | 20.380.07 | 20.400.15 | 0.020.08 | 0.440.16 | |
| Ion | 100()/(H) | 100()/(H) | 100()/(H) | 100()/(H) |
|---|---|---|---|---|
| Galaxy | ||||
| DDO 68-3 | DDO 68-3 | DDO 68-4 | PHL 293B | |
| (MMT) | (APO) | (MMT) | (VLT) | |
| 3727 [O ii] | 50.62 1.04 | 57.83 2.59 | 94.10 1.70 | 50.21 0.84 |
| 3868 [Ne iii] | 10.07 0.40 | 6.62 0.89 | 5.22 0.09 | 48.49 0.77 |
| 3889 He i + H8 | 17.74 0.62 | 19.81 1.91 | 18.13 1.20 | 21.27 0.41 |
| 3968 [Ne iii] + H7 | 16.35 0.59 | 21.39 1.78 | 15.72 1.13 | 31.70 0.54 |
| 4101 H | 26.73 0.68 | 28.39 1.67 | 25.56 1.14 | 27.00 0.46 |
| 4340 H | 49.34 0.98 | 46.39 1.70 | 47.71 1.27 | 48.25 0.74 |
| 4363 [O iii] | 2.82 0.25 | 2.28 0.53 | 1.64 0.38 | 14.55 0.27 |
| 4471 He i | 3.28 0.25 | 3.75 0.10 | ||
| 4861 H | 100.00 1.70 | 100.00 2.30 | 100.00 1.95 | 100.00 1.44 |
| 4959 [O iii] | 39.56 0.71 | 27.37 0.83 | 23.79 0.72 | 195.13 2.79 |
| 5007 [O iii] | 115.29 1.84 | 92.85 2.03 | 68.36 1.40 | 584.35 8.33 |
| 5876 He i | 10.07 0.17 | |||
| 6563 H | 276.69 5.77 | 277.28 4.31 | ||
| 6583 [N ii] | 1.82 0.06 | |||
| 6678 He i | 2.76 0.05 | |||
| 6717 [S ii] | 4.31 0.30 | 5.04 0.11 | ||
| 6731 [S ii] | 3.00 0.27 | 3.68 0.08 | ||
| (H) | 0.000 | 0.005 | 0.000 | 0.080 |
| EW(H) Å | 16 | 85 | 36 | 37 |
| (H)aain units 10-16 erg s-1 cm-2. | 21.9 | 29.5 | 9.2 | 71.5 |
| EW(abs) Å | 0.00 | 1.55 | 0.80 | 0.05 |
| Object | 12+log O/H | log N/O | log Ne/O |
|---|---|---|---|
| DDO 68-3 (MMT) | 7.15 0.04 | –0.81 0.07 | |
| DDO 68-3 (APO) | 7.08 0.09 | –0.93 0.22 | |
| DDO 68-4 (MMT) | 7.16 0.09 | –1.02 0.25 | |
| PHL 293B (VLT) | 7.72 0.01 | –1.55 0.02 | –0.74 0.02 |
| Telescope | Date | (H)aaIn units 10-16 erg s-1 cm-2. Flux errors are derived taking into account photon statistics in non-flux calibrated spectra. | (H)aaIn units 10-16 erg s-1 cm-2. Flux errors are derived taking into account photon statistics in non-flux calibrated spectra. | (H)aaIn units 10-16 erg s-1 cm-2. Flux errors are derived taking into account photon statistics in non-flux calibrated spectra. | (H)bbIn erg s-1. | (4959)aaIn units 10-16 erg s-1 cm-2. Flux errors are derived taking into account photon statistics in non-flux calibrated spectra. | (5007)aaIn units 10-16 erg s-1 cm-2. Flux errors are derived taking into account photon statistics in non-flux calibrated spectra. |
|---|---|---|---|---|---|---|---|
| DDO 68-3 | |||||||
| APO | 2008-02-07 | 9.70.5 | 20.20.4 | 9.41036 | 8.40.3 | 26.60.4 | |
| MMT | 2008-03-28 | 10.90.4 | 19.70.3 | 8.80.2 | 25.50.4 | ||
| PHL 293B | |||||||
| SDSS | 2001-08-22 | 26.64.5 | 97.86.3 | 6.01038 | 196.56.8 | 603.820.1 | |
| VLT | 2002-11-08 | 7.50.2 | 16.70.3 | 55.20.6 | 3.41038 | 139.91.5 | 412.84.0 |
| DDO 68-3 (MMT) | PHL 293B (VLT) | ||||
|---|---|---|---|---|---|
| Line | aaIn km s-1. | FWHMbraaIn km s-1. | aaIn km s-1. | FWHMbraaIn km s-1. | |
| 6563 H | 859 | 71910 | |||
| 5016 He i | 826 | 97462 | |||
| 4861 H | 801 | 100810 | 819 | 64912 | |
| 4713 He i | 807 | 100489 | |||
| 4471 He i | 803 | 105354 | |||
| 4340 H | 835 | 112220 | 871 | 68114 | |
| 4101 H | 788 | 113733 | 735 | 47430 | |
| 3968 H7 | 762 | 110040 | |||
| 3888 H8 | 732 | 101531 | |||