Microlensing to probe the quasar structure: spectrophotometry of Q2237+0305 and of J1131-1231††thanks: Based on observations made with the ESO-VLT (Cerro Paranal, Chile; Proposals 073.B-0243(A&B), 074.B-0270(A), 075.B-0350(A), 076.B-0197(A), 177.B-0615(A&B), PI: F. Courbin; Proposal 71.A-0407(B&E), PI: D.Sluse).
Abstract:
We present the main results of the first long-term spectrophotometric monitoring of the “Einstein cross” Q2237+0305 and of the single-epoch spectra of the lensed quasar J1131-1231.
From October 2004 to December 2006, we find that two prominent microlensing events affect images A & B in Q2237+0305 while images C & D remain grossly unaffected by microlensing on a time scale of a few months. Microlensing in A & B goes with chromatic variations of the quasar continuum. We observe stronger micro-amplification in the blue than in the red part of the spectrum, as expected for continuum emission arising from a standard accretion disk. Microlensing induced variations of the C ] emission are observed both in the integrated line intensity and profile. Finally, we also find that images C & D are about 0.1-0.3 mag redder than images A & B.
The spectra of images A-B-C in J1131-1231 reveal that, in April 2003, microlensing was at work in images A and C. We find that microlensing de-amplifies the continuum emission and the Broad Line Region (BLR) in these images. Contrary to the case of Q2237+0305, we do not find evidence for chromatic microlensing of the continuum emission. On the other hand, we observe that the Balmer and Mg broad line profiles are deformed by microlensing. These deformations imply an anti-correlation between the width of the emission line and the size of the corresponding emitting region. Finally, the differential microlensing of the Fe emission suggests that the bulk of Fe is emitted in the outer parts of the BLR while another fraction of Fe is produced in a compact region.
1 Introduction
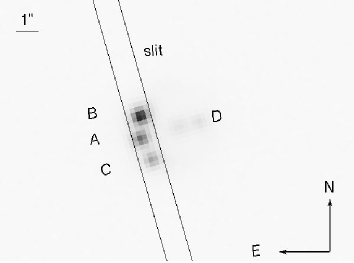
So far, the effect of microlensing on the continuum and on the Broad Line Region (BLR) of quasars has been investigated mainly theoretically (e.g. Schneider & Wambsganss 1990, Wambsganss & Paczynski 1991, Lewis et al. 1998, Abajas et al. 2002, Lewis & Ibata 2004). In this contribution, we report the main results from a spectrophotometric study of microlensing occurring in two gravitationally lensed quasars: the “Einstein cross” Q2237+0305 and J1131-1231 (Fig. 1). The Einstein cross consists of a quasar gravitationally lensed into four images in a cross-like pattern about the bulge of a nearby Sab galaxy (). Due to the low redshift of the lensing galaxy, to the high density of stars on the line of sight to the lensed images and to the negligible time delay, this system is among the best ones to study microlensing. We present hereafter some results of the first long-term regular spectro-photometric monitoring campaign of this object. The second target, J1131-1231, is one of the nearest gravitationally lensed quasar. The lensing galaxy at splits the light rays from the source at into four macro-images: three bright images (A-B-C) separated on the sky by typically 1” and a fainter component (D) located at 3.6” from A (Sluse et al. 2003). We study microlensing between the three brightest images which also happen to have negligible differential time delays.

2 Microlensing spectral signatures
microlensing selectively (de-)magnifies regions with sizes approximately smaller or equal to the projected size of the microlens Einstein radius. Consequently, it induces chromatic variations of the quasar continuum emission (Wambsganss & Paczynski, 1991), (de-)magnification of the whole BLR (Schneider & Wambsganss 1990) or deformations of the broad emission lines (e.g. Lewis 1998). Unfortunately, two other effects may also produce chromatic variations in quasar spectra and could potentially be mistaken for microlensing. First, each quasar image provides a snapshot of the source at a different epoch due to the time delays between the lensed images. If the source is intrinsically variable, this induces significant spectral differences between lensed images. Our choice of targets with differential time delays of the order of a day makes this effect negligible. Second, differential reddening between lensed images caused by the dust in the lensing galaxy might also exist. In contrast with microlensing, this effect does not vary with time. We show in Sect. 3 how the monitoring data of Q2237+0305 (Sect. 3) allow us to disentangle between differential extinction and microlensing in this system. For J1131-1231, differential reddening is negligible (Sluse et al. 2006, 2007).
Three techniques allow to unveil and study microlensing spectral signatures. First, the ratio between individual spectra provides the simplest diagnostic for the presence of chromatic difference between the lensed images. This ratio is expected to be flat and equal to the macro-magnification ratio if microlensing and/or differential extinction are not at work. Another technique assumes macro and micro-magnification factors and linearly combines the fluxes of 2 lensed images to unveil which fraction of the flux is microlensed. Finally, a more quantitative approach is to decompose the individual spectra into the multiple quasar emission components (e.g. power law continuum, narrow and broad emission lines) and compare the flux ratios in these individual components. We focus here on the first approach. Sluse et al (2007) and Eigenbrod et al. (2008) have developed the results of the last two techniques applied to resp. J1131-1231 and Q2237+0305.
3 Q2237+0305
The Einstein cross has been spectro-photometrically monitored with the FORS1 instrument (ESO Very Large Telescope) in the multi-object spectroscopy (MOS) mode from October 2004 to November 2007. This observational strategy allows us to get simultaneous observations of the main target and of four stars used as reference point-spread functions (PSFs). The 2D spectra of these stars are used to spatially deconvolve the spectra of the target using the spectral version of the MCS deconvolution algorithm (Magain et al. 1998, Courbin et al. 2000). This allows to perform an accurate calibration of the target spectra from one epoch to another (see Eigenbrod et al. 2008 for further details). We use the grism G300V that covers the wavelength range Å Å, corresponding to the quasar rest-frame range 1400-3200Å. Our spectra cover the C , C ], Mg broad emission lines, Fe UV and the quasar UV continuum. We report here the results of the first 31-epoch observations obtained from October 2004 to December 2006.
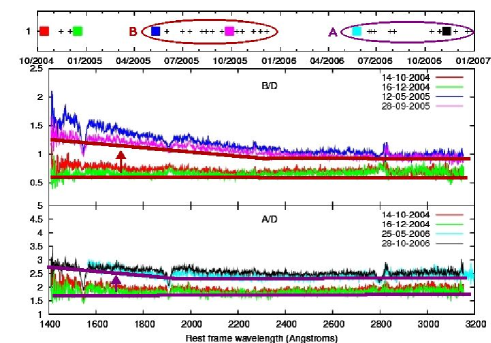
None of the spectral ratios (Fig. 2) between image pairs is perfectly flat over the whole observing period, indicating that microlensing occurs in all the lensed images. However, the flattest and most stable spectral ratio is obtained for the pairs of images C and D. This indicates that there is no differential reddening between these two images and that no major wavelength dependent continuum flux variations induced by microlensing occurred in images C or D. However, the C/D ratio shows a clear imprint of the Broad Emission Lines (BELs) indicating that the continuum of image C is significantly more magnified than the BELs during the whole observing period. The alternative scenario involving microlensing de-magnification of image D is ruled out based on the comprehensive study of the flux ratios between each possible image pair. Consequently, in the following, we take image D as a reference image. The ratios A/D, B/D show a non zero slope over the whole observing campaign, indicative of differential reddening of image D with respect to images A and B. Using a Milky-way extinction curve (Cardelli et al. 1989) with , we find that differential extinction in the range mag explains the observed slope. In addition, significant changes are observed in the spectral ratio B/D for the period May 2005-Dec 2005 (HJD 3500-3710) and in the ratio A/D for the period May 2006-Dec 2006 (HJD 3880-4100). These variations are the signature of two major chromatic microlensing events that occurred in images B and A (Fig. 2).
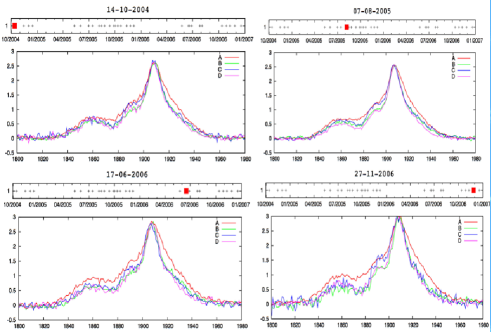
Figure 2 shows the A/D and B/D flux ratios at 4 different epochs, corrected for differential extinction. Microlensing events observed in images A & B are associated with a steepening of the bluest part of the continuum that is more (micro-)amplified than the redder part. This is a strong observational constraint that allows us to determine the energy profile of the continuum emission, i.e. how the size of the continuum emission region change with the wavelength (Eigenbrod et al., in prep.). We also find a clear evidence that the BLR is small enough to be significantly microlensed. Figure 3 shows the C ] line profile at four different epochs in the four lensed images, after normalization to the peak intensity of image A. It is conspicuous that the line profiles do not match perfectly: microlensing induces a global brightening of the line profile and also slight deformations of the line profile. The most striking difference observed in the line occurs in image A where the broadest component of the C ] emission line is more microlensed than its core. This is consistent with a scheme where the highest velocity component of the line is emitted in the most compact region. On the other hand, the larger microlensed induced variation of the C emission line indicates that C is emitted in a more compact region than C ].
4 J1131-1231
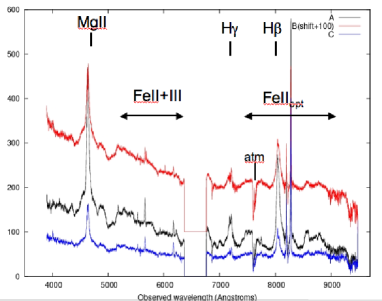
We present long-slit spectra of J1131-1231 obtained with the FORS2 instrument (ESO Very Large Telescope) on April 26th 2003. These data consist of spectra obtained with the 1” slit oriented along images B-A-C. We used 2 grisms which cover the wavelength ranges Å Å and Å Å with a resolving power of 800 and 1500 at the respective central wavelengths. This observational set up enables us to cover the (AGN) rest-frame range 2500-5600 Å. Figure 4 shows the extracted spectra and indicates the main emission features.
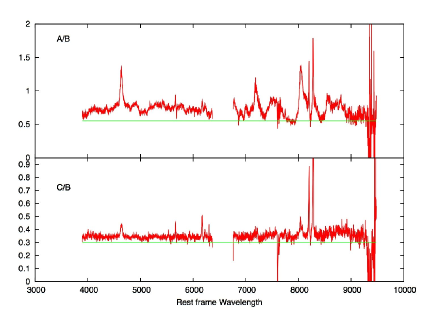
As discussed in details in Sluse et al. (2007), our data suggest microlensing de-magnification of images A and C. This scenario is further supported by optical variability and X-ray data presented in Kochanek et al. (2006). Consequently, we consider image B as our reference image, i.e. unaffected by microlensing. Figure 4 displays the spectral ratio A/B and C/B. The imprint of the QSO emission line spectra is conspicuous in the A/B spectral ratio. This indicates that the flux ratio is different in the continuum (e.g. 7900-7950 Å), the BELs (e.g. 8000-8170 Å) and in the NELs (e.g. 8240-8320 Å). Differences in the pseudo-continuum (i.e. the AGN power law continuum+blended Fe emission) is also apparent (e.g. 5100-6200 Å). This is easily understood if microlensing demagnifies more strongly the compact region emitting the continuum than the larger line-emitting regions. Although the continuum emission seems to be strongly microlensed, we do not observe chromatic changes of the continuum ratio over the studied wavelength range. Like the A/B continuum ratio, the C/B continuum ratio is flat. However, the imprint of the broad emission lines and of the narrow emission lines are well seen, confirming different amounts of microlensing in the continuum, in the broad and in the narrow emission lines. In addition, the C/B ratio shows that the broad lines appear narrower than they are in the individual spectra and that the pseudo continuum emission is nearly invisible. Consequently, the flux ratio is similar in the broadest component of the emission line, in the pseudo-continuum emission and in the continuum emission in image C, indicating that these three regions are affected by roughly identical amount of microlensing.
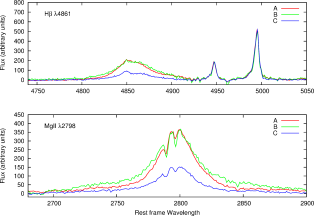
Because the region emitting the narrow [O ] emission is much larger than the typical microlensing Einstein radius, we can reasonably assume that the macro-amplification ratios are close to the flux ratios measured in [O ]. Consequently, any mismatch between the broad-emission lines after normalization to the [O ] flux is most probably the signature of microlensing. We see in Fig. 5 that the BELs in image C are significantly demagnified while only the broad component of the line is demagnified in image A. This means that the wings of the broad emission lines are emitted in a more compact region than the core of the line, as in the Einstein Cross (Sect. 3).

We have also looked at microlensing of the Fe emission in J1131-1231. Figure 6 shows the spectra of images A-B-C subtracted from the continuum emission and re-normalized to the flux in the narrow [O ] 4959, 5007 emission. For the Fe emitted at Å and Å, we see a behaviour similar to the one observed in the Mg and H emission: the Fe emission is only marginally microlensed in image A and significantly microlensed in image C. On the other hand, the bulk of the Fe emission in the range Å Å show a different behaviour. Especially, the Fe emitted in the ranges 3080-3540 Å and 4630-4800 Å (panel inset in Fig. 6) seem significantly more de-amplified than the BELs in image A, suggesting that it is emitted in more compact regions.
5 Conclusions
We have presented the main results of the first long term spectro-photometric monitoring of the Einstein Cross Q2237+0305 and of the single-epoch spectroscopic observations of the lensed quasar J1131-1231. The microlensing spectral signatures observed in the lensed images of these two systems confirm that quasar microlensing is a powerful tool for studying the continuum and the broad line emitting region of lensed quasars.
We find that all images of the Q2237+0305 are affected by some microlensing during the observing period. Image D seems to be the less affected. Our observations have monitored two important microlensing brightening episodes in image B and A on resp. May 2005-Dec 2005 (HJD 3500-3710) and May 2006-Dec 2006 (HJD 3880-4100). For each of these events, the continuum becomes bluer when the image gets brighter as expected from microlensing magnification of an accretion disk. In addition to the microlensing induced chromatic variations of the quasar continuum we have also observed time-independent reddening of images C and D with respect to A and B. We estimate that the amount of differential extinction between pairs of quasar images is in the range 0.1-0.3 mag, with images C and D being the most reddened. We also report microlensing induced variations of the BELs affecting both the integrated line intensities and profiles. The microlensing of the BLR is the strongest in image A where we observe that the broad component of the broad lines is more microlensed than the core. This is compatible with an anti-correlation between the line width and the size of the corresponding emitting region. Finally, we observe that the continuum of images C and A are significantly more magnified than the BELs during the whole observing period, indicating that long-term microlensing is at work in those two images.
The analysis of the single-epoch spectra of images A-B-C of J1131-1231 has revealed microlensing de-amplification of the quasar images A and C. In these two cases, the continuum and the BELs are microlensed. However, a larger fraction of the BELs is microlensed in image C, indicating that the Einstein radius of the microlens is larger for that image. Microlensing of the BELs confirms that the size of the emission line region is anti-correlated with the FWHM of the corresponding line component. Contrary to the case of Q2237+0305, we do not find evidence for chromatic microlensing of the continuum. The most interesting result concerns the microlensing of the Fe emission. On one hand, we find that a large fraction of the near UV and optical Fe emission takes place in a region similar to the outer parts of the Balmer Line Emitting Region. On the other hand we find that the Fe emitted in the rest-frame ranges 4630-4800 & 3080-3540Å likely arises from a more compact region possibly similar in size to the region emitting the very broad Mg emission.
Our observations have demonstrated that the BLR of the quasars Q2237+0305 and J1131-1231 is small enough to be significantly microlensed. Because of the different source redshifts, these two targets allow to study very different emitting regions in the optical range. Microlensing in Q2237+0305 allows to study the near UV continuum emission, the Fe UV, and the high ionisation C ], C broad emission lines while microlensing in J1131-1231 allows to probe the rest-frame continuum emission in the range 2500-6000 Å, the Fe opt, the low ionisation Mg , and the Balmer broad emission lines. The spectro-photometric monitoring of Q2237+0305 demonstrates the great asset of the time information in the study of quasar microlensing. We have began a 2 year spectrophotometric monitoring of J1131-1231 with the VLT to track the microlensing induced deformation of the BELs in this system. The spectro-photometric monitoring data gathered for Q2237+0305 and soon for J1131-1231 will allow to put sharp upper limits on the size of the continuum emission region and on the geometry of the BLR (for different ionization levels) using state-of-the-art inverse ray-shooting simulations.
Acknowledgements: This work is supported by the Swiss National Science Foundation, by ESA PRODEX under contract PEA C90194HST and by the Belgian Federal Science Policy Office.
References
- [2002] Abajas, C. et al. 2002, ApJ, 576, 640
- [1989] Cardelli, J. A., Clayton, G. C., Mathis, J. S., 1989, ApJ, 345, 245
- [2000] Courbin F., Magain, P., Kirkive, M., Sohy, S. 2000, ApJ, 529, 1136
- [2008] Eigenbrod A., Courbin, F., Sluse, D., Meylan, G., Agol, E. 2008, A&A, 480, 647
- [2006] Kochanek, C.S., Dai, X., Morgan, C. et al. 2006, astro-ph/0609112
- [1998] Lewis, G.F. 1998, MNRAS, 297, 69
- [2004] Lewis, G.F., Ibata, R.A. 2004, MNRAS, 348, 24
- [1998] Magain, P., Courbin, F., Sohy, S. 1998, ApJ, 494, 452
- [2006] Saha, P., Courbin, F., Sluse, D., Dye, S., Meylan, G. 2006, A&A, 450, 461
- [2003] Sluse, D., Surdej, J., Claeskens, J.-F. et al. 2003, A&A, 406, L43
- [2006] Sluse, D., Claeskens, J.-F., Altieri, B. et al. 2006, A&A, 449, 539
- [2007] Sluse, D., Claeskens, J.-F., Hutsemékers, D., Surdej, J. 2007, A&A, 468, 885
- [1990] Schneider, P., Wambsganss, J. 1990, A&A, 237, 42
- [2006] Wambsganss, J. in Gravitational lensing: strong, weak and micro. Saas-Fee Advanced Course 33. Editors G. Meylan, P. Jetzer and P. North.