Electromechanical effect in complex plasmas
Abstract
Experimental results on an auto-oscillatory pattern observed in a complex plasma are presented. The experiments are performed with an argon plasma which is produced under microgravity conditions using a capacitively-coupled rf discharge at low power and gas pressure. The observed intense wave activity in the complex plasma cloud correlates well with the low-frequency modulation of the discharge voltage and current and is initiated by periodic void contractions. Particle migrations forced by the waves are of long-range repulsive and attractive character.
pacs:
52.27.Lw, 52.35.Fp, 52.35.MwIn this letter we address the electromechanical effect and associated self-sustained oscillatory and wave patterns observed in complex plasmas with the PK-3 Plus setup on board the ISS PK3Plus ; Thomas2008 . These active experiments (including as an item wave excitations Mierk2008 ) have been performed recently in a particularly wide range of plasma parameters Thomas2008 . With a complex plasma in an active state an activation of the particle cloud-plasma feedback mechanism leading to self-sustained oscillations is quite natural.
Complex plasmas are low pressure low temperature plasmas containing microparticles. These particles can be visualized individually with a laser beam, the light of which is scattered by the particles and then recorded with a CCD camera. Under microgravity conditions in experiments on board the ISS Thomas2008 or in parabolic flight experiments Piel2006 , the recorded particle clouds are essentially three-dimensional structures more or less homogeneous, albeit inside commonly containing a void – a ’visibly empty region’ free of particles Morfill1999 . (For the last decade ”void closure” was a long-standing challenge of complex plasma investigations Lipaev2007 .)
The system ’complex plasma with a void’ (CPV) is one of the most intriguing phenomena detected in experiments with complex plasmas: the CPV gives rise to self-excited macroscopic motions – it sets the paradigm of a dissipative system capable of auto-oscillations. (This stable auto-oscillating CPV should not be confused with cyclic spatio-temporal microparticle generations Cavarroc2008 , and the heart-beat instability Mikikian2007 studied in detail in dust forming plasmas.) Depending on discharge conditions and plasma parameters, the CPV could be kept stable, or excited externally into an oscillatory state, which even in the presence of damping remains autonomically excited.
There are a few useful analogies which help to identify the main features of the self-excitation’ mechanism.
An ability to self-sustain oscillations is typical for auto-oscillation systems with inertial self-excitation such as the Helmholtz resonator well known in acoustics, and many others Pierce1989 .
We associate low-frequency current and voltage self-pulsations, and the accompanying particle oscillations in complex plasmas, with the negative differential conductivity (NDC–see Hoffmann1975 ). In this sense the CPV exibits properties similar to some type of photoconductors Hoffmann1975 , semiconductors Esaki1970 , semi-metals Upit1966 , ferroelectric liquid-crystalline films Yablonskii2001 , carbon nanotubes Anton2000 , nanocrystalline heterostructures Chen2006 and other microelectromechanical systems Sung2003 ; Mani2006 .
The non-linear dissipative compact formations in the patterns seen in CPV remotely resemble oscillons. These standing undulations can be produced on the free surface of a liquid (so-called Faraday’s waves Faraday1831 ), a granular medium (in this case localized excitations can self-organize with possible assembly into ’molecular’ and ’crystalline’ structures Umbanhowar1996 ), or nonlinear electrostatic oscillations on a plasma boundary Stenflo1996 . Oscillons ”feed” from external shaking of the system and dissipation seems to be inherent for their existence, likewise in our case. There remain still many open questions in explaining the physical mechanism of oscillons.
Hydrodynamic (or hydrodynamic-like) systems provide other examples of oscillatory patterns fed by streaming in the system: a flow-acoustic resonance Roley2002 , hydrothermal Garnier2001 and plastic deformation flows Zuev2001 , mobile dunes Sauermann2001 , surface tension auto-oscillations Kovalchuk1999 , oscillating domains in planar discharges Struempel2000 , self-excited dust density waves Mierk2007 , and many others.
The usual assumption is that auto-oscillations are maintained by a sufficiently powerful instability allowing recirculation (hysteresis) in phase space Koschmieder ; Zieper . By providing investigations of micro-particle migrations at the atomistic level, experiments with the CPV may help us to understand the fundamental nature of inanimate auto-oscillations and the intrinsic dynamics of highly dissipative non-linear structures.
Streaming ions may act as an activator of the instability in the CPV (see, e.g. Mierk2007 ). The formation of a void itself is explained frequently by the counteraction of the confinement force and the ion drag force Samsonov1999 ; Kretschmer . Void vibrations in an energized CPV are believed to be due to the heart beat instability the free energy of which may arise from streaming ions Mikikian2007 . There are a number of direct observations of the interaction of streaming ions and dust particles Kretschmer ; Steinberg ; Schweigert .
Since straightforward measurements of flowing ions in complex plasmas are not possible to perform without perturbing the particle cloud structure APiel , evidence might be extricated from the direct observations of particle vibrations. There are two possible options: (i) elucidate the long-range character of particle vibrations; (ii) decode the patterns of the secondary wavefronts. Fortunately, both options are realizable as has been proven by the given experiments.

We performed our experiments in a PK-3 Plus chamber PK3Plus ; Thomas2008 . The parallel plate capacitively coupled rf discharge is symmetrically driven by two electrodes, which have a diameter of 6 cm and are separated by 3 cm (measured voltage asymmetry does not exceed 2%; all measured electrotechnical values shown below are arithmetic means). The electrodes are surrounded by a grounded ring of 9 cm diameter and 1.5 cm width. (More technical details of the setup can be found in Thomas2008 ). Particle vibrations were recorded at a rate 50 fps and a spatial resolution of 0.41 Mpixel at 45.05 µm/pixel (49.6 µm/pixel) in the vertical (horizontal) direction. The sample rate of the low-frequency electrotechnical measurements was 10 Hz at the stage of stable vibrations.
The experiment, we address here, was performed in Argon at a pressure of 9 Pa and was arranged in two stages (Fig.1). In the first stage the discharge was ignited with a peak-to-peak voltage of 37 V at an applied (rms) power of 0.181 W (the discharge power factor for the entire circuitry was estimated as about 45-60%). Melamine-formaldehyde particles with a diameter of 9.2 1% µm and a mass density of 1.51 g/cm3 were inserted into the chamber. 111This is one of the main differenses of this experiment compared to Mikikian2007 : the particles are injected, not grown in a plasma, and the particle size is larger (at least one order of magnitude). They formed a cloud stretched horizontally (the aspect ratio width/height D/H 64 mm/15 mm) with a visually pulsating elliptically-shaped void (see Fig.2; in the maximal ”stretched” phase the void is 73 mm2). This discharge regime allows us to observe stable oscillations at a frequency 3-15 Hz and to perform statistically relevant measurements during 150 s. The estimated gas damping rate, attenuating particle motion, was 10.7 s-1. Unlike Samsonov1999 ; Mikikian2007 ; Cavarroc2008 no contaminating (sputtering) components affected the discharge.
Next the applied power was lowered to 0.12 W, and another form of the heart-beat instability with its almost irregular large-amplitude void constrictions started. The stable oscillation phase we address here would seem to be a completely different phenomenon. Details on the unstable (heart beat) phase will be published elsewhere.
The experiment started out from the stochastically stabilized complex plasma (t=0 in Fig.1; for details of stochastic stabilization see Thomas2008 ). At 20 s the external stabilization was turned off and after 1 s delay the auto-oscillations appeared. Next at 31 s the plasma was stimulated by a series of six short-time voltage pulses produced by the function generator. The pulses, with a negative amplitude of -50 V, were applied to the bottom electrode through a 20kOhm feed resistor. This produces short-time DC voltage shifts of a few volts which leads to shock compression of the particle cloud. This technique can also be used as a stability test: The CPV reverted rapidly to its former stable condition after each applied pulse. After this the CPV was observed to freely oscillate for 83 s without external forcing.
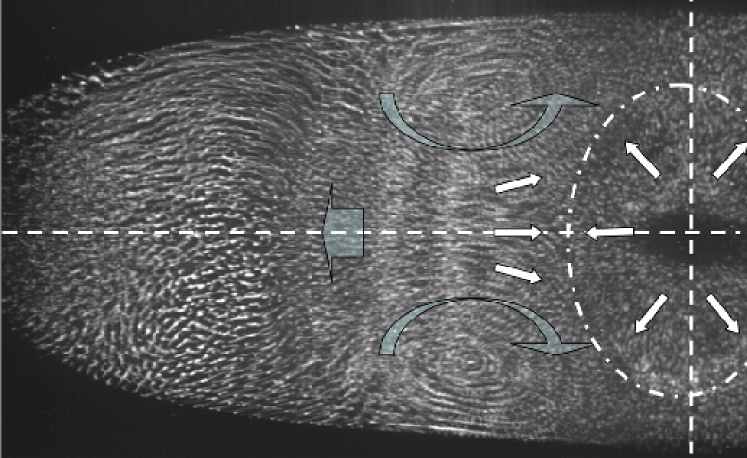
Fig.2 visualizes the dynamical activity. Surprisingly the ”shaking” divides the particle cloud into two counter-moving parts which forms a stagnation zone with nearly zero particle velocity at the interface. Outside the stagnation zone the particles are seen to move along the axis at nearly constant velocity (in this particular half cycle) as if they were attracted by the void. Apparently, in this phase the void behaves like a negatively charged probe, and long range attraction is due to the ion collection effect Samsonov2001 . (In the next half a cycle, as the void tends to close, the particles are repelled from the center). Simple estimates based on particle behavior analysis show a rather weak plasma charge oscillation with maximal decompensation of the order of .
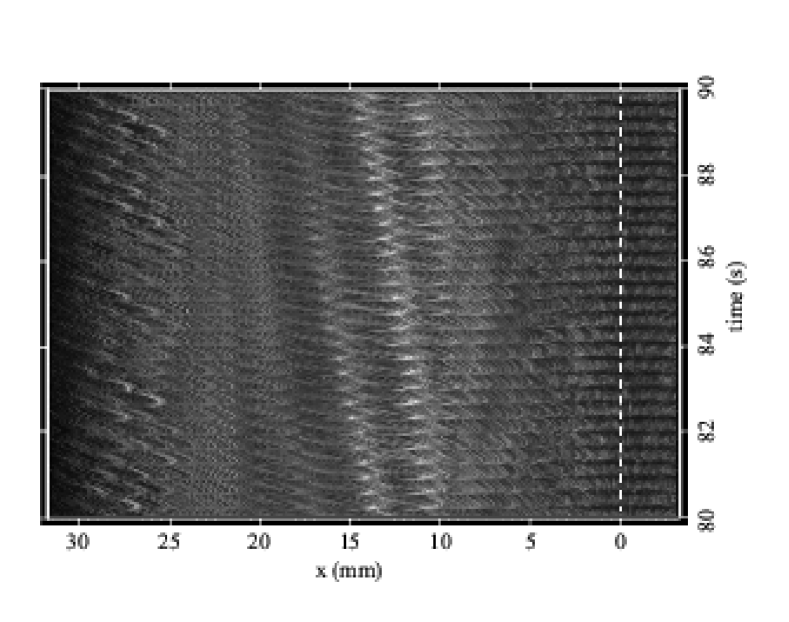
The periodic auto-oscillation pattern formed by particle horizontal vibrations is shown in Fig.3. For depicting the oscillation pattern, we follow a simple procedure proposed in Mierk2007 . From each image of the recorded sequence a narrow slab of size 35x5 mm2 centered over the void vertical position is extracted. Then the slab is ’compressed’ into a line by adding up the pixel intensities perpendicular to its longer side. The result is plotted (as a periodgram) for every frame as shown in Fig.3, forming a (x, t) map. The brighter regions of this map correspond to higher particle densities. The darkest regions are particle-free, that means that the void is maximally open. The fundamental oscillation frequency shown by the cloud is
| (1) |
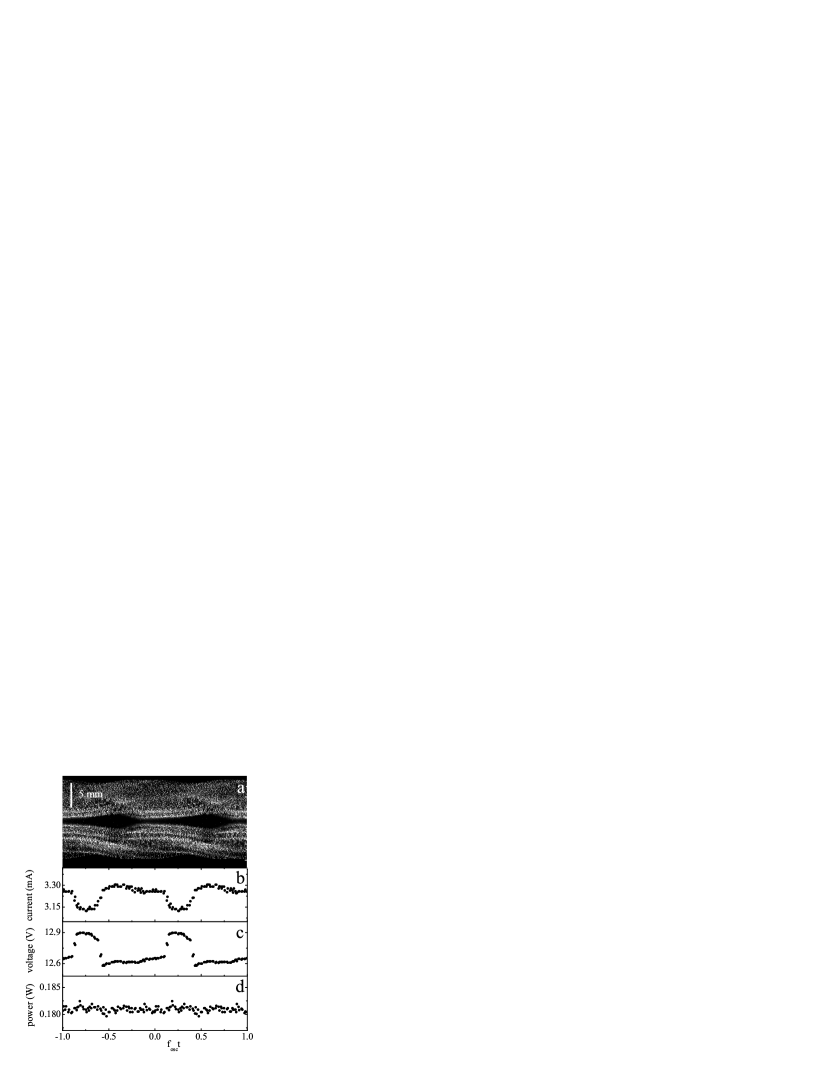
Fig.4 shows a correlation between vertical cloud oscillations and all electrical signals. There is no correlation with the applied power. To depict the pattern of vertical oscillations the aforementioned procedure is carried out over a narrow vertical slab of size 2x20 mm2. The result is shown in Fig.4a as a superposition of consecutive periods.
Comparison with the oscillatory components of the effective voltage and current (Fig.4b,c) show an almost anti-phase behaviour that is typical to pattern-creating gas discharges (see, e.g. Danijela2004 ). Mean components of these signals (corrected to measurement offset errors) are
From this we obtain an average ohmic discharge resistance of 4 kOhm. (Without particles the plasma resistance was 3.4 kOhm. This value agrees well with that estimated from Godyak1991 .)
Note that sharp current minima (voltage maxima) are apparently linked to the vertical cloud compression, whereas the void opening relates to a weak rise in the current. All this suggests an association with the variation of the discharge capacitance – an ”electromechanical effect”. In this sense the CPV might resemble a varicap, a device whose capacitance varies under the applied voltage.
Based on this analogy and using an equivalent circuit model Godyak1991 it is easy to show that the expected variation of the rms current is of the order of the
| (2) |
where R is the discharge resistance , C the discharge capacitance, Ccloud the CPV capacitance. Assuming 1 we estimate C3 pF. Hence, the observed oscillation amplitude would be explained if C0.4 pF, which is quite reasonable.
Note also that the active oscillatory state of the CPV is accompanied by a periodic pulsation in the discharge glow as well.
Extrapolating probe measurements Klindworth2006 we estimate the plasma parameters as cm-3, 2 – 3 eV. Interparticle separation averaged over the entire cloud area (Fig.2) is 230 m. The highest compression occurs at the spikes (Fig.3), 17316 m. Outside the spikes compression is less, =300-350 m. At the kinetic level we see that particles are first accelerated to high speeds (=18.90.4 mm/s), then they are decelerated forming spikes – oscillons which are clearly seen in Fig.2 as vertically elongated constrictions. Following Mierk2007 , we estimate the particle charge 9000e, the dust sound speed CDAW67 mm/s, and the dust plasma frequency 20 Hz.
The origin of the proposed electromechanical effect could be due to the cloud stretching, multiplication or selective harmonic amplification of coupled oscillations of the particles and the electrical circuitry feeding the discharge. In the case studied here it is a self-sustained low frequency resonant oscillator. We conclude that the self-excitation leading to the regular repeatable constrictions of the void in the particle cloud is due to the free energy in plasma ions drifting relative to the microparticles.
Acknowledgements.
The authors would like to acknowledge valuable discussions with R. Stterlin, P. Huber, U. Konopka, and all members of the PK-3 Plus team. This work was supported by DLR/BMWi Grant No. 50WP0203, and by RFBR Grant No. 06-02-08100.References
- (1) Available from: http://www.mpe.mpg.de/theory/plasma-crystal/PK3-Plus_e.html.
- (2) H.M. Thomas et al., NJP 10, 033036 (2008).
- (3) M. Schwabe et al., NJP 10, 033037 (2008).
- (4) A. Piel et al., Phys. Rev. Lett. 97, 205009 (2006).
- (5) G.E. Morfill et al., Phys. Rev. Lett. 83, 1598 (1999).
- (6) A.M. Lipaev et al., Phys. Rev. Lett. 98, 265006 (2007).
- (7) M. Cavarroc et al., Phys. Rev. Lett. 100, 045001 (2008).
- (8) M. Mikikian et al., NJP 9, 268 (2007).
- (9) A.D.Pierce, Acoustics: An introduction to its Physical Principles and Applications. Acoustical Society of America, 1989.
- (10) H.F. Hoffman, Phys. Stat. Sol. (a) 31, 171 (1975).
- (11) L. Esaki and R. Tsu, IBM J. Res. Develop., 61 (1970).
- (12) G.P. Upit et al., Phys. Stat. Sol. 15, 617 (1966).
- (13) S. V. Yablonskii et al., JETP 93, 94 (2001).
- (14) A.R. Hall et al., Nature Nanotechnology 2, 413 (2007).
- (15) J. Chen et. al, Nanotechnology 18, 015203 (2007).
- (16) S. Sung et al., J. Micromech. Microeng. 13, 246 (2003).
- (17) M. Hossein-Zadeh et al., PRA 64, 023813 (2006).
- (18) M. Faraday. Phil. Trans. Roy. Soc. London 52, 299 (1831).
- (19) P.B. Umbanhowar et al., Nature 382, 793 (1996).
- (20) L. Stenflo and M.Y. Yu, Nature 384, 224 (1996).
- (21) C.W. Roley et al., J. Fluid Mech. 455, 315 (2002).
- (22) N. Garnier and A. Chiffaudel, Phys. Rev. Let. 86, 75 (2001).
- (23) L. B. Zuev et al., Russian Phys. J. 44, 169 (2001).
- (24) G. Sauermann et al., Phys. Rev. E 64, 031305 (2001).
- (25) V.I. Kovalchuk et al., Phys. Rev. E 60, 2029 (1999).
- (26) C. et al., Phys. Rev. E 62, 4889 (2000).
- (27) M. Schwabe et al., Phys. Rev. Let. 99, 095002 (2007).
- (28) J. Zieper, H. Oertel (Eds.), Convective Transport and Instability Phenomena, Braun, Karlsruhe, 1982.
- (29) E.L. Koschmieder, Benard Cells and Taylor Vortices, Cambridge Univ. Press, Cambridge, 1993.
- (30) D. Samsonov and J. Goree, Phys. Rev. E 59, 1047 (1999).
- (31) M. Kretschmer et al., Phys. Rev. E 71, 056401 (2005).
- (32) V. Steinberg et al., Phys. Rev. Lett. 86, 4540 (2001).
- (33) A. Melzer et al., Phys. Rev. Lett. 83, 3194 (1999).
- (34) M. Klindworth et al., Rev. of Sci. Inst. 78, 033502 (2007).
- (35) D. Samsonov et al., Phys. Rev. E 63, 025401 (2001).
- (36) D.D. , et al., Phys. Rev. E 70, 056220 (2004).
- (37) V.A.Godyak et al., IEEE Tr. on Pl. Sci. 19, 660 (1991).
- (38) M. Klindworth et al., J. Phys. D 39, 1095 (2006).