Horizontal Branch Morphology and Mass Loss in Globular Clusters
Abstract
The connection between mass loss on the red giant branch (RGB) and horizontal branch (HB) morphology in globular clusters (GCs) has long been acknowledged but the mechanisms governing mass loss remains poorly understood from a theoretical perspective. The present study uses synthetic HB models to demonstrate for the first time that -enhancement and a simple relation between mass loss and metallicity can explain the entire range of HB morphology (characterized by the HB type index) observed in old, coeval GCs. The mass loss-metallicity relation accounts naturally for the fact that the most metal poor GCs ([Fe/H] ) have redder HBs than is typical of GCs with [Fe/H] without invoking younger ages. These results may prove useful in studying the contribution of HB stars to integrated light via stellar population synthesis.
1 Introduction
Zinn (1993) recommended that Galactic halo GCs be divided into two groups: one for old, roughly coeval GCs that follow the mean trend in [Fe/H] vs. HB type in the inner halo (the Old Halo; OH) and one for GCs that deviate from this trend by a significant amount (the Younger Halo; YH). Due to the lack of very metal poor GCs in the inner halo, Zinn used more distant GCs to extend the line below [Fe/H] , see his Figure 1.
Zinn’s relation was empirically motivated and differs from later studies—such as those by Lee, Demarque, & Zinn (1994, hereafter LDZ) and Rey et al. (2001) that are based on synthetic HB isochrones—in that it turns back to the red at the lowest metallicities ([Fe/H] -2). Trends derived from synthetic HB calculations with constant mass loss (LDZ) or mass loss that increases with [Fe/H] and age (Rey et al., 2001) indicate that HB type (as defined by LDZ 1994) rises monotonically to +1 as [Fe/H] decreases and remains there for all lower values of [Fe/H]. Lee (1991) showed that allowing mass loss to vary with [Fe/H], in a manner consistent with the observed trend in GCs, resulted in better agreement between his models and the pulsational properties of RR Lyrae stars in Cen than was achieved by assuming constant mass loss. Aside from Lee’s application to Cen, the concept of searching for a mass loss relation that matches the observed trend in old, coeval GCs has not been explored.
The purpose of this Letter is to argue that it is possible to account for the fact that the most metal poor GCs have HB types less than +1 without requiring them to be significantly younger than more metal rich GCs if mass loss on the RGB varies as a function of [Fe/H] in a manner qualitatively similar to that proposed by Lee (1991).
2 Synthetic HB Model Construction
Rood (1973) introduced an effective means of modeling the distribution of HB stars in GCs by assuming the stars that arrive on the HB are drawn at random from a Gaussian mass distribution that is truncated on both ends by physical limitations: namely the initial mass and the He core mass of the precursor red giant stars. The method further assumes that stars arrive on the HB at a constant rate and spend roughly the same amount of time there regardless of mass. Under these assumptions, one constructs a synthetic HB by drawing mass and age at random and then interpolating in a grid of He-burning evolutionary tracks to obtain the relevant quantities.
Many investigators, such as Rood (1973), LDZ (1990, 1994), Catelan & de Freitas Pacheco (1994), Rey et al. (2001), and Cassisi et al. (2004), have used the synthetic HB method to show how various model parameters influence HB morphology and the pulsational properties of RR Lyrae stars in GCs. LDZ (1994) generated isochrones in the [Fe/H] vs. HB type diagram for different ages and He abundances while assuming a fixed amount of mass loss and dispersion. Rey et al. (2001) incorporated the Reimers mass loss formula into their synthetic HB analysis (such that the average mass loss increased with [Fe/H] and age) and found that, while the sensitivity of HB morphology increased compared to the findings of LDZ (1994), the general trend was unchanged. These isochrones were used to argue that GCs with anomalously red HBs (compared to the oldest synthetic HB isochrone) are younger than the OH GCs: one of strongest arguments in favor of age as the second parameter governing HB morphology in GCs.
This study employs the He core masses, RGB tip masses, and He-burning tracks from Dotter et al. (2007) to create synthetic HB models (each consisting of 500 stars) spanning the range of [Fe/H] and observed in the Galactic halo. Simulations of 1000-2000 synthetic HBs are generated by allowing [Fe/H] to vary between and while , age, mass loss (M), and dispersion () are held constant or varied in a specified manner.
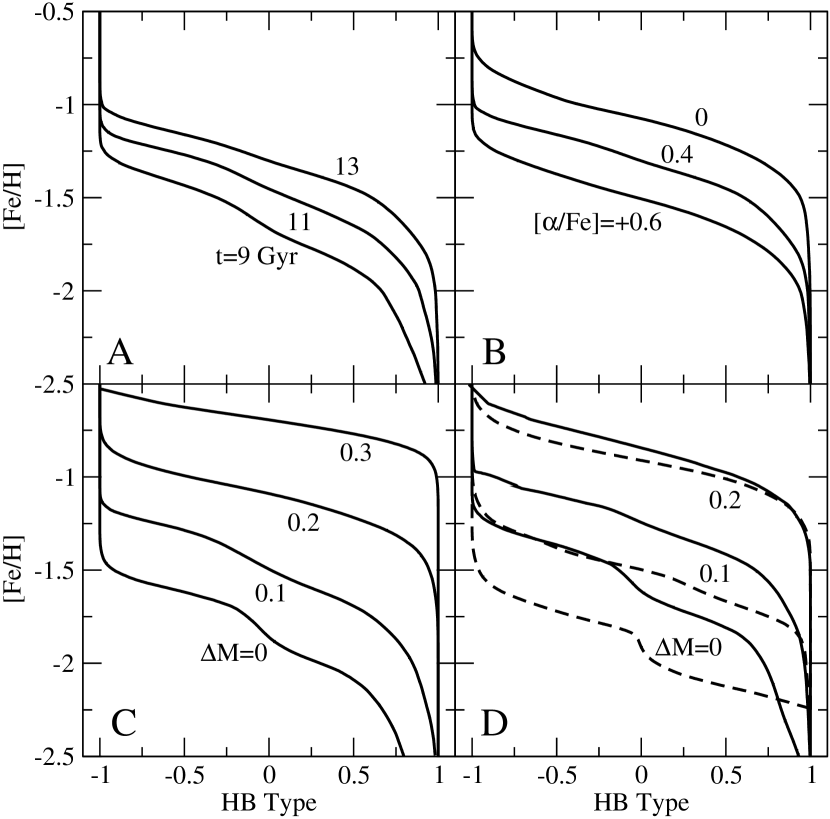
Figure 1 indicates how some of the governing parameters influence the [Fe/H] vs. HB type trend. Panel A compares trend lines derived from a simulation with constant mass loss (M=0.15 ), dispersion (=0.02 ), and =+0.4 for ages of 9, 11, and 13 Gyr; panel B shows the same mass loss and dispersion assumed in A but at a fixed age (13 Gyr) with =0, +0.2, +0.4, and +0.6; panel C illustrates the effect of varying the mass loss (M=0, 0.1, 0.2, 0.3 ) when the dispersion (0.02 ), age (13 Gyr), and (+0.4) are held constant; finally, panel D compares synthetic HBs derived from the He-burning evolutionary tracks of Dotter et al. (2007, solid lines) and Cassisi et al. (2004, dashed lines) at 13 Gyr with M=0, 0.1, and 0.2 . The Cassisi et al. (2004) models were calculated at Y=0.23 with a scaled-solar mixture for all [Fe/H] while the Dotter et al. (2007, see their Table 4) models range from Y=0.245 (at [Fe/H]=, =0) to Y=0.264 (at [Fe/H]=, =0) so it is not surprising that the the Dotter et al. (2007) models yield consistently bluer HB types in most regions of the diagram. Figure 1 shows that there is considerable degeneracy in the [Fe/H] vs. HB type diagram among age, , and M. Though not shown, stochastic effects are also significant because even though each synthetic HB consists of 500 stars (a number observed only in rich GCs) there is still a range of possible outcomes (HB type0.1) for the same input parameters. Only a few tens of HB stars have been observed in some GCs and this, combined with stochastic effects, can make the parameters governing HB morphology difficult to ascertain from model comparisons.
Based on the relationships that were found by varying individual parameters in the synthetic HB models, additional simulations were generated in order to attempt to understand the observed distribution of old, roughly coeval GCs in the Galactic halo. In these simulations, [Fe/H] was allowed to vary over [Fe/H] while age was held fixed at 13 Gyr. The level of was drawn at random from a flat distribution in such a way that the average value of decreased as [Fe/H] increased. Figure 2 shows how the fraction of synthetic HB models with a given value of is assumed to vary with [Fe/H]. This method of distributing is based on observations of the -elements as a function of [Fe/H] in halo GCs and field stars (Pritzl, Venn, & Irwin, 2005, see their Figure 3). Mass loss (M; measured in ) was assumed to vary with [Fe/H] as shown in Figure 3. The minimum value was set as a function of [Fe/H] as in equation 1.
| (1) |
Where =[Fe/H] and , , and are free parameters. The variation of M with [Fe/H] could also have been described by a broken linear relation; the use of equation 1 was chosen because it provides a smooth variation with [Fe/H]. With the minimum value of M set by equation 1, the actual value for a single synthetic HB realization was set by equation 2.
| (2) |
Where is a random number drawn from a Gaussian mass distribution having a mean value and dispersion . Thus the value of M was more likely to lie near the minimum value but, given a large enough simulation, values at the 3 level can be found. Figure 3 shows the distribution of M as a function of [Fe/H] using equations 1 and 2 for a simulation of 2000 synthetic HB models. The minimum value as defined by equation 1 is shown as the solid line while the dashed lines represent the minimum value plus 1, 2, and 3.
The value of the dispersion in the mass distribution (; also measured in ) was set in a similar fashion to that for M (equation 2) except that the minimum value was held constant at 0.02 and the dispersion in was 0.01.
3 Results
Figure 4 shows the [Fe/H] vs. HB type diagrams that are obtained when the variable Mmin given by equation 1 with , and =0.14 (solid circles) and a constant Mmin=0.14 (open squares) are assumed. Both simulations consist of 2000 synthetic HB models at 13 Gyr and both used equation 2 to determine M and as outlined in the preceding section. That synthetic HB models become redder as increases at a given [Fe/H] may be a necessary part of the explanation for why at least some of the most metal poor GCs have redder HBs than can be found at [Fe/H] but alone is not sufficient to explain this behavior. Assuming a constant mass loss and the distribution shown in Figure 2 produces the same sort of [Fe/H] vs. HB type behavior demonstrated by LDZ (1994) and Rey et al. (2001). Allowing M to vary with [Fe/H] (see equations 1 and 2) as described above produces a trend that matches the original OH trend of Zinn (1993).
The GC catalog compiled by Mackey & van den Bergh (2005) places GCs into sub-populations along the lines of Zinn (1993) but with additional categories that reflect discoveries made in the intervening years. Mackey & van den Bergh (2005) used the HB isochrones of Rey et al. (2001) to assign a sub-population to each GC. Many of the lowest metallicity GCs are considered part of the YH despite evidence that their ages are similar to other metal poor OH GCs, such as M 92 and NGC 2419, with bluer HBs (VandenBerg, 2000; Salaris & Weiss, 2002). Given the lack of a substantial age difference between the lowest metallicity GCs with different HB types, the metal poor GCs NGC 5053, 5466, 6426, and 7078 (M 15) have been included in the comparison presented here. Figure 5 compares a synthetic HB simulation with -enhancement and variable mass loss with the OH GCs (filled circles) and four metal poor YH GCs (open circles) from Mackey & van den Bergh (2005). In order to avoid complications, as much as currently possible, that arise from the HB morphologies of GCs with multiple stellar populations, NGC 1851 (Milone et al., 2008) and NGC 2808 (Piotto et al., 2007) are not shown in Figure 5.
The variable mass loss suggested in the previous section reproduces the distribution of old GCs in the halo. Indeed, if the He-burning tracks of Cassisi et al. (2004) are used instead of the Dotter et al. (2007) tracks, approximating -enhancement by [M/H] [Fe/H] + log(0.638 x 10[α/Fe] + 0.362) (Salaris, Chieffi, & Straniero, 1993), variable mass loss with the same values of , , and listed at the beginning of this section produces a nearly identical result to that shown in Figure 5. Based on these results pertaining to mass loss and HB morphology as well as the evidence that the four old, metal poor GCs with relatively red HBs are not especially young (VandenBerg, 2000; Salaris & Weiss, 2002), it is recommended that those GCs be considered part of the OH as originally intended by Zinn (1993).
4 Discussion and Conclusion
Catelan (2005) provides a thorough discussion of mass loss and HB morphology in GCs. Catelan considers a handful of empirically motivated formulae that describe the mass loss rate as a function of stellar parameters such as luminosity, radius, and surface gravity. Each predicts that mass loss increases smoothly with [Fe/H] (Catelan, 2005, Figure 4). Some of the formulae are consistent with the observed difference in HB morphology between second parameter GC pairs, but not all, and no single formula is successful for each of the GC pairs considered (Catelan, 2005, Figures 10-13). There is also a discrepancy between the formulae and observational efforts to measure mass lost by red giants in GCs by Origlia et al. (2002) who found that mass loss is not strongly correlated with metallicity and only occurs near the tip of the RGB. On the other hand, Origlia et al. (2007) found that mass loss is evident at the level of HB and increases with luminosity up to the RGB tip in 47 Tuc. The proposed mass loss-[Fe/H] relation should be straightforward to test observationally with mass loss estimates for a large enough GC sample.
These examples illustrate that mass loss remains a complex and poorly understood process. It is by no means guaranteed that the information provided by standard stellar evolution models is sufficient to calculate mass loss as a function of age and metallicity. The observed range of HB morphologies in OH GCs (which are assumed to be roughly coeval) of similar metallicity suggests that more than one factor must be involved. It seems quite plausible that mass loss may be influenced at the stellar level (by, metallicity and rotation, for example) and at the cluster level (by cluster mass or concentration, for example). Uncertainties in composition, coming from the lack of accurate abundance determinations in some lesser known GCs, or the possible presence of multiple populations with distinct compositions in a single GC, complicate the analysis and interpretation.
The situation is further complicated by the discovery of bi- and multi-modal HBs in some GCs, see Ferraro et al. (1998) for examples and a review of the subject. It has been suggested by, e.g. D’Antona & Caloi (2008) and references therein, that these (and perhaps all) GCs are comprised of chemically distinct populations that create the complex distribution of HB stars. Complications arise even in GCs with uni-modal HBs. The analysis of M 3 by Valcarce & Catelan (2008) indicates that while the synthetic HB method developed by Rood (1973), particularly the assumed Gaussian mass distribution, is ‘a reasonable first approximation, [it] fails to account for the detailed shape of M 3’s HB mass distribution.’ Valcarce & Catelan (2008) also warn that there is a mismatch between observed and theoretical lifetime-luminosity relations on the HB.
In the absence of a firm theoretical foundation for mass loss in stars, it is still possible to further our understanding of this subject and to apply that knowledge. One application of the results presented here is to the modeling of integrated light via stellar population synthesis. Investigators such as Lee, Yoon, & Lee (2000) and Lee, Lee, & Gibson (2002) have explored the dependence of integrated light properties on synthetic HB morphology and compared them with observations of extragalactic GCs. The results presented here may provide useful input for future studies along these lines.
To summarize, synthetic HB models that include the effects of -enhancement and metallicity-dependent mass loss (via equations 1 and 2) can account for the entire distribution of HB morphologies observed in old, coeval GCs in the Galactic halo. Essentially the same result is obtained from two distinct sets of He-burning tracks, suggesting this is not a spurious or model-dependent result. As a corollary, it is recommended that NGC 5053, 5466, 6426, and 7078, recently associated with the YH, be considered members of the OH since their ages are consistent with other OH GCs and their HB morphologies can be explained without invoking substantially younger ages.
References
- Cassisi et al. (2004) Cassisi, S., Castellani, M., Caputo, F., & Castellani, V. 2004, A&A, 426, 641
- Catelan (2005) Catelan, M. 2005 arxiv:astro-ph/0507464
- Catelan & de Freitas Pacheco (1994) Catelan, M. & de Freitas Pacheco, J. A. 1994, A&A, 289, 394
- D’Antona & Caloi (2008) D’Antona, F. & Caloi, V. 2008, MNRAS, in press
- Dotter et al. (2007) Dotter, A. et al. 2007, AJ, 134, 376
- Ferraro et al. (1998) Ferraro, F. R., Paltrinieri, B., Pecci, F. F., Rood, R. T., & Dorman, B. 1998, ApJ, 500, 311
- Lee (1991) Lee, Y.-W. 1991, ApJ, 373, 43
- Lee, Demarque, & Zinn (1990) Lee, Y.-W., Demarque, P., & Zinn, R. 1990, ApJ, 350, 155
- Lee, Demarque, & Zinn (1994) Lee, Y.-W., Demarque, P., & Zinn, R. 1994, ApJ, 423, 248
- Lee, Lee, & Gibson (2002) Lee, H.-C., Lee, Y.-W., & Gibson, B. K. 2002, AJ, 124, 2664
- Lee, Yoon, & Lee (2000) Lee, H.-C., Yoon, S.-J., Lee, Y-.W. 2000, AJ, 120, 998
- Mackey & van den Bergh (2005) Mackey, A. D. & van den Bergh, S. 2005, MNRAS, 360, 631
- Origlia et al. (2002) Origlia, L., Ferraro, F. R., Fusi Pecci, F., & Rood, R. T. 2002, ApJ, 571, 458
- Origlia et al. (2007) Origlia, L. Rood, R. T., Fabbri, S., Ferraro, F. R., Fusi Pecci, F., & Rich, R. M. 2007, ApJ, 667, 850
- Pritzl, Venn, & Irwin (2005) Pritzl, B. J., Venn, K. A., & Irwin, M. 2005, AJ, 130, 2140
- Milone et al. (2008) Milone, A. et al. 2008, ApJ, 673, 241
- Piotto et al. (2007) Piotto, G. et al. 2007, ApJ, 661, 53
- Rey et al. (2001) Rey, S.-C., Yoon, S.-J., Lee, Y.-W., Chaboyer, B., & Sarajedini, A. 2001, AJ, 122, 3219
- Rood (1973) Rood, R. T. 1973, ApJ, 184, 815
- Salaris, Chieffi, & Straniero (1993) Salaris, M., Chieffi, A., & Straniero, O. 1993, ApJ, 414, 580
- Salaris & Weiss (2002) Salaris, M. & Weiss, A. 2002, A&A, 388, 492
- Sarajedini et al. (2007) Sarajedini, A. et al. 2007, AJ, 133, 1658
- Valcarce & Catelan (2008) Valcarce, A. A. R. & Catelan, M. 2008, A&A, 487, 185
- VandenBerg (2000) VandenBerg, D. A. 2000, ApJS, 129, 315
- Zinn (1993) Zinn, R. 1993, ASPC, 48, 38