The parton bubble model (PBM) is connected to the glasma flux tube model (GFTM), and predicts the ridge and strong CP violation.
Abstract
In an earlier paper we developed a Parton Bubble Model (PBM) for RHIC, high-energy heavy-ion collisions. PBM was based on a substructure of a ring of localized bubbles (gluonic hot spots) which initially contain 3-4 partons composed of almost entirely gluons. The bubble ring was perpendicular to the collider beam direction, centered on the beam, at midrapidity, and located on the expanding fireball surface of Au + Au central collisions (0-10%) at =200 GeV. The bubbles emitted correlated particles at kinetic freezeout, leading to a lumpy fireball surface. For a selection of charged particles (0.8 GeV/c 4.0 GeV/c), the PBM reasonably quantitatively (within a few percent) explained high precision RHIC experimental correlation analyses in a manner which was consistent with the small observed HBT source size in this transverse momentum range. We demonstrated that surface emission from a distributed set of surface sources (as in the PBM) was necessary to obtain this consistency. A Glasma Flux Tube Model (GFTM) that formed longitudinal flux tubes in the transverse plane of two colliding sheets of Color Glass Condensate (CGC), which pass through one another had been developed. These sheets create boost invariant flux tubes of longitudinal color electric and magnetic fields. A blast wave gives the tubes near the surface transverse flow in the same way it gave transverse flow to the bubbles in the PBM. In this paper we consider the equivalent characteristics of the PBM and GFTM and connect the two models. The PBM results discussed above were all obtained without a jet trigger. Therefore while investigating the ridge in this paper we add a jet trigger to the PBM. When one considers a 3-4 GeV/c transverse momentum tagged charged particle in combination with another intermediate transverse momentum charged particle in the PBM, the ridge correlation is generated and explained. In the GFTM the longitudinal color electric and magnetic fields have a non-zero topological charge density . These fields cause a local strong CP violation which effects charged particle production coming from quarks and anti-quarks created in the tube or bubble. For investigating these phenomena we use the PBM alone, without a jet trigger. We developed four charged particle correlations which show this strong CP violation effect and accumulate from bubble to bubble independent of whether particles are pushed or pulled (by the color electric field), and rotated in a right or left handed direction (by the color magnetic field). We also show that from previously published analyses of experimental data there is already strong evidence for the longitudinal color electric fields, and predict correlations which can be used to search for color magnetic field effects.
pacs:
25.75.Nq, 11.30.Er, 25.75.Gz, 12.38.MhI Introduction and review of models
In this paper we discuss the characteristics of the parton bubble model (PBM)PBM and connect them to related characteristics of the glasma flux tube model (GFTM)Dumitru . We will then proceed to use the PBM to discuss and explain the observed ridge phenomenon by adding appropriate trigger requirements to the PBM. A successful comparison with experimental data is made. We then show how the PBM can be used to search for strong CP violations or Chern-Simons topological chargeSimons . We develop four charged particle correlations that can be used to detect the presence of these color electric and color magnetic fields. Then we show that existing published analyses can be used to already provide strong experimental evidence for the longitudinal color electric fields. Our predicted specific four charged particle correlations can be used to search for experimental evidence for the color magnetic fields.
I.1 Parton bubble model development
Our interest in and the eventual development of the PBM goes back many years to the early nineteen eighties. Van Hove’s workVanHove in the early eighties considered the bubbles as small droplets of quark-gluon plasma (QGP) assumed to be produced in ultra-relativistic collisions of hadrons and/or nuclei. His work recognized that experimental detectors only see what is emitted in the final state at kinetic freezeout. Therefore final state predictions of his string model work on plasma bubbles or any other theory required specific convincing predictions that are observable in the final state which can be measured by experiment. His work predicted that the final state rapidity distribution dn/dy of hadrons would exhibit isolated maxima of width (single bubble) or rapidity bumps of a few units (due to those cases producing a few bubbles). These rapidity regions would also contain traditional signals of QGP formation. Even this early work by Van Hove needed his bubbles near the surface of the final state fireball in order to experimentally measure the particles emitted in the final state at kinetic freezeout. We and other searched for these Van Hove bubbles, but no one ever found any significant evidence for them.
Our next paper2000 was our final attempt to make a theoretical treatment of the single bubble case (similar to the Van Hove case) which could be experimentally verified. It is possible that with enough statistics one in principle could find single to a few bubble events. We developed a number of event generators which could possibly provide evidence for striking signals resulting from these bubbles. One should note that in that paper we had included in Sec. 11 mathematical expressions describing how charged pions are effected by strong color electric and color magnetic fields which are present and parallel in a CP-odd bubble of metastable vacuum. This section was motivated by the work of Kharzeev and PisarskiPisarski . For example eq. 3-4 of the section show the boosts of the and the we estimated. Thus in 2000 we were already interested in and were investigating and publishing predictions for this phenomenon.
When we considered the RHIC quantum interference data in 2000Adler it became clear that the fireball surface was rapidly moving outward. This implied a very large phase space region covered by the fireball, and also implied that it would be very unlikely for there to be only one isolated bubble (small sourcesize) with a large amount of energy sitting on the surface. It seemed more likely that there would be many bubbles or gluonic hot spots around the expanding surface. This led to a paperthemodel which was our earlier version of Ref.PBM . In that paper we concluded that the behavior of the Hanbury-Brown and Twiss (HBT) measurementsAdler ; HBT should be interpreted as evidence of a substructure of bubbles located on the surface of the final state fireball in the central rapidity region at kinetic freezeout. The HBT radii were decreasing almost linearly with transverse momentum and implying to us a source size of 2 fm radii bubbles were on the surface and could be selected for if we considered transverse momenta above 0.8 GeV/c. These momenta would allow sufficient resolution to resolve individual bubbles of 2 fm radii. We further concluded that these HBT quantum interference observations were likely due to phase space focusing of the bubbles pushed by the expanding fireball. Thus the HBT measurements of source size extrapolated to transverse momenta above 0.8 GeV/c were images of the bubbles. The HBT correlation has the property of focusing these images on top of each other for a ring of bubbles transverse to and centered on the beam forming an average HBT radius.
Thus our model was a ring of bubbles sitting on the freezeout surface with average size 2 fm radius perpendicular to the beam at mid-rapidity. The phase space focusing would also lead to angular correlations between particles emitted by the bubbles and be observable. Fig. 1 of that paper shows such a bubble geometry. For the background particles that account for particles in addition to the bubble particles we used unquenched HIJINGhijing with its jets removed. We assumed that most of the jets were eliminated from the central events because of the strong jet quenching observed at RHICquench1 . We investigated the feasibility of using charged particle pair correlations as a function of angles which should be observable due to the phase space focusing of the particles coming from individual bubbles. At that point we fully expected that these correlations would be observable in the STAR detectorstar at RHIC if one analyzed central Au + Au collisions. Correlation analyses are powerful tools in detecting substructures. Historically substructures have played an important role in advancing our understanding of strong (non perturbative) interactions. Our earlier paper explained the general characteristics of the angular correlation data, and was also consistent with HBT measurements in a qualitative manner. This motivated us to develop a reasonably quantitative model, the parton bubble modelPBM which is discussed in the following.
I.2 Parton bubble modelPBM
In this publicationPBM we developed a QCD inspired parton bubble model (PBM) for central (impact parameter near zero) high energy heavy ion collisions at RHIC. The PBM is based on a substructure consisting of a single ring of a dozen adjoining 2-fm-radius bubbles (gluonic hot spots) transverse to the collider beam direction, centered on the beam, and located at or near mid-rapidity. The ring resides on the fireball blast wave surface (see Fig. 1 of Ref.PBM ). We assumed these bubbles are likely the final state result of quark-gluon-plasma (QGP) formation since the energy densities produced experimentally are greater than those estimated as necessary for formation of a quark-gluon-plasma. Thus this is the geometry for the final state kinetic freezeout of the QGP bubbles on the surface of the expanding fireball treated in a blast wave model.
The twelve bubble ring creates the average behavior of bubble formation driven by the energy density near the surface of the expanding fire ball of the blast wave; that forms the final state surface bubbles that emit the final state particles at kinetic freezeout. One should note that the blast wave surface is moving at its maximum velocity at freezeout (3c/4). For central events each of the twelve bubbles have 3-4 partons per bubble each at a fixed for a given bubble. The transverse momentum () distribution of the charged particles is similar to pQCD but has a suppression at high like the data.
The bubble ring radius of our model was estimated by blast wave, HBT and other general considerations to be approximately 8 fm. The bubbles emit correlated charged particles at final-state kinetic freezeout where we select a range (0.8 GeV/c 4.0 GeV/c) in order to increase signal to background. The 0.8 GeV/c cut increases the resolution to allow resolving individual bubbles which have a radius of 2 fm. This space momentum correlation of the blast wave provides us with a strong angular correlation signal. PYTHIA fragmentation functionspythia were used for the bubbles fragmentation that generate the final state particles emitted from the bubbles. The PBM explained the high precision Au + Au central (0-10%) collisions at 200 GeVcentralproduction (the highest RHIC energy). The PBM fit to the angular correlation data was reasonably quantitative to within a few percent (see Sec. 4 of Ref.PBM ).
The correlation functions we employed (like the HBT correlation functions) have the property that for the difference in angles (difference of momentum for HBT) these correlations will image all 12 bubbles on top of each other. This leads to average observed angles of approximately in , in , originating from a source size of about 2 fm radius which is consistent with the HBT correlation. Thus the PBM generates vs charged-particle-pair correlations for charged particles with in the range 0.8 Gev/c to 4.0 GeV/c as displayed in Fig. 1. See Sec. 4 of Ref.PBM for a reasonably quantitative successful comparison with data. Furthermore the model results were consistent with the Hanbury-Brown and Twiss (HBT) observationsHBT that the observed source radii determined by quantum statistical interference were reducing by a considerable factor with increasing transverse momentum (). The HBT radii are interpreted to reduce from 6 fm at 0.2 GeV/c to 2 fm at 1 GeV/c for our range. The generally accepted explanation for this behavior is that as increases radial flow increasingly focused the viewed region of the final state into smaller volumes. If just one small HBT size bubble were emitting all the correlated particles, this phenomena would lead to large spikes of particles emitted at one limited angular region in individual events. This is definitely not observed in the Au + Au or other collision data at RHIC. Therefore, a distributed ring of small sources around the beam as assumed in the PBM is necessary to explain both the HBT resultsHBT and the correlation datacentralproduction . The particles emitted from the same bubble are virtually uncorrelated to particles emitted from any other bubble except for momentum conservation requirements. An away side peak in the total correlation is built up from momentum conservation between the bubbles.
The PBM was also recently extended to PBMEPBME which is identical to the PBM for central collisions (0-5%). For centralities running from 30-80% jet quenching is not strong enough to make jets negligible therefore, a jet component was added which was based on HIJING calculations. This jet component accounts for more of the correlation as one moves toward peripheral bins, and explains all of it for the most peripheral collisions. The PBME explained in a reasonably quantitative manner (within a few percent) the behavior of the recent quantitative experimental analysis of charge pair correlations as a function of centralitycentralitydependence . This further strengthened the substantial evidence for bubble substructure. The agreement of the PBM and the PBME surface emission models with experimental analyses strongly implied that at kinetic freezeout the fireball was dense and opaque in the central region and most centralities (except the peripheral region) in the intermediate transverse momentum region (0.8 4.0 GeV/c). Thus we conclude that the observed correlated particles are both formed and emitted from or near the surface of the fireball. In the peripheral region the path to the surface is always small.
In the PBM and the PBME the bubbles are produced in large numbers, are most symmetric, and have unusual features in the most central collisions that can be related to the GFTM. Therefore the central region PBM is the model most suitable for comparing to the GFTM.
The PBM fit to the central production Au + Au correlation datacentralproduction which was observed in the STAR TPC detector reasonably quantitatively fit the data. The average observed angles were approximately in and in , originating from a source size of 2 fm radius. Thus the PBM generates vs charged-particle-pair correlations for the charged particles with in the range 0.8 GeV/c to 4.0 GeV/c as displayed in Fig. 1 of the present paper. See Sec. 4 of Ref.PBM for a reasonably quantitative successful comparison with data (within a few percent of the observed correlations).
The CI correlation used in Fig. 1 and the PBMPBM is defined below. The two different types of charged-particle-pair correlations are the unlike-sign charge pairs (US) and the like-sign charge pairs (LS). The charge-independent correlation (CI) is defined as the correlation made up of charged-particle-pairs independent of what the sign is, which is the average of the US plus the LS correlations. Thus CI = (US + LS)/2. Therefore the CI is the total charge pair correlation observed in the experimental detection system within its acceptance.
We utilize a two particle correlation function in the two dimensional (2-D) space111 where is the azimuthal angle of a particle measured in a clockwise direction about the beam. which is the difference of the psuedorapidity of the pair of particles of versus (see Ref.PBM Sec. 2.1). The PBM generated the two dimensional differences for a pair of particles versus contributing to the correlation function. The sum over all pairs coming from the same event and then summed over all events is our numerator in the correlation function. We then divide this numerator by a sum over all pairs coming from created mixed pairs where, the two particles are produced in different events, and then summed over all mixed events. The sum over all the particle pair entries in the mixed event denominator is normalized to equal the sum over all particle pairs in the numerator. This rescales the CI such that the ratio of the numerator divided by the denominator has a mean of 1.
The CI was generated for = 200 GeV central (0-5%) Au + Au collisions in the range 0.8 GeV/c to 4.0 GeV/c at RHIC. When the CI was compared to the corresponding experimental analysescentralproduction ; centralitydependence a reasonably quantitative agreement within a few percent of the observed CI was attained. See Ref.PBM Sec. 4.2, Ref.PBME Sec. V, and Ref.centralitydependence Sec. VI B222The STAR collaboration preferred to use the conventional definition of CI = US + LS which is larger by a factor of 2 than the CI definition used in this present paper that is directly physically meaningful.. The CI correlation for the 0-5% centrality bin is shown in Fig. 1. This analysis and our previous workPBM ; PBME was done without using a jet trigger. In fact jet production in the central region was negligible due to strong jet quenchingquench1 ; quench2 ; quench3 . As one can see in Fig. 1 the central CI correlation of on the near side ( ), is sharp and approximately jetlike at all . In contrast the dependence is relatively flat. In the central production the average observed angles are approximately in and in . It is of interest to note that the sharp jetlike collimation in persists at all centralities (0-80%). The elongation in persists in the 0-30% centrality range and then decreases with decreasing centrality becoming jetlike in the peripheral bins. These characteristics are in reasonable quantitative agreement with the fits of the PBM and the PBME to experimental data analysesPBM ; centralproduction ; PBME ; centralitydependence .
The difference of the US and LS correlations is defined as the charge-dependent (CD) correlation (CD = US - LS). The 2-D experimental CD correlation for centralities (0-80%) has a jetlike shape which is consistent with PYTHIA jets (vacuum fragmentation) for all centralities. This clearly implies that both particle hadroniztion and emission occur from the fireball surface region as explained in Ref.PBME Sec. II.
I.3 Glasma flux tube model
A glasma flux tube model (GFTM)Dumitru that had been developed considers that the wavefunctions of the incoming projectiles, form sheets of color glass condensates (CGC)CGC that at high energies collide, interact, and evolve into high intensity color electric and magnetic fields. This collection of primordial fields is the GlasmaLappi ; Gelis , and initially it is composed of only rapidity independent longitudinal color electric and magnetic fields. An essential feature of the Glasma is that the fields are localized in the transverse space of the collision zone with a size of 1/. is the saturation momentum of partons in the nuclear wavefunction. These longitudinal color electric and magnetic fields generate topological Chern-Simons chargeSimons which becomes a source for particle production.
The transverse space is filled with flux tubes of large longitudinal extent but small transverse size . Particle production from a flux tube is a Poisson process, since the flux tube is a coherent state. As the partons emitted from these flux tubes locally equilibrate, transverse flow builds due to the radial flow of the blast waveGavin . The flux tubes that are near the surface of the fireball get the largest radial flow and are emitted from the surface. As in the parton bubble model these partons shower and the higher particles escape the surface and do not interact. These flux tubes are in the present paper considered strongly connected to the bubbles of the PBM. The method used to connect the PBM and the GFTM is described and discussed in the next subsection ID.
is around 1 GeV/c thus the transverse size of the flux tube is about 1/4 fm. The flux tubes near the surface are initially at a radius 5 fm. The angle wedge of the flux tube is 1/20 radians or . Thus the flux tube initially has a narrow range in . The large width in the correlation which in the PBM depended on the large spread in of the bubble partons results from the independent longitudinal color electric and magnetic fields that created the Glasma flux tubes. How much of these longitudinal color electric and magnetic fields are still present in the surface flux tubes when they have been pushed by the blast wave will be a speculation of this paper for measuring strong CP violation?
It has been noted that significant features of the PBM that generated final state correlations which fit the experimentally observed correlation dataPBM ; centralproduction ; PBME ; centralitydependence are similar to those predicted by the GFTMDumitru . Therefore in the immediately following subsection we assume a direct connection of the PBM and the GTM, give reasons to justify it, and then discuss its consequences, predictions and successes.
I.4 The connection of the PBM and the GFTM
The successes of the PBM have strongly implied that the final state surface region bubbles of the PBM represent a significant substructure. In this subsection we show that the characteristics of our PBM originally developed to fit the precision STAR Au + Au correlation data in a manner consistent with the HBT data; implies that the bubble substructure we originally used to fit these previous data is closely related to the GFTM.
A natural way to connect the PBM bubbles to the GFTM flux tubes is to assume that the final state at kinetic freezeout of a flux tube is a PBM final state bubble. Thus the initial transverse size of a flux tube 1/4 fm has expanded to the size of 2 fm at kinetic freezeout. With this assumption we find consistency with the theoretical expectations of the GFTM. We can generate and explain the triggered ridge phenomenon and data (see Sec. II), thus implying the ridge is connected to the bubble substructure. We can predict and obtain very strong evidence for the color electric field of the glasma from comparing our multi-particle charged particle correlation predictions, and existing experimental correlation publications (see Sec. III). We have also predicted correlations which can be used to search for evidence for the glasma color magnetic field (Sec. III).
Of course an obvious question that arises is that since a flux tube is an isolated system does a PBM bubble, that we assume is the final state of a flux tube at kinetic freezeout, also act as an isolated system when emitting the final state particles? The near side correlations signals since the original PBMPBM have always come virtually entirely from particles emitted from the same bubble. Thus each bubble has always acted as an isolated system similar to the behavior of a flux tube.
II The Ridge is formed by the bubbles when a jet trigger is added to the PBM
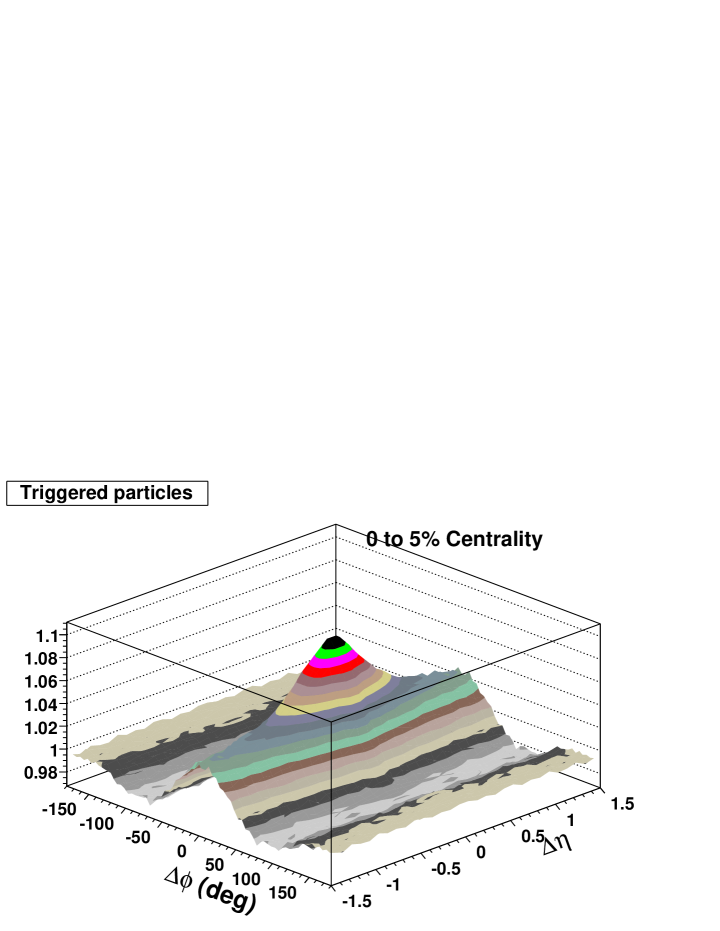
In heavy ion collisions at RHIC there has been observed a phenomenon called the ridge which has many different explanationsDumitru ; Armesto ; Romatschke ; Shuryak ; Nara ; Pantuev ; Mizukawa ; Wong ; Hwa . The ridge is a long range charged particle correlation in (very flat), while the correlation is approximately jet-like (a narrow Gaussian). There also appears with the ridge a jet-like charged-particle-pair correlation which is symmetric in and such that the peak on the jet-like correlation is at = 0 and = 0. The correlation of the jet and the ridge are approximately the same and smoothly blend into each other. The ridge correlation is generated when one triggers on an intermediate range charged particle and then forms pairs between that trigger particle and each of all other intermediate charged particles with a smaller down to some lower limit. The first case we will study in this paper is a trigger charged particle between 3.0 to 4.0 GeV/c correlated with all other charged particles which have a between 1.1 GeV/c to 3.0 GeV/c.
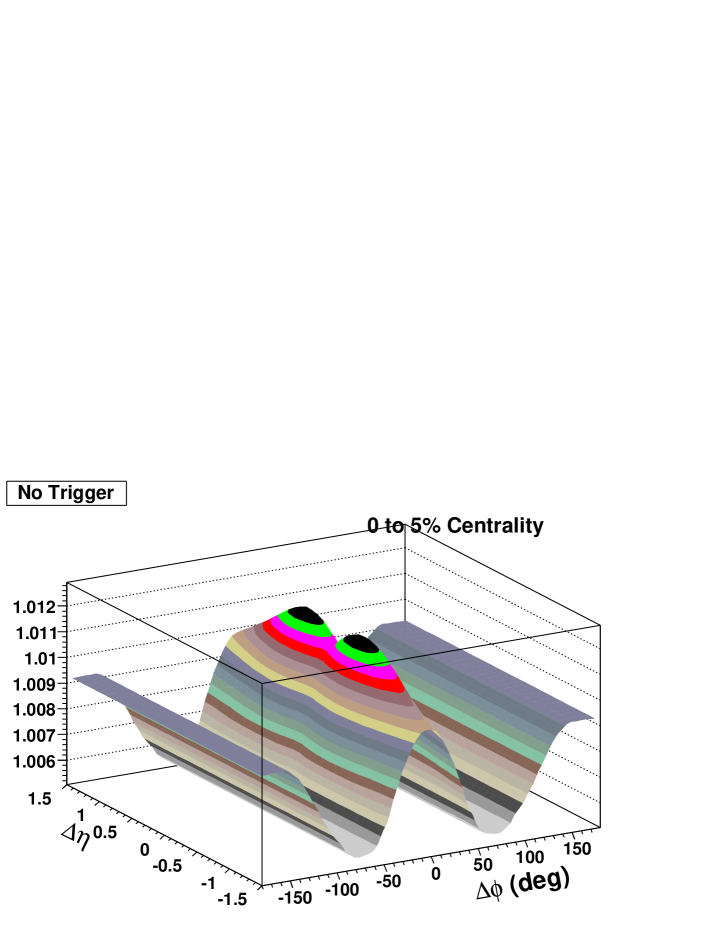
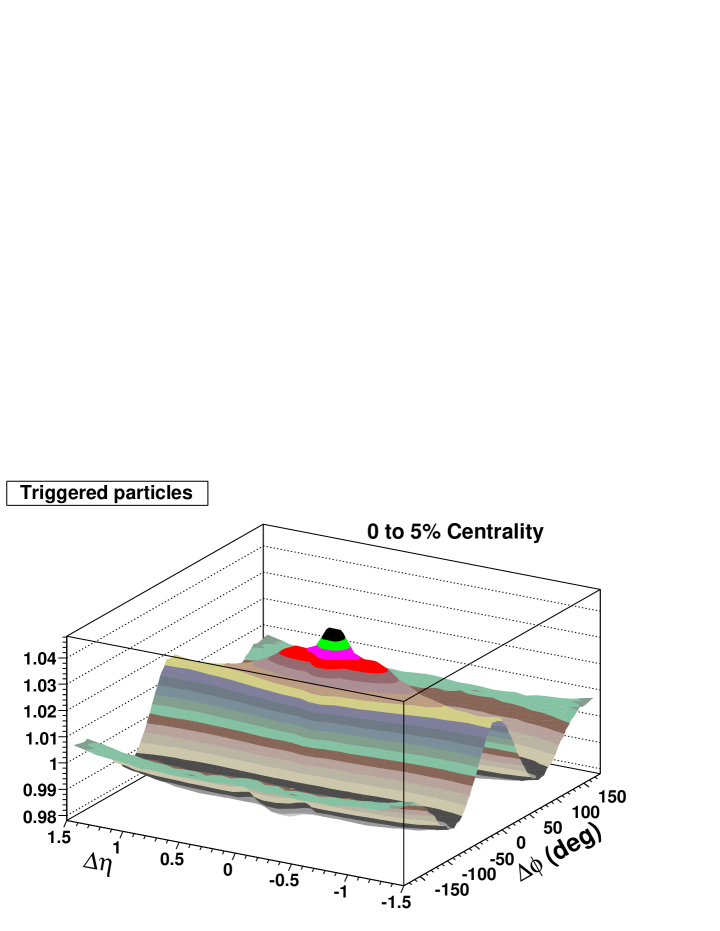
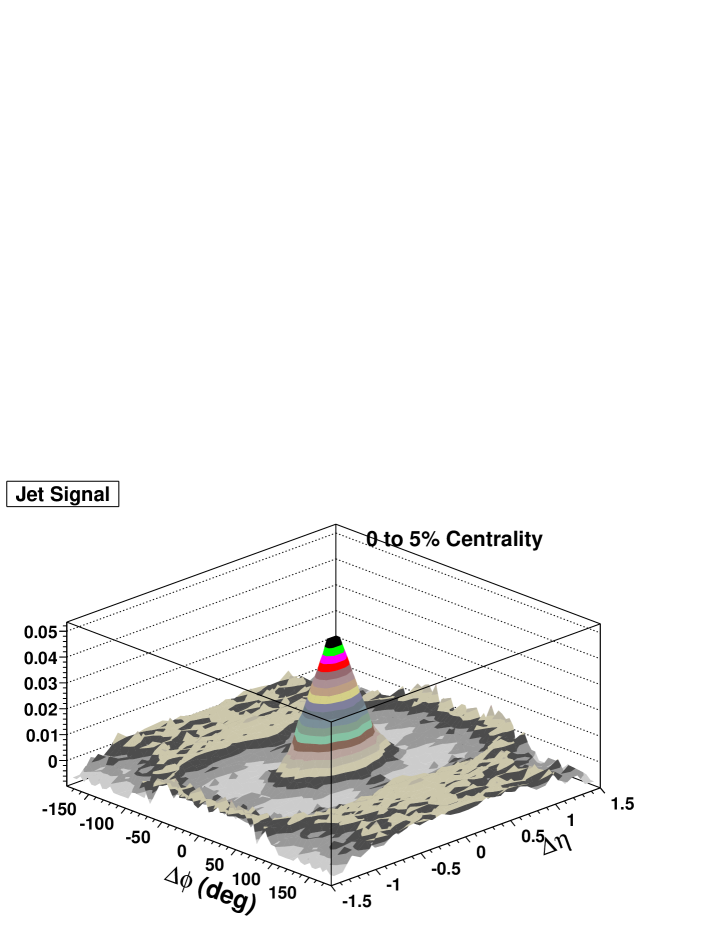
In this paper we will investigate whether the PBM can account for the ridge once we add a jet trigger to our PBM generatorPBM . However this trigger will also select jets which previously could be neglected because there was such strong quenchingquench1 ; quench2 ; quench3 of jets in central collisions. A jet trigger had not been used in the PBM comparison to all previous data. We use HIJINGhijing merely to determine the expected number of jets to add for our added jet trigger. These jet particles were added to our PBM generator. Thus our PBM generator now had HIJING generated background particles, bubbles of the PBM and added jet particles from HIJING. We have already shown that our final state particles come from hadrons at or near the fireball surface. We reduce the number of jets by 80% which corresponds to the estimate that only the parton interactions on or near the surface are not quenched away, and thus at kinetic freezeout form and emit hadrons which enter the detector. This 80% reduction is consistent with single suppression observed in Ref.quench3 . We find for the reduced HIJING jets that 4% of the Au + Au central events (0-5%) centrality at 200 have a charged particle with a between 3.0 and 4.0 GeV/c with at least one other charged particle with its greater than 1.1 GeV/c coming from the same jet. The addition of the jets to the PBM generator provides the appropriate particles which are picked up by the trigger in order to form a narrow correlation signal at 0 which is also a narrow signal in at 0 (Fig. 10). This narrow jet signal is present in the data and is what remains of jets after 80% are quenched away.
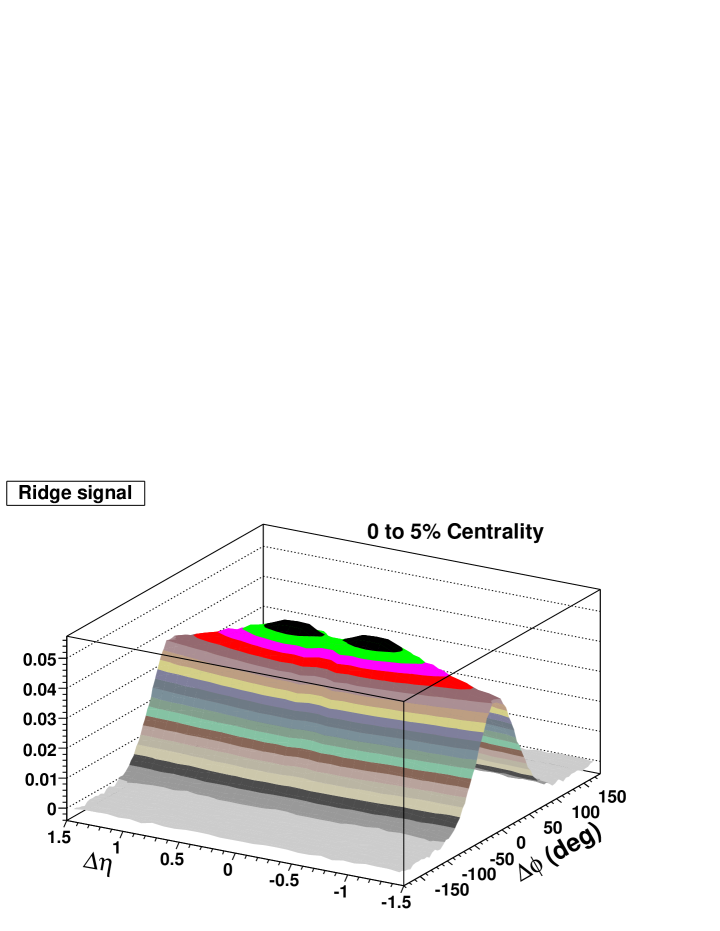
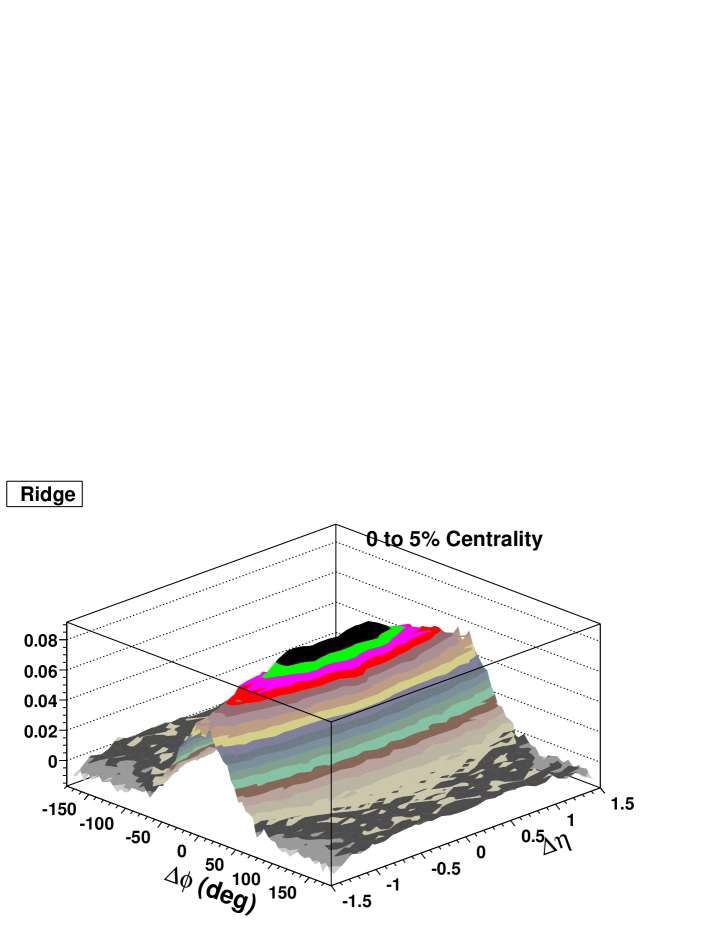
We then form two-charged-particle correlations between one-charged-particle with a between 3.0 to 4.0 GeV/c and another charged-particle whose is greater than 1.1 GeV/c. The results of these correlations are shown in Fig. 2. Fig. 2 is the CI correlation for the 0-5% centrality bin with the just above stated selections on charge pairs. Since we know in our Monte Carlo which particles are emitted from bubbles and thus form the ridge, we can predict the shape of the ridge for the above cut by plotting only the correlation formed from pairs of particles that are emitted by the same bubble (see Fig. 3). The charge pair correlations are virtually all emitted from the same bubble. Those charge pair correlations formed from particles originating from different bubbles are small contributors which mainly have some effect on the away side correlation. Thus Fig. 3 is the ridge signal which is the piece of the CI correlation for the 0-5% centrality of Fig. 2, after removing all other pairs except the pairs emitted from the same bubble.
II.1 Parton correlated vs. random
A very important aspect of the GFTM is the boost that the flux tubes get from the radial flow of the blast wave. This boost is the same all along the flux tube and only depends on how far away from the center axis of the blast wave the flux tube is. In the PBM the partons in the bubble received a boost in from the radial flow field in the blast wave; that after final state fragmentation of the bubbles gave the generated particles a consistent spectrum with the data. Since the boost from the blast wave depended on the position of the bubble in the radial flow field, there should be a correlation between partons within a bubble. If one redistributed the partons with their boosts uniformly among the bubbles, the over all results for the generated correlations without a trigger would be unchanged. One should note none of our prior work (i.e.PBMPBM or PBMEPBME ) contained a trigger. We have only added a trigger here to treat the “triggered ridge” which obviously requires it. In our treatment of the GFTM (Sec. III) we have removed the trigger.
Once we require a trigger demanding higher particles, we start picking out bubbles which have more radial flow (harder particles). Thus correlated particles which pass our selection and trigger come almost entirely from the harder bubbles with more radial flow, while the softer bubbles which were subject to less radial flow mainly generate low enough particles that become background particles or are lost to the correlation analysis due to selection. Figure 2 shows the result of our trigger and selection. If one redistributed the partons with their radial flow boost among all the bubbles, then all bubbles become equal and there is no longer soft and hard bubbles. With this change we can generate bubble events. We find that both the non-triggered correlation and the correlation are virtually unchanged in the region less than about (see Fig. 4). It seems that we move from the situation where we have a few bubbles with a lot of correlated particles above our cut to a lot of bubbles that have few correlated particles above our cuts. However there is a difference in the triggered correlation’s away side or near the peak.
In Ref.PBM we discuss this away side effect and attributed this peak to momentum conservation. This is however not the whole story. The away side peak is generated by the geometry of the bubble ring which requires that for every bubble there is another bubble nearly away that is emitting particles. These symmetry requirements on the geometry contribute more to the away side peak especially for the case without a trigger or redistributed random partons.
This geometry effect is what causes the away side correlation of elliptic flow in a peripheral heavy ion collision. In such a collision there is a higher energy density aligned with the reaction plane. On one side of the reaction plane there are more particles produced because of increased energy density, and because of the geometry of the situation. On the other side of the reaction plane there are also more particles produced for the same reasons. Thus there is a correlation between particles that are near each other on one side of the reaction plane and a correlation between particles that are on both sides of the reaction plane. Momentum conservation requires particle communication by bouncing into each other, while geometry has no such communication. The right hand does not need to know what the left hand is doing. However, if physics symmetry makes them do the same thing then they can show a correlation.
II.2 The away side peak
The away side peak depends on the fragmentation of the away side bubble. For the triggered case where there is a hard bubble with a strong correlation of parton inside the bubble (GFTM like), we will have more correlated particles adding to the signal on the near side. On the other hand the away side bubble will be on average a softer bubble which will have a lot less particles passing the cuts and thus have a smaller signal. If we consider the case of a random parton bubble the particles passing the cuts should be very similar on the near and the away side. In Fig. 4 we compare the two correlations generated by the correlated and the random cases. We compare the correlation for the two cases (solid is correlated and open is random)for each of the five bins which cover the entire range (0.0 to 1.5). The vertical correlation scale is not offset and is correct for the largest bin, 1.2 1.5, which is the lowest bin on the figure. As one proceeds upwards to the next bin the correlation is offset by +0.05. This is added to the correlation of each subsequent bin. The smallest bin on top of Fig. 4 has a +0.2 offset. A solid straight horizontal line shows the offset for each bin. Each solid straight horizontal line is at 1.0 in correlation strength. We see that the away side correlation in the region greater than about is larger for the random case.


II.3 Predicted transverse momentum dependence of correlation
Particles which come from bubbles that satisfy the trigger (3.0 4.0 GeV/c) are harder and have a different distribution compared to the case without trigger requirements. In a given triggered event if one could select particles that come from the bubble or ridge, one would find that the spectrum is harder than the average spectrum. In Fig. 5 we show how one can by trigger choose particles that are rich with ridge particles. We consider a typical trigger particle and the associated regions in the available experimental and ranges. The ridge particles we consider are separated from the trigger particle by 0.7 in . This is done to eliminate particles coming from jet production that could also be associated with the trigger particle. The bulk of the ridge particles lie within of the of the trigger particle. The width of the spread is = . Therefore on a trigger by trigger basis we accumulate particles from the ridge region (see Fig. 5) and form a spectrum of charged-particles-pairs. We then form a ratio of the spectrum for the ridge region particles divided by the spectrum for all particles in central Au + Au events. This ratio is highly dependent on our ridge cut area. We can virtually remove this dependency by normalizing the two spectra to have the same counts for the 2.0 GeV/c bin. Figure 6 is this ratio which can be considered a correlation of particles as a function of in the ridge region compared to particles from the event in general. In Fig. 6 we form this ratio or correlation for the bubbles which have a correlated among the partons (GFTM like). We also show the correlation for bubbles which have a random distribution among partons in the bubble. For the random case the spectrum does not differ much from the average spectrum while there is a big difference for the flux tube like case. This correlation could be easily measured in the RHIC data.
II.4 Comparison to data
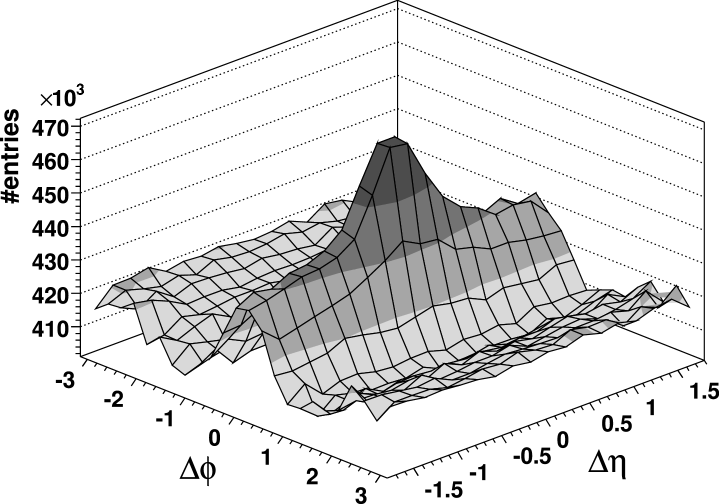
Triggered angular correlation data showing the ridge was presented at Quark Matter 2006Putschke . Figure 7 shows the experimental vs. CI correlation for the 0-10% central Au + Au collisions at 200 GeV; requiring one trigger particle between 3 and 4 GeV/c and an associated particle above 2.0 GeV/c. The yield is corrected for the finite pair acceptance. For the PBM generator, we then form a two-charged-particle correlation between one charged particle with a between 3.0 to 4.0 GeV/c and another charged particle whose is greater than 2.0 GeV/c. The results of this correlation is shown in Fig. 8. Figure 7 shows the corrected pair yield determined in the central data whereas Fig. 8 shows the correlation function generated by the PBM which does not depend on the number of events analyzed. We can compare the two figures, if we realize that the away side ridge has around 420,000 pairs in Fig. 7 while in Fig. 8 the away side ridge has a correlation of around 0.995. If we multiply the correlation scale of Fig. 8 by 422,111 in order to achieve the number of pairs seen in Fig. 7, the away side ridge would be at 420,000 and the peak would be at 465,000. This would make a good agreement between the two figures.
We know in our Monte Carlo which particles come from bubbles and which particles form the ridge. The correlation formed by the ridge particles is generated almost entirely by particles emitted by the same bubble. We have shown in all our publications that the same side correlation signals are almost entirely formed by particles coming from the same bubble. Thus we can predict the shape and the yield of the ridge for the above trigger selection and lower cut, by plotting only the correlation coming from pairs of particles that are emitted by the same bubble (see Fig. 9).
In Ref.Putschke it was assumed that the ridge yield was flat across the acceptance while in Fig. 9 we see that this is not the case. Therefore our ridge yield is approximately 35% larger than estimated in Ref.Putschke . Finally we can plot the jet yield that we had put into our Monte Carlo. We used HIJINGhijing to determine the number of expected jets, and then reduced the number of jets by 80%. This assumes that only the parton interactions on or near the surface that form hadrons at kinetic freezeout are not quenched away and thus enter the detector. This 80% reduction is consistent with single suppression observed in Ref.quench3 . This jet yield is plotted in Fig. 10 where we subtracted contributions from the bubbles and the background particles from Fig. 7.
III Strong CP violations or Chern-Simons topological charge
III.1 The Source .
The strong CP problem remains one of the most outstanding puzzles of the Standard Model. Even though several possible solutions have been put forward it is not clear why CP invariance is respected by the strong interaction. It was shown however through a theorem by Vafa-WittenWitten1 that the true ground state of QCD cannot break CP. The part of the QCD Lagrangian that breaks CP is related to the gluon-gluon interaction term .
The part of related to CP violations can be separated into a separate term which then can be varied by multiplying this term by a parameter called . For the true QCD ground state = 0 (Vafa-Witten theorem). In the vicinity of the deconfined QCD vacuum metastable domainsTytgat non-zero could exist and not contradict the Vafa-Witten theorem since these are not the QCD ground state. The metastable domains CP phenomenon would manifest itself in specific correlations of pion momentaPisarski ; Tytgat .
III.2 Pionic measures of CP violation.
The glasma flux tube model (GFTM)Dumitru considers the wavefunctions of the incoming projectiles, form sheets of CGCCGC at high energies that collide, interact, and evolve into high intensity color electric and magnetic fields. This collection of primordial fields is the GlasmaLappi ; Gelis . Initially the Glasma is composed of only rapidity independent longitudinal (along the beam axis) color electric and magnetic fields. These longitudinal color electric and magnetic fields generate topological Chern-Simons chargeSimons through the term and becomes a source of CP violation. How much of these longitudinal color electric and magnetic fields are still present in the surface flux tubes when they have been pushed by the blast wave is a speculation of this paper for measuring strong CP violation? The color electric field which points along the flux tube axis causes an up quark to be accelerated in one direction along the beam axis, while the anti-up quark is accelerated in the other direction. So when a pair of quarks and anti-quarks are formed they separate along the beam axis leading to a separated pair along this axis. The color magnetic field which also points along the flux tube axis (which is parallel to the beam axis) causes an up quark to rotate around the flux tube axis in one direction, while the anti-up quark is rotated in the other direction. So when a pair of quarks and anti-quarks are formed they will pickup or lose transverse momentum. These changes in will be transmitted to the pairs.
It is important to note that the CP violating asymmetries in and momenta arise through the Witten-Wess-ZuminoWitten2 ; Wess term. The quarks and anti quarks which, later form the and , directly respond to the color electric and color magnetic fields and receive their boosts at the quark and anti quark level before they are pions. These boosts are transmitted to the pions at hadronization. Thus no external magnetic field is required in the methodology followed in this paper. The following references demonstrate this:2000 ; Pisarski ; Tytgat ; Finch .
To represent the color electric field effect we assume as the first step for the results being shown in this paper; that we generate bubbles which have an added boost of 100 MeV/c to the quarks in the longitudinal momentum which represents the color electric effect. The and the which form a pair are boosted in opposite directions along the beam axis. In a given bubble all the boosts are the same but vary in direction from bubble to bubble. For the color magnetic field effect, we give 100 MeV/c boosts to the transverse momentum in an opposite way to the and the which form a pair. For each pair on one side of a bubble one of the charged pions boost is increased and the other is decreased. While on the other side of the bubble the pion for which the boost was increased is now decreased and the pion which was decreased is now increased by the 100 MeV/c. All pairs for a given bubble are treated in the same way however each bubble is random on the sign of the pion which is chosen to be boosted on a given side. This addition to our model is used in the simulations of the following subsections.
III.3 Color electric field pionic measure.
Above we saw that pairs of positive and negative pions should show a charge separation along the beam axis due to a boost in longitudinal momentum caused by the color electric field. A measure of this separation should be a difference in the pseudorapidity () of the opposite sign pairs. This measure has a well defined sign since we defined this difference measuring from the to the . In order to form a correlation we must pick two pairs for comparison. The pairs have to come from the same bubble (a final state of an expanded flux tube) since we have shown by investigating the events generated by the model that pairs originating from different bubbles will not show this correlation. Therefore we require the and the differ by or less in . Let us call the first pair . The next pair ( having the same requirement) has to also lie inside the same bubble to show this correlation. Thus we require that there is only between the average of each bubble. This implies that at most in no two pions can differ by more than . In Fig. 11 we show two pairs which would fall into the above cuts. and are positive in Fig. 11. However if we would interchange the and on either pair the value of its would change sign. Finally the mean value shown on Fig. 11 is the mid-point between the and the where one really uses the vector sum of the and the which moves this point toward the harder pion.
Considering the above cuts we defined a correlation function where we combine pairs each having a . Our variable is related to the sum of the absolute values of the individual ’s (). We assign a sign to this sum such that if the sign of the individual ’s are the same it is a plus sign, while if they are different it is a minus sign. For the flux tube the color electric field extends over a large pseudorapidity range therefore let us consider the separation of pairs greater than 0.9. For the numerator of the correlation function we consider all combinations of unique pairs (sign ()) from a given central Au + Au event divided by a mixed event denominator created from pairs in different events. We determine the rescale of the mixed event denominator by considering the number of pairs of pairs for the case lying between and for events and mixed events so that the overall ratio of this sample numerator to denominator is 1. By picking we make sure we are not choosing pairs from the same bubble. For a simpler notation let (sign ()) = which varies from -4 to +4 since we have an over all acceptance -1 to +1 (for the STAR TPC detector for which we calculated). The value being near 4 can happen when one has a hard pion with of 4 GeV/c (upper cut) at = 1 with a soft pion of 0.8 GeV/c (lower cut) at = -1 combined with another pair; a hard pion with of 4 GeV/c at = -1 with a soft pion with of 0.8 GeV/c at = 1.


In Fig. 12 we show the correlation function of opposite sign charge-particle-pairs paired and binned by the variable with a cut greater than 0.9 between the vector sums of the two pairs. The events are generated by the PBMPBM and are charged particles of 0.8 4.0 GeV/c, and 1, from Au + Au collisions at 200 GeV. Since we select pairs of pairs which are near each other in they all together pick up the bubble correlation and thus these pairs of pairs over all show about a 4% correlation. In the 1.0 2.0 region the correlation is 0.5% larger than the -2.0 -1.0 region. This means there are more pairs of pairs aligned in the same direction compared to pairs of pairs not aligned. This alignment is what is predicted by the color electric field effect presented above. In fact if one has plus minus pairs all aligned in the same direction and spread across a pseudorapidity range, locally at any place in the pseudorapidity range one would observe an increase of unlike sign charge pairs compared to like sign charge pairs. At small unlike sign charge pairs are much larger than like sign charge pairs in both the PBM and the data which agree. See Figs. 10, 11, and 14 of Ref.PBM . Figure 11 of Ref.PBM compares the total correlation for unlike-sign charge pairs and like-sign charge pairs in the precision STAR central production experiment for Au + Au central collisions (0-10% centrality) at =200 GeV, in the transverse momentum range 0.8 2.0 GeV/ccentralproduction . The unlike-sign charge pairs are clearly larger in the region near = = 0.0. The increased correlation of the unlike-sign pairs is 0.8% 0.002%. Figure 10 of Ref.PBM shows that the PBM fit to these data gives the same results. Figure 14 of Ref.PBM shows that the CD = unlike-sign charge pairs minus like-sign charge pairs is positive for the experimental analysis. Therefore the unlike-sign charge pairs are considerably larger than the like-sign charge pairs. In fact this effect is so large and the alignment is so great that when one adds the unlike and like sign charge pairs correlations together there is still a dip at small and see Fig. 1 and Fig. 3 of the present paper. The statistical significance of this dip in the two high precision experiments done independently from different data sets gathered 2 years apartcentralproduction ; centralitydependence is huge. It would require a fluctuation of to remove the dip. This dip is also not due to any systematic error since both of the just cited precision experiments carefully investigated that possibility; and found no evidence to challenge the reality of this dip. This highly significant dip () means that like-sign pairs are removed as one approaches the region = = 0.0. Thus this is very strong evidence for the predicted effect of the color electric field.
III.4 Color magnetic pionic measure.
After considering the color electric effect we turn to the color magnetic effect which causes up quarks to rotate around the flux tube axis in one direction, while the anti-up quarks rotate in the other direction. So when a pair of quarks and anti-quarks are formed they will pickup or lose transverse momentum. These changes in will be transmitted to the and pairs. It was previously shown in Sec. III A that the CP violating asymmetries in the and the momenta arise through the Witten-Wess-Zumino term. The quarks and anti quarks which, later form the and the , directly respond to the color electric and color magnetic fields and receive their boosts at the quark and anti quark level before they hadronize into pions. These boosts are transmitted to the and the .
In order to observe these differential changes one must select pairs on one side of the bubble in and compare to other pairs on the other side of the same bubble which would lie around to away in . We defined a pair as a plus particle and minus particle with an opening angle () of or less. We are also interested in pairs that are directly on the other side of the bubble. We require they are near in pseudorapidity ( 0.2). The above requirements constrain the four charged particles comprising both pairs to be contained in the same bubble and be close to being directly on opposite sides of the bubble (a final state expanded flux tube). The difference in changes due to and predicted by the color magnetic effect should give the on one side of the bubble an increased and a decreased on the other side, while for the it will be the other way around. This will lead to an anti-alignment between pairs. In Fig. 13 we show two pairs which would fall into the above cuts. Both pairs are at the limit of the opening angle cut and equal . The of the plus particle for pair number 1 is 1.14 GeV/c, while the minus particle is 1.39 GeV/c. Thus is equal to -0.25 GeV/c. The of the plus particle for pair number 2 is 1.31 GeV/c, the minus particle is 0.91 GeV/c and is equal to 0.40 GeV/c. Finally the mean value shown on Fig. 13 is the mid-point between the and the where one really uses the vector sum of the and the which moves this point toward the harder pion.

Considering the above cuts we defined a correlation function where we combine pairs each having a . Our variable is related to the sum of the absolute values of the individual ’s (). We assign a sign to this sum such that if the sign of the individual ’s are the same it is a plus sign, while if they are different it is a minus sign. For the flux tube the color magnetic field extends over a large pseudorapidity range where quarks and anti-quarks rotate around the flux tube axis, therefore we want to sample pairs at the different sides of the tube making a separation in () between to . We are interested in sampling the pairs on the other side so we require the separation in () be 0.2 or less. For the numerator of the correlation function we consider all combinations of unique pairs (sign ()) from a given central Au + Au event divided by a mixed event denominator created from pairs in different events. We determine the rescale of the mixed event denominator by considering the number of pairs of pairs for the case lying between 1.2 and 1.5 plus any value of for events and mixed events so that the overall ratio of this sample numerator to denominator is 1. By picking this bin for all we have around the same pair count as the signal cut with the correlation of the bubbles being washed out. For a simpler notation let (sign ()) = which we plot in the range from -4 to +4 since we have an over all range 0.8 to 4.0 GeV/c. Thus the maximum magnitude of ’s is 3.2 GeV/c which makes have a range of 6.4. However the larger values near these range limits occur very rarely.

In Fig. 14 we show the correlation function of opposite sign charged-particle-pairs paired and binned by the variable with a cut less than 0.2 between the vector sums of the two pairs, and with . The events are generated by the PBMPBM and are charged particles of 0.8 4.0 GeV/c, with 1, from Au + Au collisions at 200 GeV. Since we select pairs of pairs which are near each other in ( to ) they all together pick up the bubble correlation and thus these pairs of pairs over all show about a 0.4% correlation. In the -4.0 -1.0 region the correlation increases from 0.4% to 1%, while in the 1.0 4.0 region the correlation decreases from 0.4% to -0.2%. This means the pairs of pairs are anti-aligned at a higher rate than aligned. This anti-alignment is what is predicted by the color magnetic field effect presented above. In fact the anti-alignment increases with as the ratio bubble particle to background increases. However these predicted color magnetic effects have not been searched for yet and therefore there is no experimental evidence for them. Experimental investigations of our presented four charged particle correlations provide a method of obtaining experimental confirmation of the anti-alignment caused by the color magnetic field.
IV Summary and Discussion
In this article we have made a direct connection between our Parton Bubble Model (PBMPBM ) and the Glasma Flux Tube Model (GFTM)Dumitru ). In the GFTM a flux tube is formed right after the initial collision of the Au + Au system. This flux tube extends over many units of pseudorapidity (). In the PBM this flux tube is approximated by a sum of partons which are distributed over this same large region. A blast wave gives the tubes near the surface transverse flow in the same way it gave flow to the bubbles in the PBM. This means the transverse momentum () distribution of the flux tube is directly translated to the spectrum of the PBM.
Initially the transverse space is filled with flux tubes of large longitudinal extent but small transverse size . The flux tubes that are near the surface of the fireball get the largest radial flow and are emitted from the surface. As in the parton bubble model these partons shower and the higher particles escape the surface and do not interact. is around 1 GeV/c thus the size of the flux tube is about 1/4f initially. The flux tubes near the surface are initially at a radius 5 fm. The angle wedge of the flux tube 1/20 radians or . In Sec. I D (also see Sec. I C) we connect the GFTM to the PBM (see Sec. I B): by assuming the bubbles are the final state of a flux tube at kinetic freezeout, and discussing evidence for this connection which is further developed in Sec. II and Sec. III.
With the connection of the PBM to the GFTM two new predictions become possible for our PBM. The first is related to the fact that the blast wave radial flow given to the flux tube depends on where the tube is initially in the transverse plane of the colliding Au + Au system. The tube gets the same radial boost all along its longitudinal length. This means that there is correlated among the partons of the bubble. In this paper we consider predictions we can make in regard to interesting topics and comparisons with relevant data which exist by utilizing the parton bubble model (PBMPBM ), and its features related to the glasma flux tube model (GFTM)Dumitru ).
Topic 1: The ridge is treated in Sec. II.
Topic 2: Strong CP violation (Chern-Simons topological charge) is treated in Sec. III.
We show in Sec. II that if we trigger on particles with 3 to 4 GeV/c and correlate this trigger particle with an other charged particle of greater than 1.1 GeV/c, the PBM can produce a phenomenon very similar to the ridgeDumitru ; Armesto ; Romatschke ; Shuryak ; Nara ; Pantuev ; Mizukawa ; Wong ; Hwa . (See Figs. 2-8). We then selected charged particles inside the ridge and predicted the correlation that one should observe when compared to the average charged particles of the central Au + Au collisions at = 200 GeVcentralproduction ; centralitydependence .
In Sec. II D (Comparison to data): Triggered experimental angular correlations showing the ridge were presented at Quark Matter 2006Putschke . Figure 7 shows the experimental vs. CI correlation for 0-10% central Au + Au collisions at = 200; requiring one trigger particle between 3 to 4 GeV/c and an associated particle above 2.0 GeV/c. The yield is corrected for the finite pair acceptance.
For the PBM generator, we then form a two charged particle correlation between one charged particle with a between 3.0 to 4.0 GeV/c and another charged particle whose is geater than 2.0 GeV/c. These are the same trigger conditions as in Ref.Putschke which is shown in Fig. 7, that shows the corrected pair yield in the central data. Fig. 8 shows the correlation function generated by the PBM which does not depend on the number of events analyzed. The two figures were shown to be in reasonable agreement when compared as explained previously in Sec. II D. In Fig. 9 we show the ridge signal predicted by the PBM for very similar data but with 0-5% centrality. Figure 10 shows the extraction of the jet signal. Explanations are given in the text.
The second prediction is a development of a predictive pionic measure of the strong CP Violation. The GFTM flux tubes are made up of longitudinal color electric and magnetic fields which generate topological Chern-Simons chargeSimons through the term that becomes a source of CP violation. The color electric field which points along the flux tube axis causes an up quark to be accelerated in one direction along the beam axis, while the anti-up quark is accelerated in the other direction. So when a pair of quarks and anti-quarks are formed they separate along the beam axis leading to a separated and pair along this axis. The color magnetic field which also points along the flux tube axis (which is parallel to the beam axis) causes an up quark to rotate around the flux tube axis in one direction, while the anti-up quark rotates in the other direction. So when a pair of quarks and anti-quarks are formed they will pickup or lose transverse momentum. These changes in will be transmitted to the and pairs.
The above pionic measures of strong CP violation are used to form correlation functions based on four particles composed of two pairs which are opposite sign charge-particle-pairs that are paired and binned. These four particle correlations accumulate from bubble to bubble by particles that are pushed or pulled (by the color electric field) and rotated (by the color magnetic field) in a right or left handed direction. The longitudinal color electric field predicts aligned pairs in a pseudorapidity or measure. The longitudinal color magnetic field predicts anti-aligned pairs in a transverse momentum or measure. The observations of these correlations would be a strong confirmation of this theory. The much larger unlike-sign pairs than like-sign pairs in the PBM and the data; and the strong dip of the CI correlation at small (see Fig. 1 and Sec. III C for full details) shows very strong evidence supporting the color electric alignment prediction in the = 200 GeV central Au + Au collision data analyses at RHICPBM ; centralproduction . This highly significant dip () means that like-sign pairs are removed as one approaches the region = = 0.0. Thus this is very strong evidence for the predicted effect of the color electric field. The color magnetic anti-aligned pairs in the transverse momentum prediction, treated in Sec. III C as of now has not been observed or looked for. However our predicted specific four charged particle correlations can be used to search for experimental evidence for the color magnetic fields.
Our success in demonstrating strong experimental evidence for the expected color electric field effects from previously published data suggests that the unique detailed correlations we have presented for searching for evidence for the predicted color magnetic field effects should be urgently investigated. If we are lucky and the predicted color magnetic effects can be confirmed experimentally we would have strong evidence for the following:
1) CP is violated in the strong interaction in isolated local space time regions where topological chargeSimons is generated.
2) The glasma flux tube model (GFTM) which was evolved from the color glass condensate (CGC) would be found to be consistent with a very significant experimental check.
3) The parton bubble model event generator (PBM) is clearly closely connected to the GFTM. The bubble substructure strongly supported by the PBM is likely due to the final state of the flux tube at kinetic freezeout.
V Acknowledgments
This research was supported by the U.S. Department of Energy under Contract No. DE-AC02-98CH10886 and the City College of New York Physics Department. The authors thank William Love for valuable discussion and assistance in production of figures.
References
- (1) S.J. Lindenbaum, R.S. Longacre, Eur. Phys. J. C. 49, 767-782 (2007).
- (2) A. Dumitru, F. Gelis, L. McLerran and R. Venugopalan, Nucl. Phys. A 810, 91 (2008).
- (3) D. Kharzeev, A. Krasnitz and R. Venugopalan, Phys. Lett. B 545, 298 (2002).
- (4) L. Van Hove, Z. Phys. C 27, 135 (1985).
- (5) S.J. Lindenbaum, R.S. Longacre, J. Phys. G 26, 937 (2000).
- (6) D. Kharzeev, R.D. Pisarski, Phys. Rev. D 61, 111901 (2000).
- (7) C. Adler et al., Phys. Rev. Lett. 87, 082301 (2001).
- (8) S.J. Lindenbaum, R.S. Longacre M. Kramer, Eur. Phys. J. C. 30, 241 (2003).
- (9) J. Adams et al., Phys. Rev. C. 71, 044906 (2005), S.S. Adler et al., Phys Rev. Lett. 93, 152302 (2004).
- (10) X.N. Wang and M. Gyulassy, Phys. Rev. D 44, 3501 (1991).
- (11) K. Adcox et al., Phys. Rev. Lett. 88, 022301 (2001).
- (12) Nucl. Instrum. Meth. A 499,(2003), C. Adler et al., 433-436, K.H. Ackermann et al.(STAR Collaboration), 624-632, M. Anderson et al., 659-678, F.S. Bieser et al., 766-777.
- (13) T. Sjostrand, M. van Zijil, Phys. Rev. D 36, 2019 (1987).
- (14) J. Adams et al., Phys. Rev. C 75, 034901 (2007).
- (15) S.J. Lindenbaum and R.S. Longacre, Phys. Rev. C 78, 054904 (2008).
- (16) B.I. Abelev et al., arXiv:0806.0513[nucl-ex].
- (17) J. Adams et al., Phys. Rev. Lett. 91, 172302 (2003).
- (18) A. Adare et al., arXiv:0801.4020[nucl-ex].
- (19) L. McLerran and R. Venugopalan, Phys. Rev. D 49, 2233 (1994); Phys. Rev. D 49, 3352 (1994); Phys. Rev. D 50, 2225 (1994).
- (20) T. Lappi and L. McLerran, Nucl. Phys. A 772, 200 (2006).
- (21) F. Gelis and R. Venugopalan, Acta Phys. Polon. B 37, 3253 (2006).
- (22) S. Gavin, L. McLerran and G. Moschelli, arXiv:0806.4718[nucl-th].
- (23) N. Armesto, C. Salgado, U.A. Wiedemann, Phys Rev. Lett. 93, 242301 (2004).
- (24) P. Romatschke, Phys. Rev. C. 75, 014901 (2007).
- (25) E. Shuryak, Phys. Rev. C. 76, 047901 (2007).
- (26) A. Dumitru, Y. Nara, B. Schenke, M. Strickland, arXiv:0710.1223[hep-ph].
- (27) V.S. Pantuev, arXiv:0710.1882[hep-ph].
- (28) R. Mizukawa, T. Hirano, M. Isse, Y. Nara, A. Ohnishi, arXiv:0805.2795[nucl-th].
- (29) C.Y. Wong, arXiv:0806.2154[hep-ph].
- (30) R.C. Hwa, arXiv:0708.1508[nucl-th].
- (31) J. Putschke, J.Phys. G: Nucl. Part. Phys. 34, S679 (2007).
- (32) C. Vafa, E. Witten, Phys. Rev. Lett. 53, 535 (1984), Nucl. Phys. B 234, 173 (1984).
- (33) D. Kharzeev, R.D. Pisarski, M.H.G. Tytgat, Phys. Rev. Lett. 81, 512 (1998).
- (34) C. Vafa, E. Witten, Nucl. Phys. B 233, 422 (1983).
- (35) J. Wess, and B. Zumino, Phys. Lett. 37B, 95 (1971)
- (36) L.E. Finch et al., Phys. Rev. C 65, 014908 (2001).