The LkH 101 Cluster
Abstract
In the infrared, the heavily reddened LkH 101 is one of the brightest young stars in the sky. Situated just north of the Taurus-Auriga complex in the L1482 dark cloud, it appears to be an early B-type star that has been serendipitously exposed during a rarely observed stage of early evolution, revealing a remarkable spectrum and a directly-imaged circumstellar disk. While detailed studies of this star and its circumstellar environment have become increasingly sophisticated in the 50 years since Herbig (1956) first pointed it out, the true nature of the object still remains a mystery. Recent work has renewed focus on the young cluster of stars surrounding LkH 101, and what it can tell us about the enigmatic source at its center (e.g., massive star formation timescales, clustered formation mechanisms). This latter effort certainly deserves more intensive study. We describe the current knowledge of this region and point out interesting work that could be done in the future.
Harvard-Smithsonian Center for Astrophysics
60 Garden Street, Cambridge, MA, 02138, USA
1. Introduction
In a generalized sense, there are three distinct types of young star clusters: () high-mass star-forming regions with an associated extensive network of low-mass stars (e.g., Orion); () quiescent environments that host low-mass star formation exclusively (e.g., Taurus-Auriga); and () smaller clusters of low-mass stars surrounding one or a few A/B stars. Naturally, there is a continuum of such types, and the picture is not quite so simple. However, an important goal in this line of research is to generally understand the differences and commonalities between these cluster types in an effort to better explain the various clustered modes of star formation and their consequences. The LkH 101 cluster is an interesting example of the () type; a handful of B stars and a hundred or more low-mass stars with a dominant source (LkH 101) at the center. The remarkable central source and apparent young age for the cluster indicate that we have been afforded a fortuitous opportunity to investigate this formation mode at a very early time. In this chapter, we highlight various studies of the LkH 101 region, separated into sections focused on the local interstellar medium (Sect. 2), distance estimates (Sect. 3), the embedded young cluster (Sect. 4), and LkH 101 itself (Sect. 5). We conclude with a brief preview of a new, comprehensive multiwavelength study of the region, and summarize the information with an eye toward future studies (Sect. 6).
2. The Interstellar Material
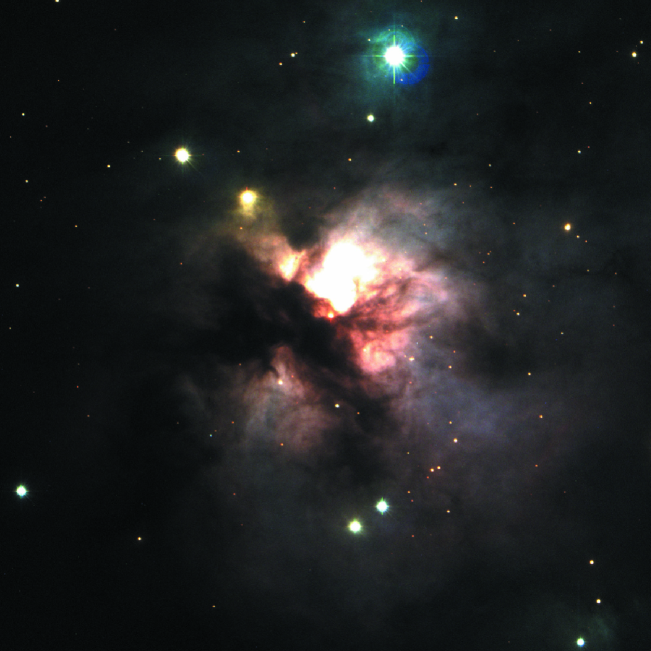
LkH 101 is located just north of the Taurus-Auriga complex (, [J2000]; , ) in the L1482 dark cloud. As Figure 1 demonstrates, the examination of an optical image near LkH 101 reveals a complex local interstellar environment. The most prominent feature is a dark lane which cuts across the southeastern corner of the reddened reflection nebula NGC 1579 (discovered by William Herschel in 1788), illuminated by the apparently faint red source LkH 101 near the image center. Redman et al. (1986) argue that this dark lane is in the foreground and probably not associated with LkH 101. That argument is further supported by the interstellar H chemistry constraints in the vicinity of an intense radiation source (Brittain et al. 2004). The reflection nebula was [mis]identified as the H II region S222 because of its redness in the Palomar survey plates (Sharpless 1959). However, subsequent observations showed that the polarization pattern from dust scattering was consistent with a reflection nebula entirely illuminated by LkH 101 (Redman et al. 1986). A direct comparison of the optical spectrum of the nebula and LkH 101 confirms this conclusion (Herbig, Andrews, & Dahm 2004). The evidence for an actual H II region is only inferred from the radio continuum spectrum (e.g., Brown, Broderick, & Knapp 1976; Dewdney & Roger 1986; Becker & White 1988): none of the optical or infrared lines typical of such physical conditions are present in the spectra of the nebula or LkH 101 itself (Herbig et al. 2004). The latter probably could be explained if circumstellar material at high densities collisionally deexcites the standard forbidden emission lines.
Additional dark clouds to the north, south, and southwest were noted in coarse-resolution CO surveys of the region (Knapp et al. 1976; Redman et al. 1986; Barsony et al. 1990). The northern cloud is visible as a lip of material at the edge of the NGC 1579 nebula (see Fig. 1). Redman et al. (1986) present a schematic diagram of these various interstellar components (see their Fig. 8), and Herbig et al. (2004) discuss in some detail the small-scale structures in the medium immediately surrounding LkH 101. Star counts and multicolor photometry (Barsony, Schombert, & Kis-Halas 1991) show that extinction is higher to the east of LkH 101. In order of decreasing proximity to LkH 101, the basic interstellar environment consists of: a dense circumstellar disk/envelope; a small H II region; a reflection nebula (NGC 1579); an H I envelope (Dewdney & Roger 1982); and a dark cloud (L1482) within a molecular filament.
LkH 101 and its associated young cluster are embedded in this cloud filament, denoted TGU 1096 by Dobashi et al. (2005) and shown in Fig. 2, that extends northwest of the Taurus-Auriga complex ( pc; see the chapter in this volume by Kenyon, Gomez, & Whitney), and overlaps in projection with the more distant Per OB2 association ( pc; see the chapter in this volume by Bally et al.). Despite the apparent proximity of these two star-forming regions, the CO velocity of the filament is significantly different ( km s-1) than for Tau-Aur (+6 km s-1) and Per OB2 (+6-10 km s-1; Ungerechts & Thaddeus 1987). Clearly this filamentary cloud and its contents are kinematically distinct from the Tau-Aur and Per OB2 clouds. Moreover, Herbig et al. (2004) note that the interstellar Na I absorption lines toward two stars in the young cluster are double, with core velocities consistent with those of Per OB2 and material in the filamentary cloud. As noted by those authors, this suggests that the interstellar material, embedded cluster, and LkH 101 lie beyond the Per OB2 complex.

3. Distance Estimates
The sky-projected proximity of LkH 101 to both the Tau-Aur and Perseus regions might be expected to create some confusion in estimating the distance to this star and its associated young cluster. Herbig (1971) originally estimated pc based on spectra and photometry of 2 early-type (B) stars near LkH 101 that are associated with nebulosity. As discussed in Sect. 2, the interstellar medium signatures also appear consistent with a distance beyond the Perseus clouds ( pc; Ungerechts & Thaddeus 1987; Herbig et al. 2004). However, Stine & O’Neal (1998) argued that the radio luminosities of some cluster stars would be an order of magnitude larger than the mean for weak-lined T Tauri stars in Tau-Aur if the distance was as large as 800 pc. Given the location on the sky and this apparent radio luminosity discrepancy, Stine & O’Neal suggested a much smaller pc. Using high resolution infrared measurements, Tuthill et al. (2002) identified both a companion star and a circumstellar disk around LkH 101 (see Sect. 5). Given the proper motion of the companion and some model constraints on the star+disk mass, they find that -500 pc can best explain the data, with a favored value pc. Most recently, Herbig et al. (2004) extended the spectroscopic parallax measurements to 40 young cluster stars with a wide range of spectral types (from mid-M to early B) to estimate a larger distance, pc.
Obviously, a definitive conclusion has yet to be reached. In the meantime, it would pay to consider the various pieces of observational evidence in a self-consistent manner. Perhaps the most straight-forward distance estimate comes from the spectroscopic parallax determinations of cluster members. These measurements converge on a mean distance of 700 pc; and, although there is a scatter around this value of approximately pc, there are no individual measurements consistent with a distance as low as 160 pc. We can turn to the H-R diagram for a consistency check on these values using the derived cluster age (see Sect. 4). Interstellar reddening uncertainties will not significantly affect the age determination because the reddening vector is roughly parallel to the isochrones. Therefore, the adopted distance acts to set the cluster age. As discussed further in Sect. 4, the cluster age is 1 Myr for pc. However, if the true distance were as close as pc, the inferred cluster age would be Myr, and therefore inconsistent with all the obvious indicators of youth that have been observed in the cluster (e.g., strong H emission, infrared excesses, etc.).
Along with the above age-consistency argument and the evidence from the interstellar signatures (Sect. 2), Herbig et al. (2004) cautioned against adopting the pc estimate advocated by Stine & O’Neal (1998) because only one of the four radio sources used by those authors is clearly associated with a weak-line T Tauri star. Further coupling this with the fact that none of the other 13 weak-line T Tauri stars in the LkH 101 cluster were detected in the radio continuum, a comparison of the cluster radio luminosities with the Tau-Aur weak-line T Tauri star mean luminosity does not present a convincing argument for a small cluster distance. Instead, the preponderance of evidence suggests a large cluster distance, with most observational constraints in agreement with -700 pc.
4. The Embedded Young Cluster
The first hints of an embedded young star cluster in this region came serendipitously from a radio study of the LkH 101 stellar wind (Becker & White 1988). The radio map revealed a “necklace” of faint point sources surrounding the central star that in some cases appeared to be associated with optically detected low-mass stars. Those initial observations were revisited by Stine & O’Neal (1998), who identified more than a dozen compact sources, some of them exhibiting flaring gyrosynchrotron emission similar to those seen around weak-line T Tauri stars in Tau-Aur (e.g., Chiang, Phillips, & Lonsdale 1996).
Detailed multiwavelength observing campaigns were conducted soon after the radio discovery (Barsony et al. 1990, 1991), including broadband optical and infrared imaging, millimeter spectral line maps, and millimeter interferometry of the LkH 101 circumstellar environment. Those studies first claimed a large infrared clustering of stars near LkH 101, with an apparent age gradient indicating that the central star was quite young (105 yr). The latter conclusion remains somewhat an open question, due to the bright and spatially variable nebulosity in the vicinity of the hot star. These initial near-infrared images were then supplemented with -band photometry to better determine the circumstellar properties of the stars in the cluster (Aspin & Barsony 1994). The color-color analysis in that study suggested that 30% of the surveyed stars had excess thermal emission from the inner regions of circumstellar dust disks. This -band excess fraction would be low for the apparent young age of the cluster (see below), according to the fairly well-established correlation noted by Haisch, Lada, & Lada (2001) and others. However, the completeness limit of these observations is difficult to estimate due to the bright infrared nebulosity in the region.

More recently, Herbig et al. (2004) presented a comprehensive look at the embedded cluster and LkH 101 itself using optical and infrared imaging and spectroscopy. Deep imaging (see Fig. 1) enabled these authors to perform a standard analysis of the H-R diagram in an attempt to determine the cluster age. Figure 3 shows their reddening-corrected , color-magnitude diagram for the cluster, along with some representative theoretical premain-sequence isochrones (D’Antona & Mazzitelli 1997). Supplementary spectroscopic data revealed 35 H emission line stars (excluding LkH 101) scattered around the cluster. Thirteen (40%) of these H emission line stars have equivalent widths less than 10 Å (i.e., are weak-line T Tauri stars). The identifications of Herbig et al. (2004), celestial coordinates, representative optical and near-infrared magnitudes, and H classifications (W = weak-line, C = classical T Tauri stars) are listed in Table 1 for reference.
| #a | [J2000] | [J2000] | Hb | excessc | ||
|---|---|---|---|---|---|---|
| 10 | 04 29 56.35 | +35 17 43.0 | ….. | 14.31 | W | |
| 27 | 04 29 58.61 | +35 16 17.4 | 20.99 | ….. | C | ….. |
| 30 | 04 29 59.19 | +35 18 48.6 | 21.80 | ….. | C | ….. |
| 32 | 04 29 59.72 | +35 13 34.3 | 15.73 | ….. | W | ….. |
| 44 | 04 30 00.63 | +35 17 18.4 | 18.08 | 11.40 | W | ….. |
| 63 | 04 30 02.21 | +35 17 16.8 | ….. | 16.23 | W | ….. |
| 70 | 04 30 03.20 | +35 14 21.5 | 21.69 | 13.33 | W | ….. |
| 72 | 04 30 03.58 | +35 16 38.0 | 18.19 | 11.86 | W | ….. |
| 78 | 04 30 04.16 | +35 16 27.5 | 20.10 | 11.98 | C | ….. |
| 83 | 04 30 04.62 | +35 15 01.6 | 22.08 | 13.12 | C | |
| 95 | 04 30 05.89 | +35 17 02.7 | 19.70 | 12.28 | C | |
| 100 | 04 30 06.65 | +35 17 53.1 | 20.19 | 12.58 | C | ….. |
| 105 | 04 30 07.43 | +35 14 58.6 | 16.71 | ….. | C | ….. |
| 107 | 04 30 07.50 | +35 17 54.4 | 18.32 | 11.38 | W | ….. |
| 111 | 04 30 07.75 | +35 15 49.0 | 18.38 | 11.18 | C | |
| 112 | 04 30 07.82 | +35 14 09.7 | 17.84 | 11.77 | C | ….. |
| 118 | 04 30 08.36 | +35 14 39.8 | 17.63 | 10.11 | W | ….. |
| 122 | 04 30 08.74 | +35 14 38.3 | 17.15 | ….. | C | ….. |
| 126 | 04 30 08.97 | +35 14 33.3 | 19.51 | 10.83 | C | ….. |
| 132 | 04 30 09.43 | +35 17 41.0 | 20.33 | 12.05 | C | |
| 139 | 04 30 09.85 | +35 14 17.1 | 19.83 | 12.57 | C | |
| 140 | 04 30 09.92 | +35 15 54.7 | 18.85 | 10.61 | C | |
| 151 | 04 30 10.59 | +35 16 56.2 | 18.81 | ….. | C | ….. |
| 157 | 04 30 11.08 | +35 16 04.0 | ….. | 11.52 | C | |
| 180 | 04 30 13.05 | +35 13 59.5 | 12.97 | ….. | W | ….. |
| 187 | 04 30 13.41 | +35 18 11.4 | 18.09 | ….. | W | ….. |
| 192 | 04 30 14.26 | +35 17 51.9 | 20.20 | 12.94 | W | |
| 194 | 04 30 14.44 | +35 16 24.5 | 13.33 | ….. | C | ….. |
| 205 | 04 30 15.64 | +35 17 38.4 | 21.18 | 10.94 | C | |
| 215 | 04 30 16.56 | +35 15 42.7 | 19.40 | 11.59 | C | ….. |
| 225 | 04 30 17.24 | +35 15 38.8 | 16.10 | 10.01 | W | ….. |
| 233 | 04 30 18.06 | +35 18 18.8 | 20.75 | ….. | W | ….. |
| 243 | 04 30 19.35 | +35 14 00.7 | 20.81 | ….. | C | ….. |
| 253 | 04 30 19.79 | +35 14 21.9 | 20.07 | 12.79 | C | ….. |
| 303 | 04 30 30.41 | +35 18 34.4 | 20.19 | ….. | C | ….. |
| 304 | 04 30 30.49 | +35 17 45.5 | 20.07 | 11.80 | C | ….. |
| a Numbering system in machine-readable Table 1 of Herbig et al. (2004). LkH 101 = 194. | ||||||
| b H emission line classification: W = weak line T Tauri star, C = classical T Tauri star. | ||||||
| c A check mark notes the presence of emission in excess of the photosphere at 2.2 m. | ||||||
Classification spectra for 40 low-mass stars were compared with optical colors to infer a mean cluster distance of 700 pc and visual extinction of 3.5 magnitudes. This spectroscopic parallax distance is in agreement with the earlier type stars in the cluster (see Herbig et al. 2004, their Fig. 6). Although a large spread in color-magnitude space exists within the cluster, the H emission line stars (marked with crosses in Fig. 3) have a median age around 0.5 Myr using the aforementioned properties and isochrones.
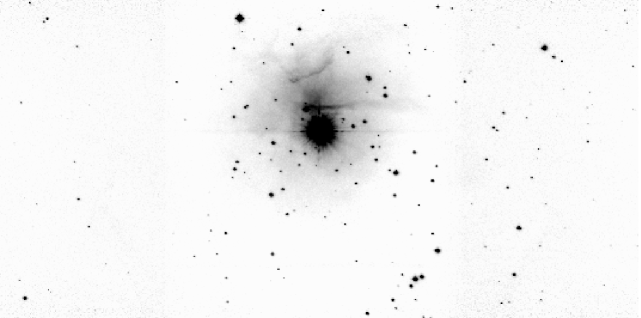

In addition to these optical data, Herbig et al. (2004) obtained a deep () set of images of the region in an effort to search for the near-infrared excesses characteristic of the warm inner regions of circumstellar disks. A -band mosaic image of the region is shown in Figure 4. Using the near-infrared , color-color diagram exhibited in Figure 5, these authors inferred that 60 sources had an excess at 2.2 m; most of those are listed separately in Table 2, along with their positions and -band magnitudes. Haisch, Lada, & Lada (2000) have pointed out, however, that excesses determined for such short wavelengths may not be representative of inner disk emission for a number of reasons: of particular concern here is the bright infrared nebulosity. Of these excess stars, 8 have and 18 others have . This is in general agreement with the suggestions of Barsony et al. (1991) and Aspin & Barsony (1994) that an even younger, more embedded, population of stars may exist in the material surrounding LkH 101.
| #a | [J2000] | [J2000] | #a | [J2000] | [J2000] | ||
|---|---|---|---|---|---|---|---|
| 6 | 04 29 55.82 | +35 16 40.0 | 15.07 | 184 | 04 30 13.17 | +35 16 33.6 | 15.32 |
| 22 | 04 29 58.25 | +35 15 35.3 | 14.68 | 188 | 04 30 13.44 | +35 15 41.5 | 14.98 |
| 34 | 04 29 59.94 | +35 15 15.3 | 14.62 | 197 | 04 30 15.17 | +35 15 30.6 | 15.24 |
| 46 | 04 30 00.76 | +35 17 57.7 | 14.33 | 198 | 04 30 15.20 | +35 16 40.4 | 10.17 |
| 50 | 04 30 01.24 | +35 14 29.2 | 14.41 | 200 | 04 30 15.27 | +35 16 33.3 | 12.28 |
| 82 | 04 30 04.59 | +35 16 04.4 | 12.45 | 211 | 04 30 16.11 | +35 16 10.0 | 12.50 |
| 89 | 04 30 05.52 | +35 17 08.2 | 14.76 | 212 | 04 30 16.30 | +35 15 24.7 | 11.86 |
| 117 | 04 30 08.24 | +35 14 10.7 | 13.33 | 214 | 04 30 16.46 | +35 14 38.9 | 14.40 |
| 133 | 04 30 09.51 | +35 14 41.1 | 12.95 | 222 | 04 30 17.13 | +35 16 16.3 | 10.38 |
| 141 | 04 30 09.97 | +35 15 38.4 | 11.44 | 226 | 04 30 17.25 | +35 16 03.8 | 13.20 |
| 150 | 04 30 10.57 | +35 16 50.3 | 10.21 | 228 | 04 30 17.37 | +35 15 21.4 | 15.93 |
| 154 | 04 30 10.89 | +35 16 13.3 | 13.93 | 229 | 04 30 17.55 | +35 16 26.6 | 13.31 |
| 155 | 04 30 10.94 | +35 16 21.3 | 14.21 | 230 | 04 30 17.74 | +35 17 13.7 | 13.38 |
| 167 | 04 30 11.76 | +35 16 31.7 | 11.00 | 232 | 04 30 17.92 | +35 16 08.4 | 13.24 |
| 168 | 04 30 12.19 | +35 14 51.0 | 13.77 | 236 | 04 30 18.68 | +35 16 42.9 | 12.46 |
| 170 | 04 30 12.23 | +35 15 47.3 | 12.65 | 237 | 04 30 18.80 | +35 16 41.9 | 11.88 |
| 173 | 04 30 12.34 | +35 16 28.4 | 10.70 | 244 | 04 30 19.39 | +35 15 57.3 | 10.92 |
| 175 | 04 30 12.77 | +35 17 21.3 | 11.72 | 247 | 04 30 19.46 | +35 16 34.9 | 11.80 |
| 178 | 04 30 13.01 | +35 16 33.3 | 12.66 | 284 | 04 30 26.96 | +35 14 49.0 | 15.53 |
| 181 | 04 30 13.08 | +35 15 18.8 | 15.52 | 288 | 04 30 27.99 | +35 15 15.7 | 13.80 |
| 182 | 04 30 13.09 | +35 16 31.2 | 14.80 | 292 | 04 30 28.54 | +35 15 51.1 | 15.71 |
| a Numbering system of Herbig et al. (2004). | |||||||
5. LkH 101
Since Herbig’s (1956) identification of LkH 101 as the illuminating source of the NGC 1579 reflection nebula, this still-enigmatic object has become one of the most thoroughly studied young stars in the sky. Early spectroscopic observations identified a remarkably strong H emission line (equivalent width of 550 Å; Herbig et al. 2004) and a series of other atomic emission features, dominated by permitted and forbidden lines of singly-ionized iron (Herbig 1956, 1971; Allen 1973; Thompson & Reid 1976). Assuming pc, the position of LkH 101 in an H-R diagram is consistent with an early B star (B0 or B1) on or near the main-sequence with a visual extinction of roughly 10 magnitudes (Herbig et al. 2004). Extinction estimates for the source vary significantly, but lies comfortably in the center of the range of values. This spectral classification is in good agreement with that implied by the radio continuum observations, which require a Lyman continuum flux from a B0.5 main-sequence star to explain the observed H II region emission (Harris 1976; Brown et al. 1976; Becker & White 1988; Hoare et al. 1994; Hoare & Garrington 1995). Despite these hints at the underlying radiation source, no stellar absorption features have ever been clearly seen for LkH 101 (Herbig et al. 2004). There is no direct spectroscopic evidence with which to classify the LkH 101 photosphere.
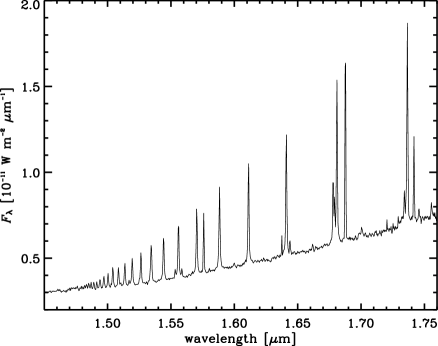
Many of the spectroscopic studies of LkH 101 have focused on understanding the physical conditions in the region(s) where the emission line spectrum is generated. In the near-infrared (1-5 m), the spectrum is dominated by H I lines in the Paschen and Brackett series, along with various transitions of He I, Fe II, O I, and Mg II, among others (Thompson & Reid 1976; Thompson et al. 1976, 1977; Simon & Cassar 1984; Hamann & Persson 1989; Rudy et al. 1991). The optical spectrum has similar contributors (Hamann & Persson 1989; Kelly, Rieke, & Campbell 1994; Herbig et al. 2004). The oxygen and magnesium lines are thought to be excited by Bowen fluorescence from Ly photons from the hot star (Hamann & Persson 1989). From this and the presence of high Paschen and Balmer series lines, some of which are shown in Figure 6, it is clear that the emission-line spectrum is at least partially generated in a high density, circumstellar environment.
Similar conclusions are reached based on forbidden emission line ratios (Kelly et al. 1994; Herbig et al. 2004) and the slope of the radio continuum (Brown et al. 1976). Hamann & Persson (1989) and Herbig et al. (2004) explored the possibility that electron scattering in such a dense circumstellar environment could broaden the standard early-type photospheric absorption lines into the continuum. The latter authors have ruled this out, and so the absence of these lines remains an unresolved issue. However, for photons to escape and produce the observed H II region, the star cannot be completely enveloped in such high-density material; the circumstellar emission line region must be geometrically anisotropic (e.g., Simon & Cassar 1984; Hamann & Persson 1989). These spectroscopic properties have led to comparisons of LkH 101 and evolved massive stars which have moved off the main-sequence (e.g., Car, MWC 300, MWC 349; Herbig 1971; Allen 1973; Thompson & Reid 1976; Hamann & Persson 1989). While acknowledging the very different evolutionary states of these objects and LkH 101, the physical structures responsible for their similar spectra are likely the same: stellar winds and the irradiation of a dense circumstellar disk.
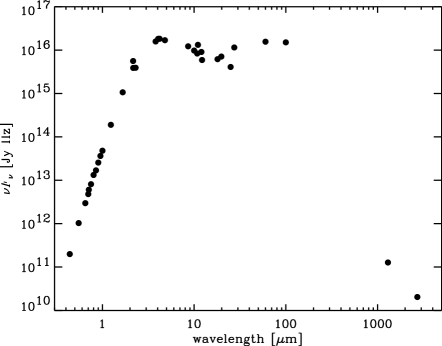
The broadband spectral energy distribution (SED) of LkH 101, displayed in Figure 7, shows a large infrared excess indicative of thermal continuum emission from circumstellar dust. Danen, Gwinn, & Bloemhof (1995) argued that the dip in the SED between 10 and 20 m is not easily explained by the standard circumstellar disk models (e.g., Adams, Lada, & Shu 1987; Beckwith et al. 1990). However, this is not likely a significant problem, as the large beam sizes for long-wavelength data often result in flux overestimates from extended emission or the excess emission from other nearby young stars in the cluster. Regardless, the 10 m observations of Danen et al. indicated a very small emission source size (50 mas) and warm characteristic dust temperature (1000 K). Using the OVRO interferometer, Barsony et al. (1990) detected unresolved thermal continuum emission ( mJy) at 3 mm from this circumstellar dust. With the standard optically thin, isothermal dust assumptions and opacity law (e.g., Andrews & Williams 2005), the corresponding mass of circumstellar material (gas and dust) is estimated to be 1-2 M⊙, or roughly 10% of the proposed stellar mass.
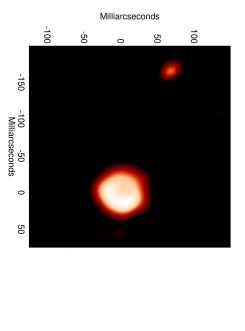
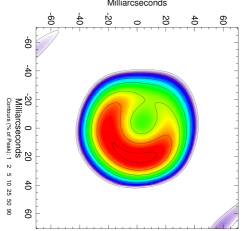
The remarkably bright infrared emission from LkH 101 () made it an ideal test subject for the rapidly developing technologies involved in very high-resolution infrared imaging. In a pioneering study by Tuthill, Monnier, & Danchi (2001), high angular resolution images showed that the infrared emission originatesin a nearly face-on, resolved (FWHM = 40 mas) disk structure with a large central cavity surrounding the star. These and other data were shown to be consistent with high-mass disk models that call for an inner region cleared by the sublimation of dust particles by high-energy stellar irradiation and a thick, flared geometry (Tuthill et al. 2001, 2002). Moreover, these same data showed that the infrared emission morphology of the disk actually changes with time and revealed the presence (and relative proper motion) of a faint, blue companion star 02 to the northeast. Figure 8 shows a wider field band image with the LkH 101 disk and this companion star, as well as a more detailed look at the disk morphology. Tuthill et al. (2002) used the motion of the companion star and properties of LkH 101 and its disk to estimate an intermediate distance to the source, pc. Herbig et al. (2004) noted that the disk geometry proposed by Tuthill et al. could account for the observed splitting of the optical Fe II lines, offering an interesting connection between the gas and dust in the inner disk.
6. Recent Results and Recommended Future Work
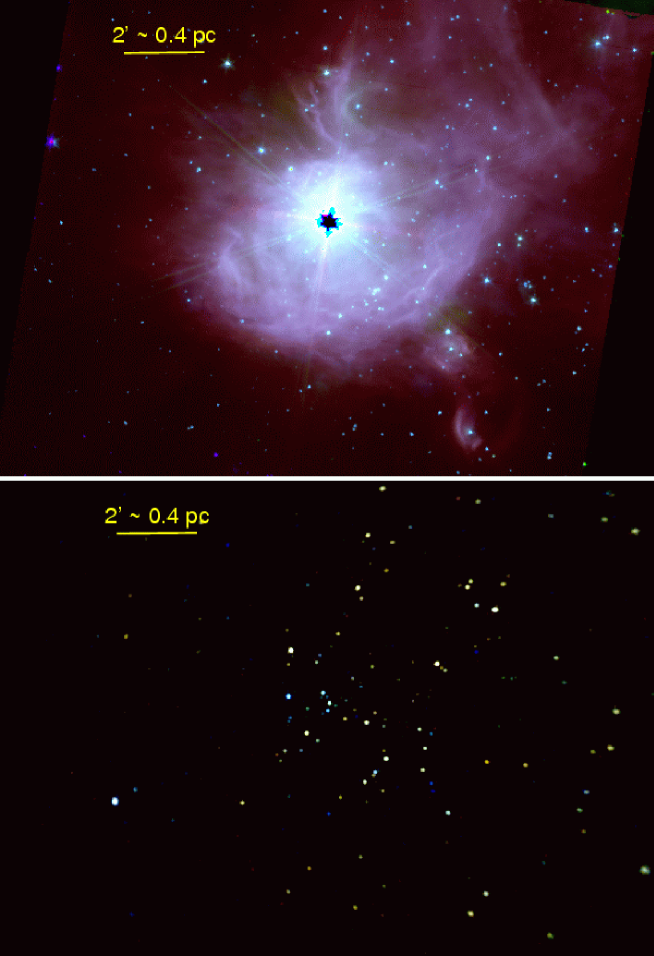
The embedded cluster around LkH 101 has been the object of much recent scrutiny, as the subject of an infrared survey with the Spitzer Space Telescope and a simultaneous campaign with the Chandra X-ray Observatory and the VLA (Wolk et al. 2008; Osten & Wolk 2008). Images from the Spitzer and Chandra observations are shown together in Figure 9. The mid-infrared Spitzer photometry reveals the presence of 16 protostars (Class I sources) and an additional 95 T Tauri stars (Class II sources), along with 9 “transition” objects that show large 24 m excesses but only photospheric emission at shorter wavelengths. The latter are widely interpreted to be circumstellar disks with evacuated inner regions. The Chandra observations identify an additional 65 X-ray sources coincident with infrared stars with near-photospheric colors, consistent with their association as more evolved (Class III) cluster members. This brings the total list of known cluster membership to 185, many of which are actively being confirmed spectroscopically (Winston et al. 2008).
In addition to identifying new members and characterizing their evolutionary states via their infrared excess properties, these new data can be utilized to estimate the total cluster size in two complementary ways. The first method exploits the empirical similarity of the X-ray luminosities from Class II and III sources (Feigelson & Montmerle 1999, and references therein). Using this assumption that the same fraction of Class II and III infrared sources should be detected with X-rays, the new observations imply that the 45% X-ray detection rate of Class II sources would translate to 82 undetected Class III sources. This estimate would bring the total cluster membership to 270 sources. The second method relies on the derived shape of the universal X-ray luminosity function (XLF) for young clusters asserted by Feigelson et al. (2005). If this universal XLF applies for the LkH 101 cluster, the total cluster membership should be in the range of 280-330 stars, and the smaller cluster distances are firmly ruled out in favor of values in the range -750 pc. The closer end of this range brings the two methods of estimating cluster membership numbers into good agreement.
This recent work is encouraging in its focus on establishing a firm cluster membership base for future work. Only when a relatively complete membership roster has been obtained can a more comprehensive analysis of the distance, age, initial mass function, circumstellar disk fraction, and other basic properties be derived. Although of less immediate importance, a closer examination of individual cluster members would certainly be interesting. Herbig et al. (2004) present a curious high-resolution spectrum of the bright, nebulous star immediately to the northeast of LkH 101 (their “Star D”, HBC 391; see Fig. 1), showing it to be an early K giant with a number of strange features. Those authors also note that none of the 5 B-type stars apparently associated with the same dark cloud (excluding LkH 101) show the standard signatures of youth noted for other Herbig Be stars.
Given the high concentration of infrared sources in the immediate vicinity of
LkH 101 noted by Herbig et al. (2004), high angular resolution infrared
images using adaptive optics would provide an interesting complement to the new
Spitzer data. Some of the most interesting cluster members may be
lurking in the tremendous glare of the central source, including the small
group of stars identified by Herbig et al. (2004) that lie at one end of a “bar”
of infrared nebulosity (see Fig. 4). Along these same lines, those interested
in the formation and evolution of massive stars and their disks should make a
concerted effort to follow up the high-resolution infrared work of Tuthill and
colleagues. High resolution (sub-arcsecond) millimeter observations of the
dust continuum and various molecular line transitions would aid tremendously in
interpreting the circumstellar environment around LkH 101. As with
many other clusters in this book, the LkH 101 region still holds a lot
of promise for future observations with more sensitive, higher resolution
instrumentation.
Acknowledgments.
S.A. is very grateful to George Herbig and Scott Dahm for useful conversations and advice. We would like to thank Peter Tuthill for kindly providing the images in Figure 8.
References
- Adams, Lada, & Shu (1987) Adams, F. C. & Lada, C. J., ApJ, 312, 788
- Allen (1973) Allen, D. A. 1973, MNRAS, 161, 1P
- Andrews & Williams (2005) Andrews, S. M. & Williams, J. P. 2005, ApJ, 631, 1134
- Aspin & Barsony (1994) Aspin, C. & Barsony, M. 1994, A&A, 288, 849
- Barsony et al. (1990) Barsony, M., Scoville, N. Z., Schombert, J. M., & Claussen, M. J. 1990, ApJ, 362, 674
- Barsony et al. (1991) Barsony, M., Schombert, J. M., & Kis-Halas, K. 1991, ApJ, 379, 221
- Becker & White (1988) Becker, R. H. & White, R. L. 1988, ApJ, 324, 893
- Beckwith et al. (1990) Beckwith, S. V. W., Sargent, A. I., Chini, R. S., & Güsten, R. 1990, AJ, 99, 924
- Brittain et al. (2004) Brittain, S. D., Simon, T., Kulesa, C., & Rettig, T. W. 2004, ApJ, 606, 911
- Brown et al. (1976) Brown, R. L., Broderick, J. J., & Knapp, G. R. 1976, MNRAS, 175, 87P
- Chiang, Phillips, & Lonsdale (1996) Chiang, E., Phillips, R. B., & Lonsdale, C. J. 1996, AJ, 111, 355
- Cohen & Woolf (1971) Cohen, M. & Woolf, N. J. 1971, ApJ, 169, 543
- Cutri et al. (2003) Cutri, R. M., et al. 2003, 2MASS All-Sky Catalog of Point Sources (Pasadena: IPAC)
- Danen, Gwinn, & Bloemhof (1995) Danen, R. M., Gwinn, C. R., & Bloemhof, E. E. 1995, ApJ, 447, 391
- D’Antona & Mazzitelli (1997) D’Antona, F. & Mazzitelli, I. 1997, in Cool Stars in Clusters and Associations, ed. G. Micela & R. Pallavicini (Firenze: Soc. Astron. Italiana), 807
- Dewdney & Roger (1982) Dewdney, P. E. & Roger, R. S. 1982, ApJ, 255, 564
- Dewdney & Roger (1986) Dewdney, P. E. & Roger, R. S. 1986, ApJ, 307, 275
- Dobashi et al. (2005) Dobashi, K., et al. 2005, PASJ, 57, SP1, S1
- Feigelson & Montmerle (1999) Feigelson, E. D., & Montmerle, T. 1999, ARA&A, 37, 363
- Feigelson et al. (2005) Feigelson, E. D., Getman, K., Townsley, L., Garmire, G., Preibisch, T., et al. 2005, ApJS, 160, 379
- Haisch, Lada, & Lada (2000) Haisch, K. E., Lada, E. A., & Lada, C. J. 2000, AJ, 120, 1396
- Haisch, Lada, & Lada (2001) Haisch, K. E., Lada, E. A., & Lada, C. J. 2001, ApJ, 553, L153
- Hamann & Persson (1989) Hamann, F., & Persson, S. E. 1989, ApJS, 71, 931
- Harris (1976) Harris, S. 1976, MNRAS, 174, 601
- Herbig (1956) Herbig, G. H. 1956, PASP, 68, 353
- Herbig (1971) Herbig, G. H. 1971, ApJ, 169, 537
- Herbig et al. (2004) Herbig, G. H., Andrews, S. M., & Dahm, S. E. 2004, AJ, 128, 1233
- Hoare et al. (1994) Hoare, M. G., Drew, J. E., Muxlow, T. B., & Davis, R. J. 1994, ApJ, 421, L51
- Hoare & Garrington (1995) Hoare, M. G., & Garrington, S. 1995, ApJ, 449, 874
- Kelly, Rieke, & Campbell (1994) Kelly, D. M., Rieke, G. H., & Campbell, B. 1994, ApJ, 425, 231
- Knapp et al. (1976) Knapp, G. R., Kuiper, T. B. H., Knapp, S. L., & Brown, R. L. 1976, ApJ, 206, 443
- Osten & Wolk (2008) Osten, R. A. & Wolk, S. J. 2008, ApJ, submitted
- Osterloh & Beckwith (1995) Osterloh, M., & Beckwith, S. V. W. 1995, ApJ, 439, 288
- Price & Murdock (1983) Price, S. D., & Murdock, T. L. 1983, The Revised AFGL IR Survey Catalog and Supplement (Air Force Geophys. Lab)
- Redman et al. (1986) Redman, R. O., Kuiper, T. B. H., Lorre, J. J., & Gunn, J. E. 1986, ApJ, 303, 300
- Rudy et al. (1991) Rudy, R. J., Erwin, P., Rossano, G. S., & Puetter, R. C. 1991, ApJ, 383, 344
- Sharpless (1959) Sharpless, S. 1959, ApJS, 4, 257
- Simon & Cassar (1984) Simon, M., & Cassar, L. 1984, ApJ, 283, 179
- Stine & O’Neal (1998) Stine, P. C., & O’Neal, D. 1998, AJ, 116, 890
- Thompson & Reid (1976) Thompson, R. I., & Reid, M. 1976, 205, L159
- Thompson et al. (1976) Thompson, R. I., Erickson, E. F., Witteborn, F. C., & Strecker, D. W. 1976, ApJ, 210, L31
- Thompson et al. (1977) Thompson, R. I., Strittmatter, P. A., Erickson, E. F., Witteborn, F. C., & Strecker, D. W. 1977, ApJ, 218, 170
- Tuthill et al. (2001) Tuthill, P. G., Monnier, J. D., & Danchi, W. C. 2001, Nature, 409, 1012
- Tuthill et al. (2002) Tuthill, P. G., Monnier, J. D., Danchi, W. C., Hale, D. D. S., & Townes, C. H. 2002, ApJ, 577, 826
- Ungerechts & Thaddeus (1987) Ungerechts, H., & Thaddeus, P. 1987, ApJS, 63, 645
- Weaver & Jones (1992) Weaver, W. B., & Jones, G. 1992, ApJS, 78, 239
- Winston et al. (2008) Winston, E. M., et al. 2008, ApJ, submitted
- Wolk et al. (2008) Wolk, S. J., et al. 2008, ApJ, submitted