Commissioning Run of the CRESST-II Dark Matter Search
Abstract
The CRESST cryogenic direct dark matter search at Gran Sasso, searching for WIMPs via nuclear recoil, has been upgraded to CRESST-II by several changes and improvements. The upgrade includes a new detector support structure capable of accommodating 33 modules, the associated multichannel readout with 66 SQUID channels, a neutron shield, a calibration source lift, and the installation of a muon veto. We present the results of a commissioning run carried out in 2007.
The basic element of CRESST-II is a detector module consisting of a large (300 g) crystal and a very sensitive smaller ( g) light detector to detect the scintillation light from the . The large crystal gives an accurate total energy measurement. The light detector permits a determination of the light yield for an event, allowing an effective separation of nuclear recoils from electron-photon backgrounds. Furthermore, information from light-quenching factor studies allows the definition of a region of the energy-light yield plane which corresponds to tungsten recoils. A neutron test is reported which supports the principle of using the light yield to identify the recoiling nucleus.
Data obtained with two detector modules for a total exposure of 48 kg-days are presented. Judging by the rate of events in the “all nuclear recoils” acceptance region the apparatus shows a factor ten improvement with respect to previous results, which we attribute principally to the presence of the neutron shield. In the “tungsten recoils” acceptance region three events are found, corresponding to a rate of 0.063 per kg-day. Standard assumptions on the dark matter flux, coherent or spin independent interactions, then yield a limit for WIMP-nucleon scattering of , at .
keywords:
Dark Matter , WIMP , Low-temperature detectors ,, , , , , , , , , , , , , , , , , , , , , , , , , , , , , , , , , , , , , , , , , and
1 Introduction
Evidence continues to grow that the majority of the mass of our galaxy and in the universe is made up of non-baryonic dark matter [1]. Precision measurements of the cosmic microwave background have given accurate figures for the density of matter and energy in the universe as a whole, suggesting that about a fourth of the energy density of the universe is in the form of dark matter [2]. Measurements of the rotation curves of other spiral galaxies, indicate large amounts of dark matter, which would suggest it also dominates our own galaxy. Gravitational lensing of light by galactic clusters indicates large amounts of dark matter, and dark matter is necessary for a reasonable description of the formation of galaxies.
Although some of these observations might also be explained by alternative theories such as modified Newtonian dynamics (MOND) [3], recent studies of the Bullet Cluster appear to favour the dark matter hypothesis [4]. However the need for direct detection of dark matter evidently remains strong.
A plausible origin for dark matter comes from particle physics in the form of WIMPs (weakly interacting massive particles). These would be stable massive particles with an interaction cross section typical for weak interaction processes. A relic density sufficient to make a significant contribution to the energy density of the universe arises naturally in this way. Supersymmetry provides a well motivated candidate in the form of the neutralino and this has been extensively studied theoretically.
According to the WIMP hypothesis a galaxy has a large gravitationally bound halo of such particles, making up most of the mass. The local mass density may be estimated from halo models and is found to be on the order of . The range of the coherent or spin-independent WIMP-nucleon scattering cross-sections predicted by minimal supersymmetric models extends from below to above [5, 6]; this makes the direct detection of such particles a difficult but in principle achievable task.
The CRESST project is a dark matter search aiming to detect the nuclear scattering of WIMPs by the use of cryogenic detectors. Since only small recoil energies ( keV’s) are anticipated in WIMP-nucleus scattering, cryogenic detectors with their high sensitivity are well suited to the problem.
CRESST-II is an upgrade of the original CRESST appartus where the detectors are arranged in modules, each consisting of two detectors, a large detector comprising the target mass and a similar but much smaller light detector measuring the light yield. While the large detector gives an accurate total energy measurement, the light yield measurement permits an effective rejection of events which are not nuclear recoils. This arises from the property of electron-photon events, constituting the dominant background, to give a much higher light output than nuclear recoils.
The large detector consists of a crystal of with a tungsten superconducting-to-normal thermometer deposited on the surface. The energy of an event is measured in this detector. The energy deposited in the crystal is quickly converted into a gas of phonons which are then absorbed in the superconducting thermometer. The separate light detector, based on the same principle, measures the simultaneously emitted scintillation light. A comparison of these two signals then allows an effective background discrimination.
Results from an earlier prototype run with two modules were presented in Ref. [7], where taking the better of the two modules and assuming coherent WIMP scattering on the tungsten led to the limit . The improvements discussed here are aimed at ultimately increasing this sensitivity by up to two orders of magnitude. Such an increase would result, for example, with background free data and a threshold of 12 keV from 10 kg for 100 days giving 1000 kg-days. Or if the threshold could be reduced to 5 keV, with 300 kg days.
During 2007 an extended commissioning run of the new setup was carried out. Although this was primarily for optimization purposes, the results also represent an interesting further improvement. We report on them and the modifications for CRESST-II in the present paper.
2 Experimental Setup
The detector volume of the CRESST installation at Gran Sasso is surrounded by passive shielding consisting of thick low background copper and of lead. This inner shielding is entirely enclosed within a gas-tight radon box which is continuously flushed with gas. This part of the setup is as used in previous phases of the experiment and is described in Ref. [8]. The changes made in the upgrade to CRESST-II include the installation of a neutron shield and a muon veto. Figure 1 shows the setup after the upgrade.
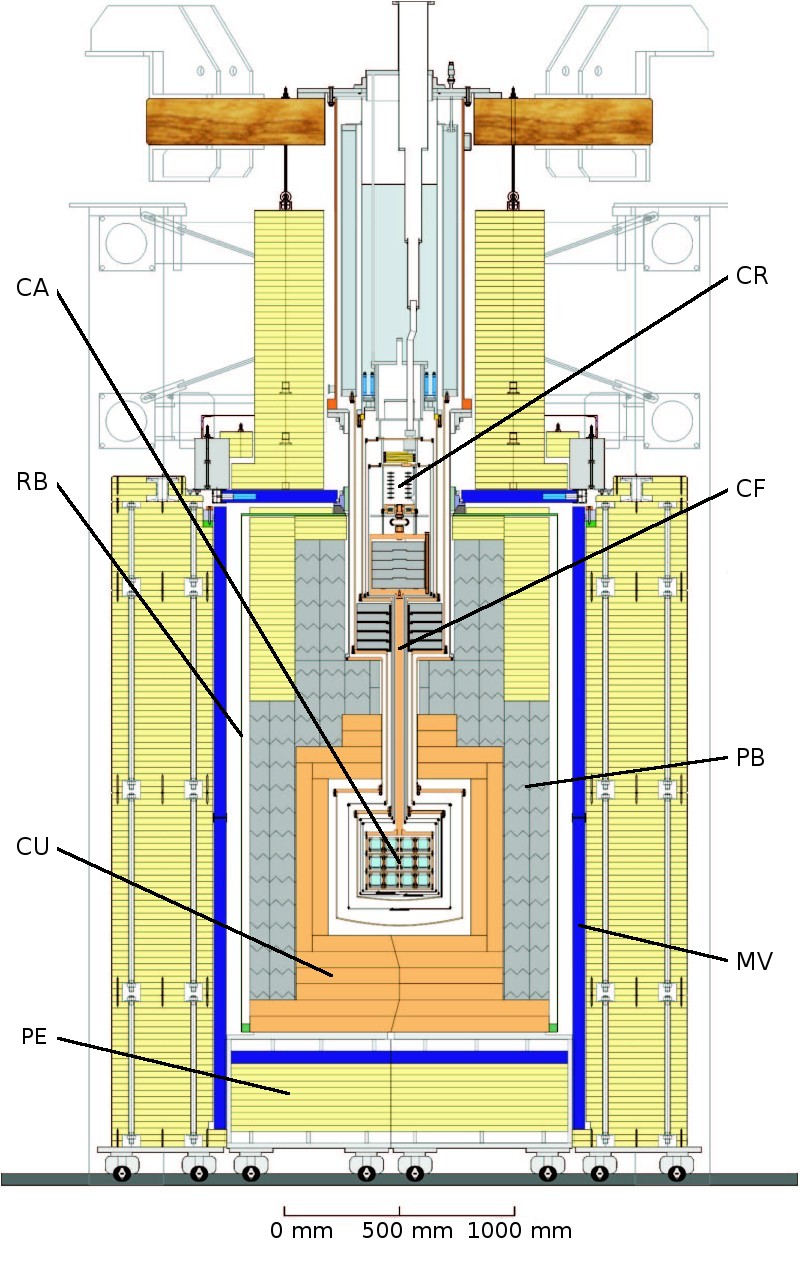
In the detector volume itself, a new detector support structure (“carousel”) capable of holding the 33 modules has been mounted and a new 66-channel SQUID readout with associated wiring and data acquisition electronics has been installed. The various changes will be discussed in this section.
2.1 Detector Support Structure (“Carousel”)
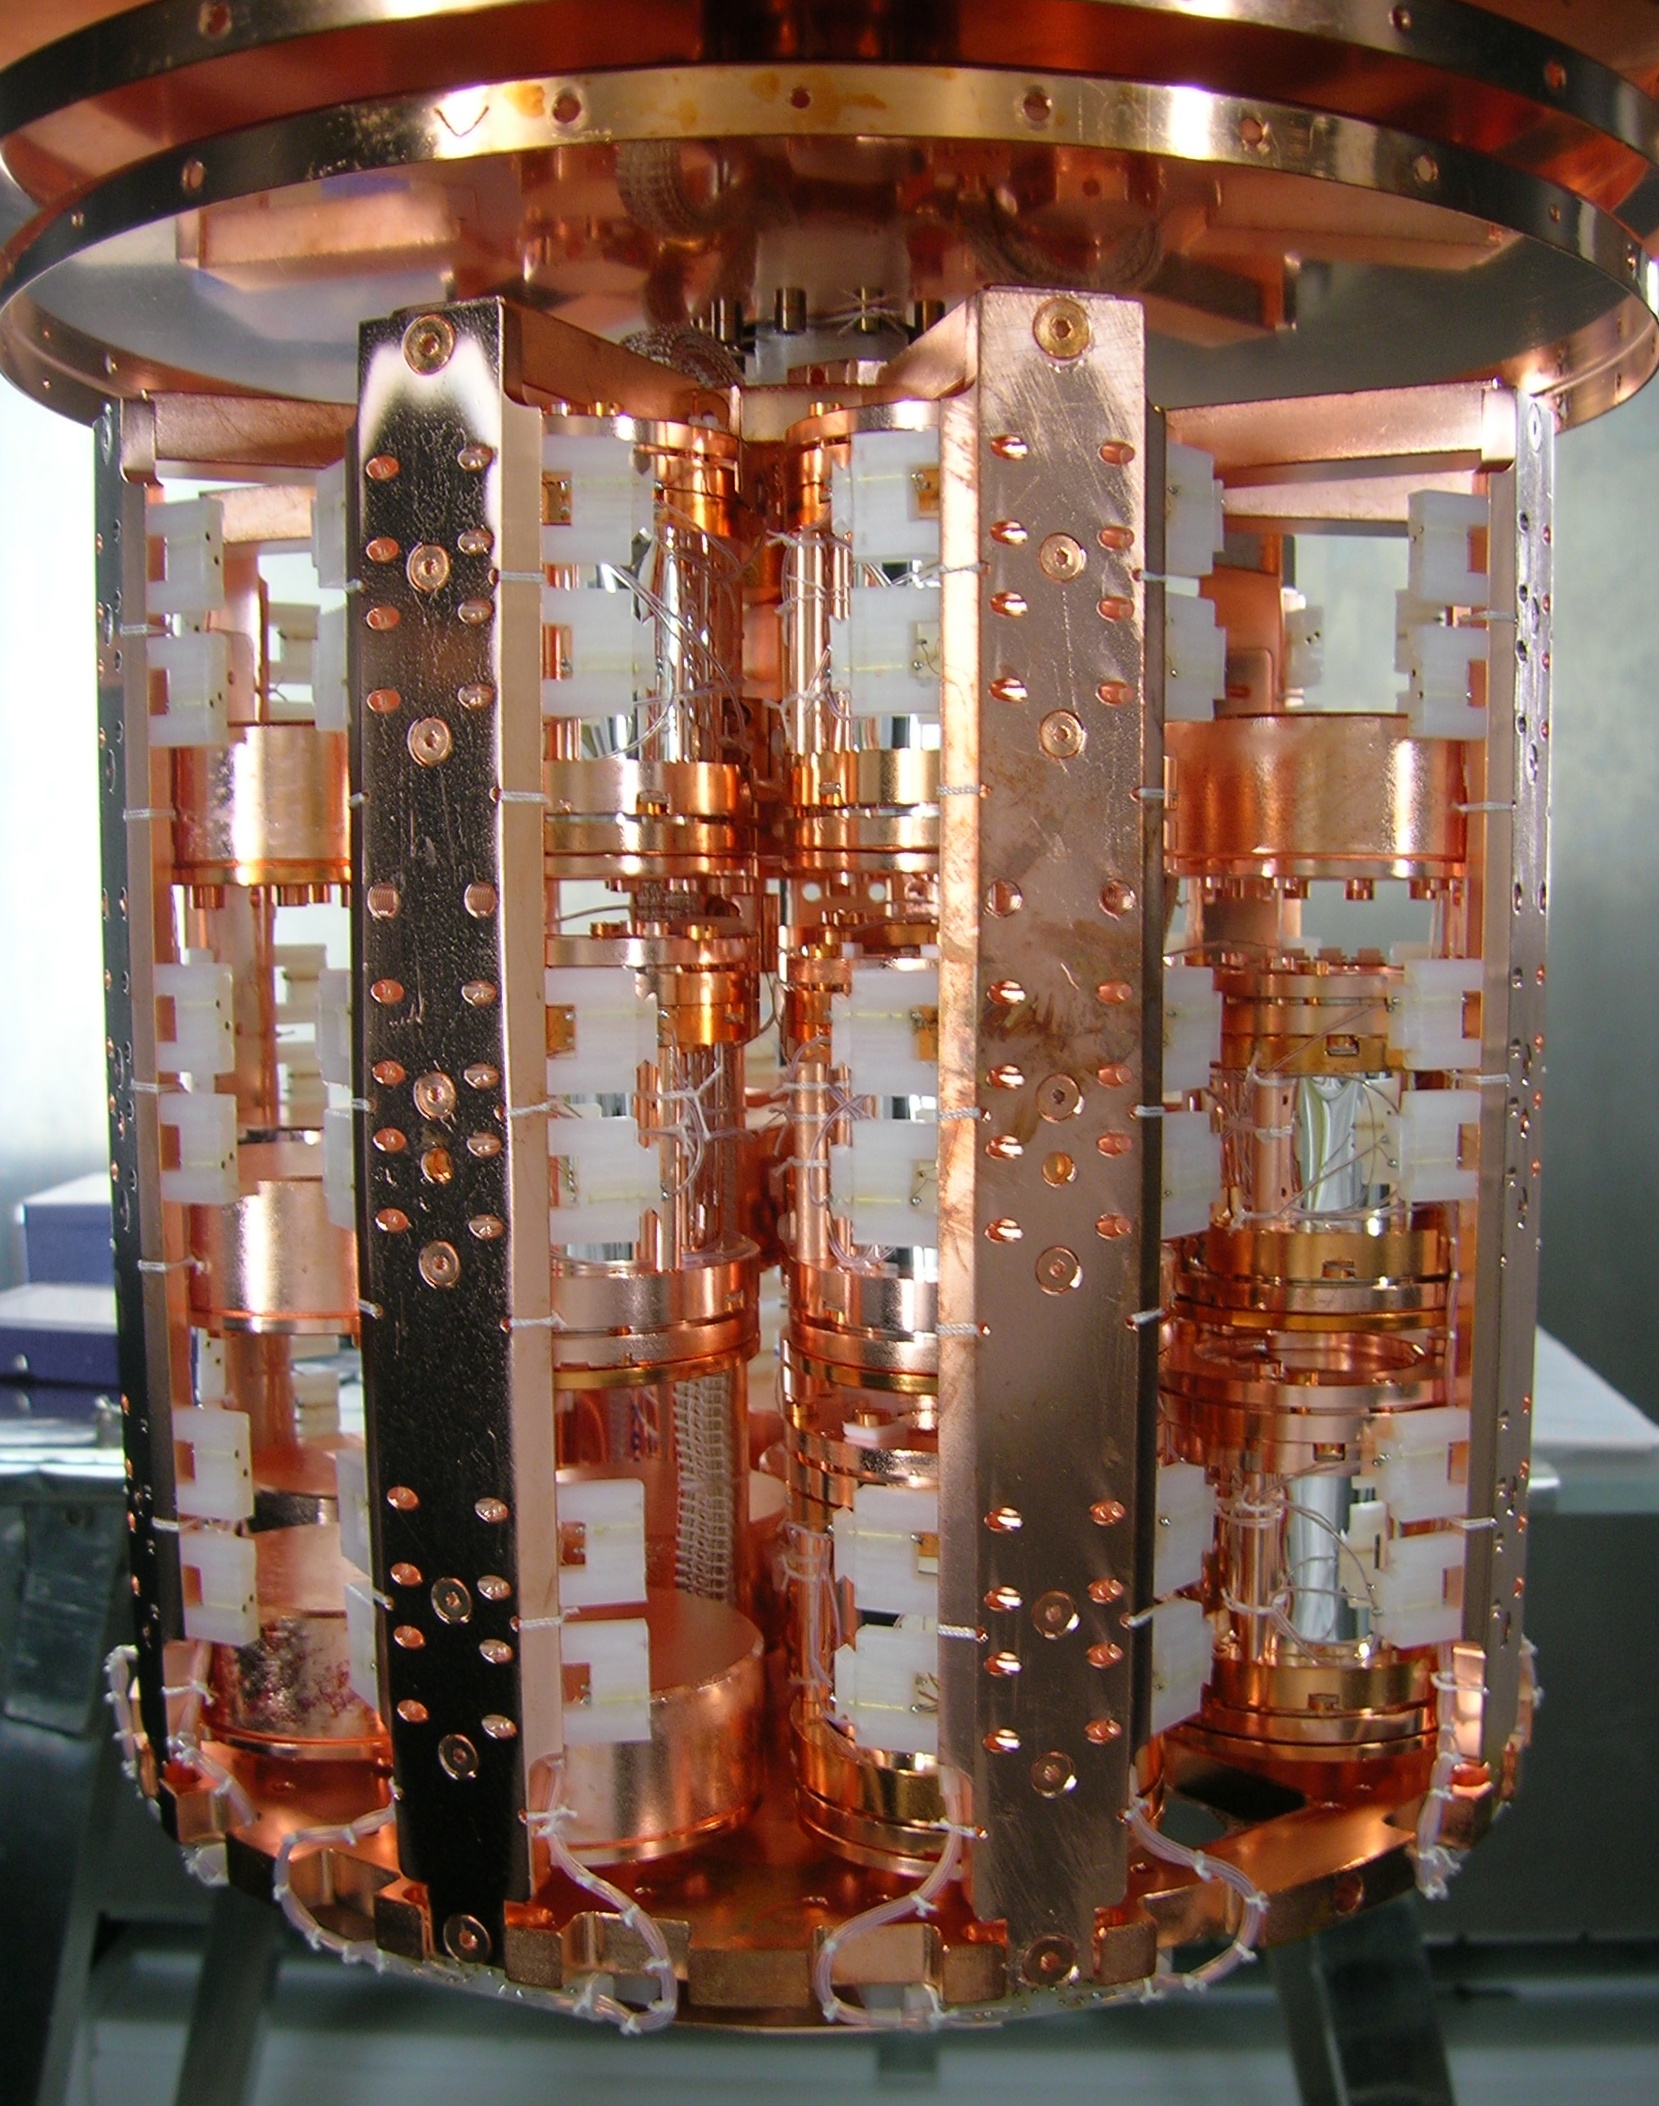
The new support structure for holding the detector modules is made from copper suitable for milliKelvin (mK) operation and electropolished to reduce surface contamination. The structure, which is depicted in Fig. 2, can accommodate a total of 33 detector modules, thus allowing an increase of the target mass by an order of magnitude (to ) relative to CRESST-I. Individual handling and dismounting of the modules is possible. The structure rests on custom-made CuSn6 springs [9] to reduce interference from vibrations. CuSn6 was chosen since it exhibits both intrinsic radiopurity and elasticity at mK temperatures. The thermal coupling of the carousel to the cold finger is intentionally set to be weak, with a relaxation time of about half an hour. This filters out high-frequency temperature variations of the cryostat, giving a high degree of temperature stability at the detectors.
2.2 Sixty-six channel SQUID readout
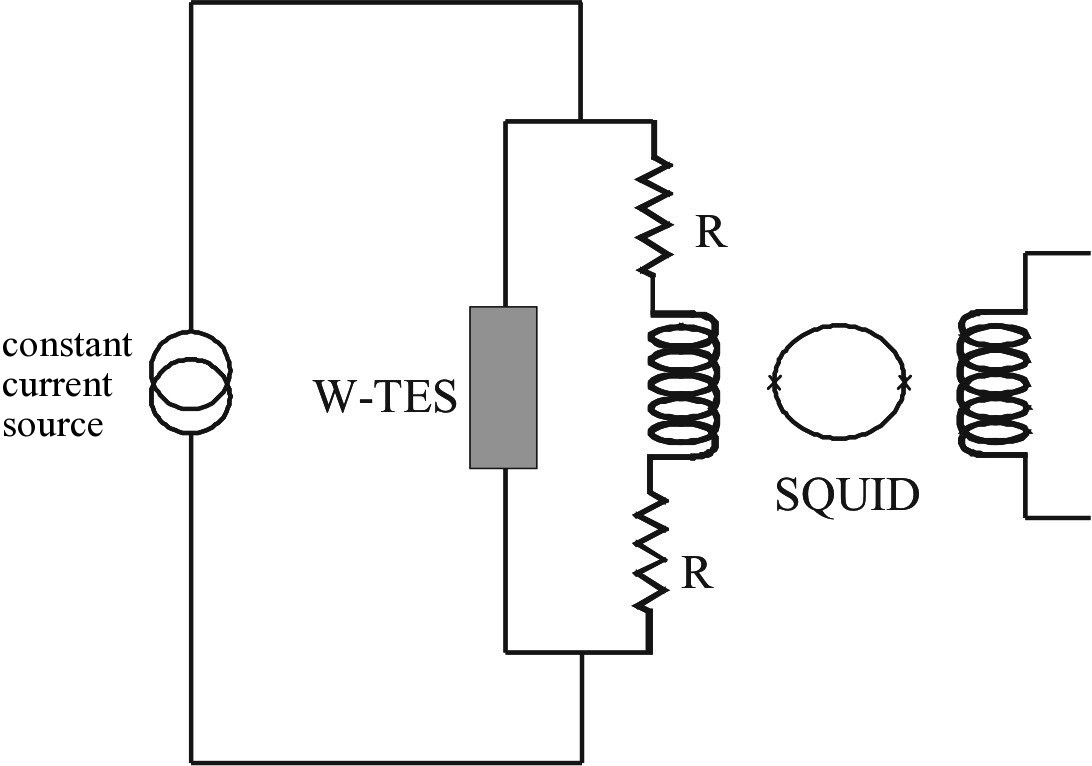
With the full complement of 33 modules, each with two superconducting thermometers, there will be 66 readout channels in CRESST-II. In the basic CRESST design these channels are read out with SQUID’s. Figure 3 shows one such readout circuit, simplified for clarity. The actual implementation is discussed in detail in Ref. [10]. A constant bias current is shared between two branches, one containing the tungsten thermometer, the other the input coil for a SQUID in series with two reference resistors. The reference resistors assure proper branching of the current; two are used here to make the circuit more balanced and to minimize the level of crosstalk. Any change in the resistance of the thermometer changes the current through the SQUID input coil. The SQUID system then transforms this signal to a voltage pulse, which is processed by conventional follow-on electronics. The SQUIDs are DC SQUIDs using AC modulated flux-locked loops. Full details of the system are given in [10].
To handle the large number of detectors, a multichannel system was installed, consisting of 66 SQUID units. These are located at the bottom of the main helium bath, at 4 K. Woven twisted pair cables are used to connect the SQUIDs to the detectors in the mK environment, while another set of cables leads to connector boxes at room temperature, which then link to the control electronics and the data aquisition system.
In addition to the readout-line pair for the SQUID, each thermometer has a heater-line pair for temperature control and calibration pulses. Thus there are two pairs of lines for each thermometer and so a total of eight lines per module. With the many lines into the mK environment close attention must be paid in the design and fabrication of flanges and feed-throughs [10][11].
2.3 Neutron Shield
A significant new element in the setup is a neutron shield, consisting of a thickness of polyethylene (PE) plates. The shield is mounted on rails to allow access to the inner parts of the experiment. The polyethylene moderates ambient neutrons to thermal energies where they are then captured on the hydrogen. The neutron capture range in materials is 4.3 cm for MeV energies [12], so the shield should eliminate essentially all incoming neutrons.
2.4 Calibration Source Lift
During a run, CRESST detectors are regularly calibrated with a radioactive source supplying gamma quanta of known energy. In view of the many and closely spaced detectors, in CRESST-II it is necessary to be able to move and position the radioactive source during calibration runs.
Therefore the apparatus has been equipped with a calibration source lift. The lift consists of a plastic tube through which the source is moved by compressed air, the position being determined by strings attached from both ends of the tube. It spirals around the cold box inside the shielding and allows calibration of individual detector modules without opening the shielding. It is designed so that a rate of can be generated at any detector module with a 0.7 MBq source. The system was used successfully several times during the commissioning run.
2.5 Muon Veto
With the aim of reducing the effects of muons entering the apparatus a muon veto has been installed. It consists of 20 plastic scintillator panels of area about surrounding the radon box and the Cu/Pb shielding. By using three different types of panels, a total solid angle coverage of 98.7 % is achieved. A circular opening of on top was unavoidable due to the entry for the cryostat (see Fig. 1). In a dedicated setup [13], the characteristics of each panel type were measured and calibrated. The photomultiplier signals are sent out of the Faraday cage optically to avoid interference with the cryogenic detectors. The veto triggered at Hz during the run.
3 Detectors
3.1 Module housing
An important feature of the CRESST detector modules is their ability to reject events which are not nuclear recoils via a simultaneous measurement of a heat/phonon signal in the large detector and a scintillation signal [14] in the light detector.
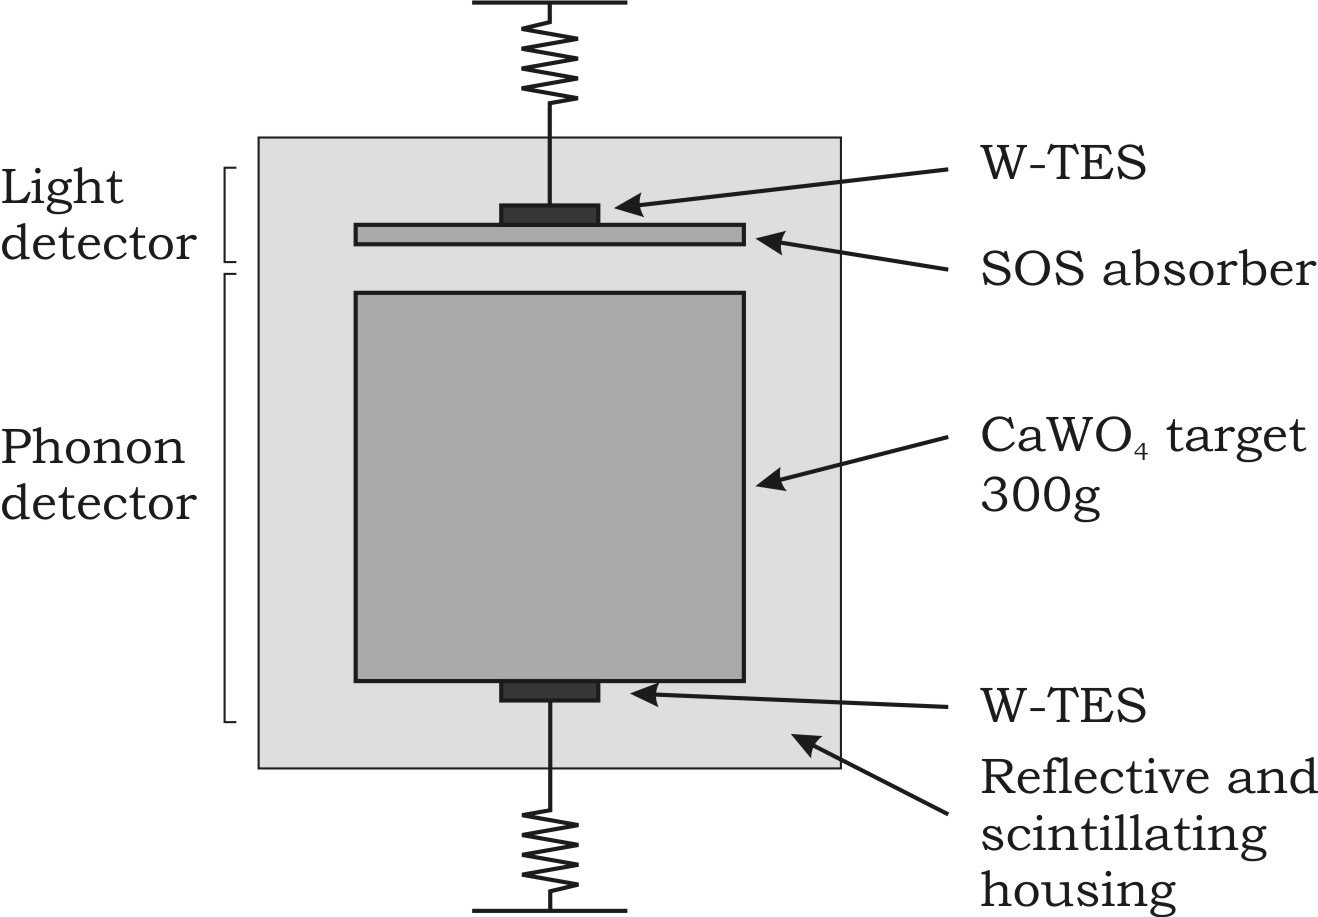
The crystal and the light detector are enclosed together in a reflective and scintillating housing (Fig. 4) of 3M foil, as described in Ref. [7]. This serves two purposes. Firstly, it increases the amount of light collected by the light detector. Secondly, its scintillation permits rejection of a potentially dangerous background from surface radioactivity on the crystal [15]. An important such possibility is polonium, a daughter of the radon decay chain with an alpha decay. If the alpha is lost and the recoiling lead nucleus stays in the crystal, this can mimic a tungsten recoil, i.e. a WIMP interaction. However, it was found that the scintillation of the alpha particle on the reflecting foil gives a light signal which discriminates events of this type and allows for their separation.
3.2 Thermometers (TES’s)
The basic sensor in CRESST is a superconducting thin film thermometer, with the temperature stabilized at a suitable operating point in the middle of the superconducting-to-normal transition of the film . A small variation of the film resistance in such an arrangment gives a very sensitive temperature measurement; this system is often called a Transition Edge Sensor (TES) .
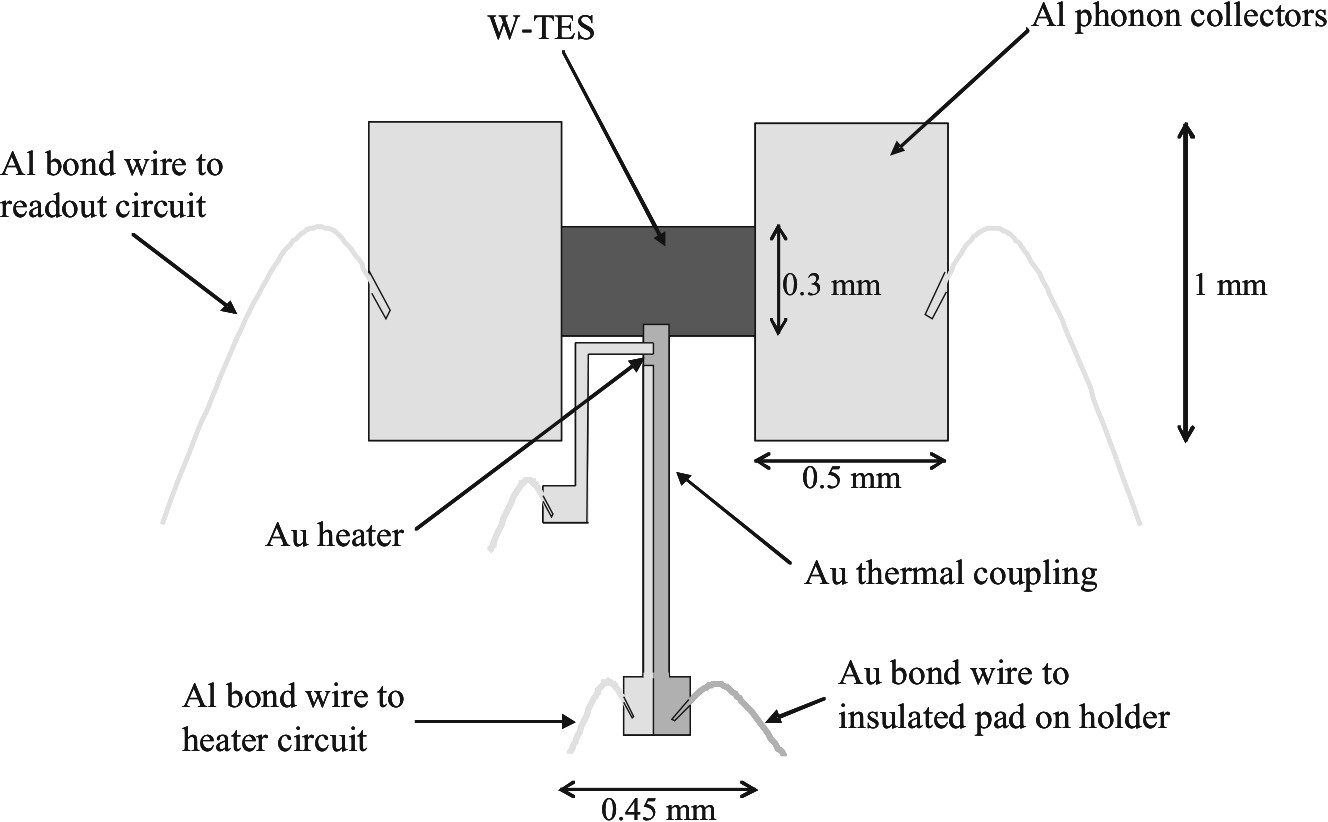
In the work described here tungsten thin films are used. Tungsten in its crystalline phase becomes superconducting at . The films are equipped with heaters with the dual function of stabilizing the detectors’ operating points and the injection of heat pulses for calibration. The thermometer layouts for the target and the light detector are similar. However, the light detector has additional Al/W phonon collectors for better energy collection. This is as described in ref. [7], but here the light detectors use a small portion of the thermal-link gold structure as the heater. This light detector layout is shown in Fig. 5.
For temperature regulation heater pulses of a fixed amplitude, so-called control pulses are injected through the heater lines every three seconds. Online pulse height evaluation of the resulting signal is used for regulation of the heater current which keeps the thermometer’s temperature at the operating point. This is somewhat different from older work where temperature stabilization was on the baseline, and is found to provide excellent long term stability of operation. In addition to these control pulses for temperature stabilization, calibration pulses delivering a known energy are injected every 30 seconds. These are used in determining the energy to be identified with a pulse, as will be explained in section 4.2. The calibration and stabilization procedures are the same for both target and light detector thermometers.
3.3 Target Detector
The CRESST-II detectors use large single crystals as the target or “absorber” mass. has been selected for its high light output and the presence of the heavy nucleus tungsten, which gives a large factor in the presumed coherent (spin-independent) scattering of the WIMP. The crystals are cylindrical, of height and diameter, and about in weight.
Ten such crystals were installed for the commissioning run; two are used here for the dark matter analysis.
3.4 Light Detector
The scintillation light is measured by a separate cryogenic detector. This is made from a sapphire wafer of diameter and thickness, with an epitaxially grown silicon layer on one side for photon absorption. The weight is 2.3 g. This silicon-on-sapphire (SOS) material exploits the excellent phonon transport properties of sapphire. The resulting detector with the sensor as in Fig. 5 is sensitive down to about 20 eV, or about seven optical photons.
Further progress in using the light yield to identify which nucleus is recoiling, as discussed below, depends largely on the improvement of the resolution of the light detector.
4 Data Taking and Analysis
Only very basic quality cuts are performed on the data. Pulses are rejected if they occur in one of the rare periods when the temperature of the cryostat is not stable, as inferred from the pulse height of the control pulses. Pileup is rejected by simple cuts on the baseline of the pulse. Due to the low trigger rate this does not introduce a significant dead time into the analysis.
4.1 Signal Processing and Pulse Fitting
For recording thermometer pulses, the output voltage of the SQUID electronics is split into two branches. In one branch the pulse is shaped and AC-coupled to a trigger unit, while in the other branch the signal is passed through an 8-pole anti-aliasing low-pass filter and then DC-coupled to a 16-bit transient digitizer. The time bin of the transient digitizer was chosen to be , providing about 30 samples for the rising part of the pulse in the phonon channel. The record length of 4096 time bins includes a pre-trigger region of 1024 samples to record the baseline before the event, while the remaining 3072 post-trigger samples contain the pulse itself. The phonon and light channels of each module are read out together, whenever one or both trigger.
The pulses are fitted offline using a template fit, with a template constructed from pulses collected during a gamma calibration run. There is an individual template for each thermometer. Both pulses from a module are fitted simultaneously. Free parameters in the fit are the two baselines, the two pulse height amplitudes, and a common time shift relative to the trigger.
4.2 Energy Determination
Finally, the assignment of an energy to a pulse is made on the basis of the resulting amplitude or pulse height parameter. Since the pulses from the calilbration with and photons establish a relation between pulse height and energy for each detector, a first simple determination of the pulse height-energy relation for a detector would be provided by a linear extrapolation from to lower energies, and in early work this gave good results. Direct calibration with lower energy gammas is not possible since the calibration source is outside the coldbox and the photon must penetrate about of copper.
A finer and more detailed determination of the pulse height-energy relation for a given detector is possible, however, by using the heater calibration pulses mentioned in section 3.2. For each thermometer, heater pulses delivering a known energy via ohmic heating are injected every 30 seconds. These are applied over the whole energy range of interest, so the thermometer response can be mapped down to low energies and the assumption of a simple linear extrapolation can be avoided. Both target and light detectors are calibrated by this procedure.
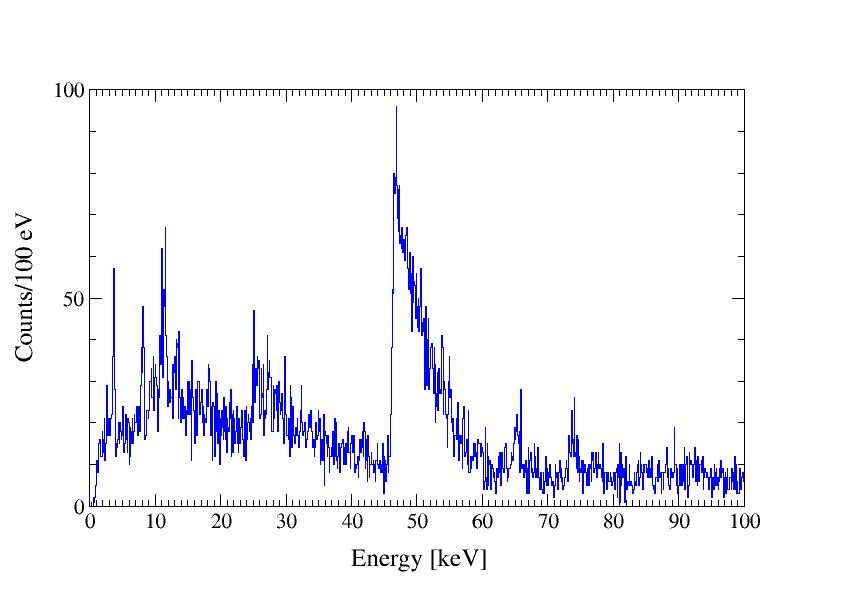
The accuracy and resolution of this method is illustrated in Fig. 6, which shows the energy spectrum of the target detector “Verena” in the commissioning run. The energy resolution may be gauged from the prominent feature starting around and the line near , which can be identified as a copper fluorescence line. The large feature is due to the gamma transition of a impurity in the crystal, with a broadened right shoulder from an accompanying spectrum. The steep left edge appears precisely at as expected. The peak for the copper fluorescence line is at , also as expected, and the energy resolution is . These two features confirm the excellent accuracy of the calibration method with heater pulses. Further details of the energy spectrum can also be understood and will be discussed in a forthcoming publication.
4.3 Energy-Light Plots and Quenching Factor
Events from a given module are plotted as points in the energy-light yield plane, as in the following Figs. 7 and 8. An energy is assigned to an event as described in the previous section. The light yield is given by the ratio of the energy or pulse height in the light detector to that in the target detector, normalized such that it is 1 for a 122 keV calibration photon absorbed in the large detector. While the light yield for a 122 keV photon is therefore one by definition, the fact that the bands are roughly flat on the plots, and the average light yield is always near one, is not a matter of definition and reflects the accuracy of the thermometer calibrations and the approximate linearity111Upon closer examination it appears that the centroid of the electron-photon band falls slightly at lower energies. Such a decrease for rays in has been seen in Ref. [16]. of the light production process [17].
It will be seen that when a source inducing nuclear recoils is present, as with neutrons in Fig. 7, there are two distinct bands, one of lower light yield from nuclear recoils and one of higher light yield from electron-photon events. The factor of reduction for the light yield of a nuclear recoil relative to that of the electron-photon event of the same energy is called (in our usage) the quenching factor. With the electron-photon band centered on 1, the center of the nuclear recoil band on Fig. 7 is simply at the inverse of the quenching factor.
Since the quenching factor varies widely, up to for heavy elements, the level of light output can be used not only to distinguish nuclear recoils from electron-photon events, but also to distinguish tungsten recoils from those of the lighter nuclei. It is hoped that it may be ultimately possible to determine which particular nucleus, in a compound material like , is recoiling. This would be very useful in verifying a positive dark matter signal, since a simple behavior for the signal with respect to changing the target nucleus is expected.
5 Neutron Test
To directly test the response of the system to nuclear recoils a neutron test was carried out during the commissioning run. The test can be used to check the principle of identifying the recoiling nucleus via the light yield and to also determine the dispersion in the light output, which is important in applying the method.
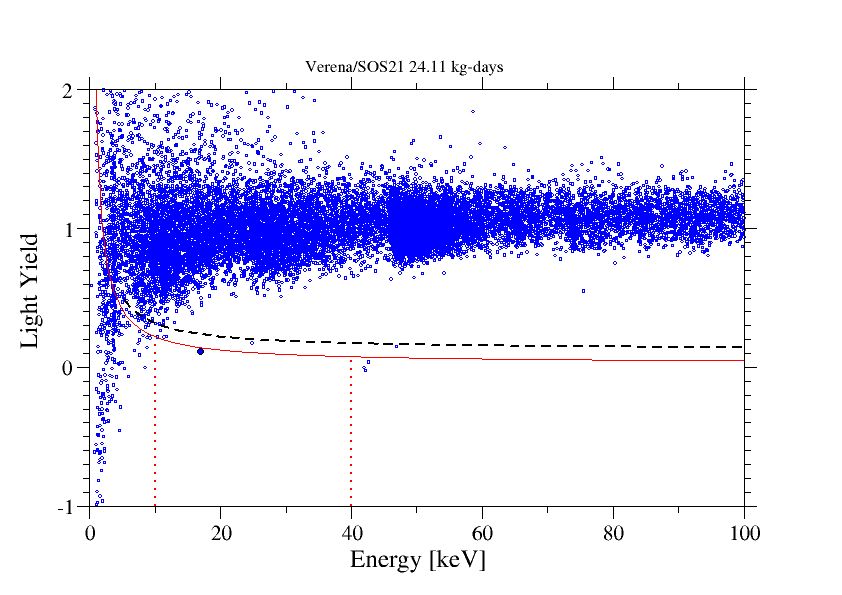
Above recoil energy, calculations show that the spectrum for neutron scattering on is totally dominated by oxygen recoils [22]. Therefore one anticipates that the events of the nuclear recoil band in this test should lie roughly on or below the line corresponding to the oxygen quenching factor known from the previous quenching factor studies.
A neutron source was placed inside the polyethylene shield and Fig. 7 shows the results for one of the two modules (Verena/SOS21). Using the quenching factor of 9 and the measured energy-dependent resolution of the light detector, 90 % of the neutron-induced recoils should be below the red line.
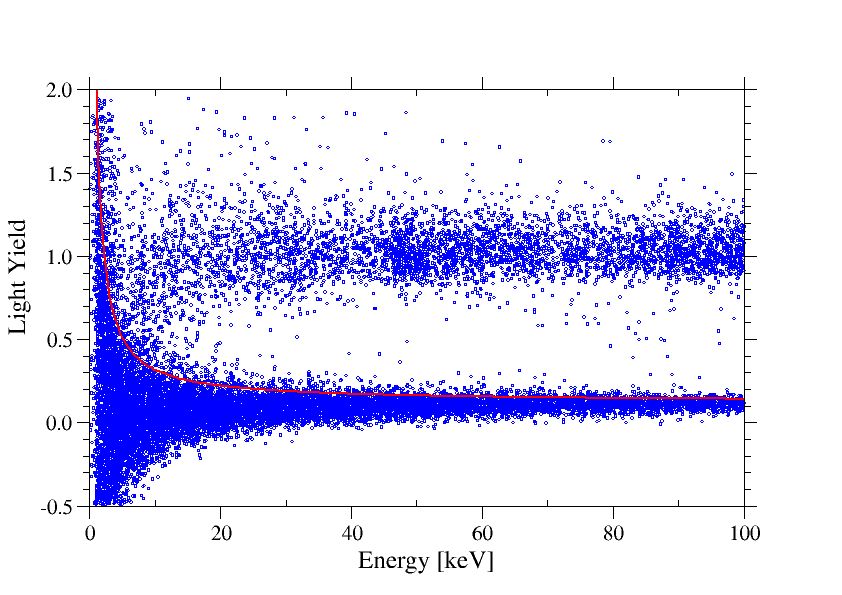
The neutron test data appears to agree well with this prediction, and so supports our arguments in the dark matter analysis that an acceptance region for nuclear or tungsten recoils based on the same principle can be defined.
6 Dark Matter Limits
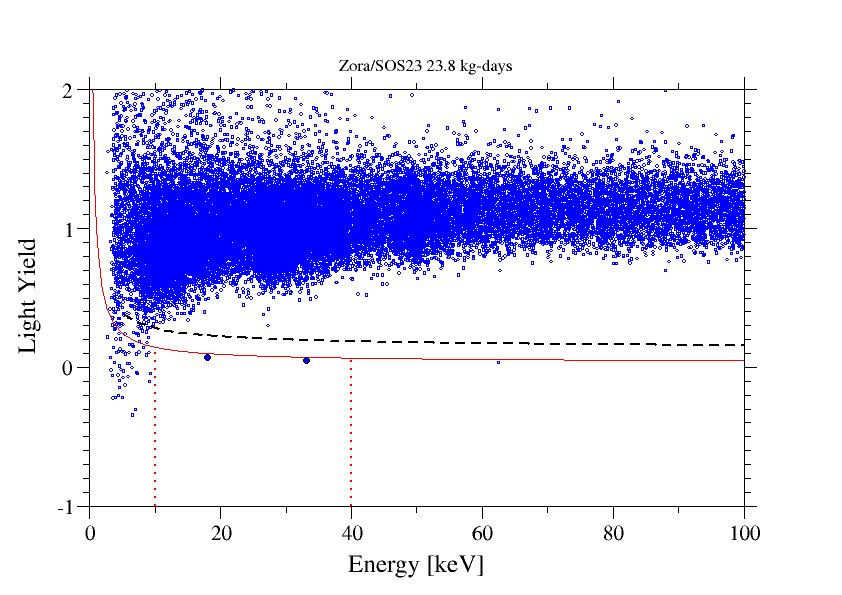
For the dark matter analysis we use data taken between March 27th and July 23rd 2007 with the two detector modules (Zora/SOS23) and (Verena/SOS21). The data are shown in Fig. 8. The cumulative exposure was . For the tungsten this corresponds to an exposure of .
We perform an analysis on the assumption of coherent or spin-independent scattering for the WIMP. This process should strongly favor tungsten recoils due to the factor in the WIMP- nucleus cross section. We define an acceptance region on the plots based on a) the quenching factor for the light yield and b) the maximum energy expected for tungsten recoil. A similar region for “all nuclear recoils” can be defined using the quenching factors for Ca and O. The quenching factor boundaries are shown on the plots of Fig. 8 by the curves. Below the upper curve 90 % of all nuclear recoils are expected, and below the lower curve 90 % of the tungsten recoils are expected. The energy boundaries are shown by the vertical lines. The upper limit at is set by form-factor [23] effects, which effectively limit the energy transfer to the tungsten nucleus. The lower limit is set at , where “leakage” from the electron/photon events becomes evident and so recoil discrimination becomes inefficient.
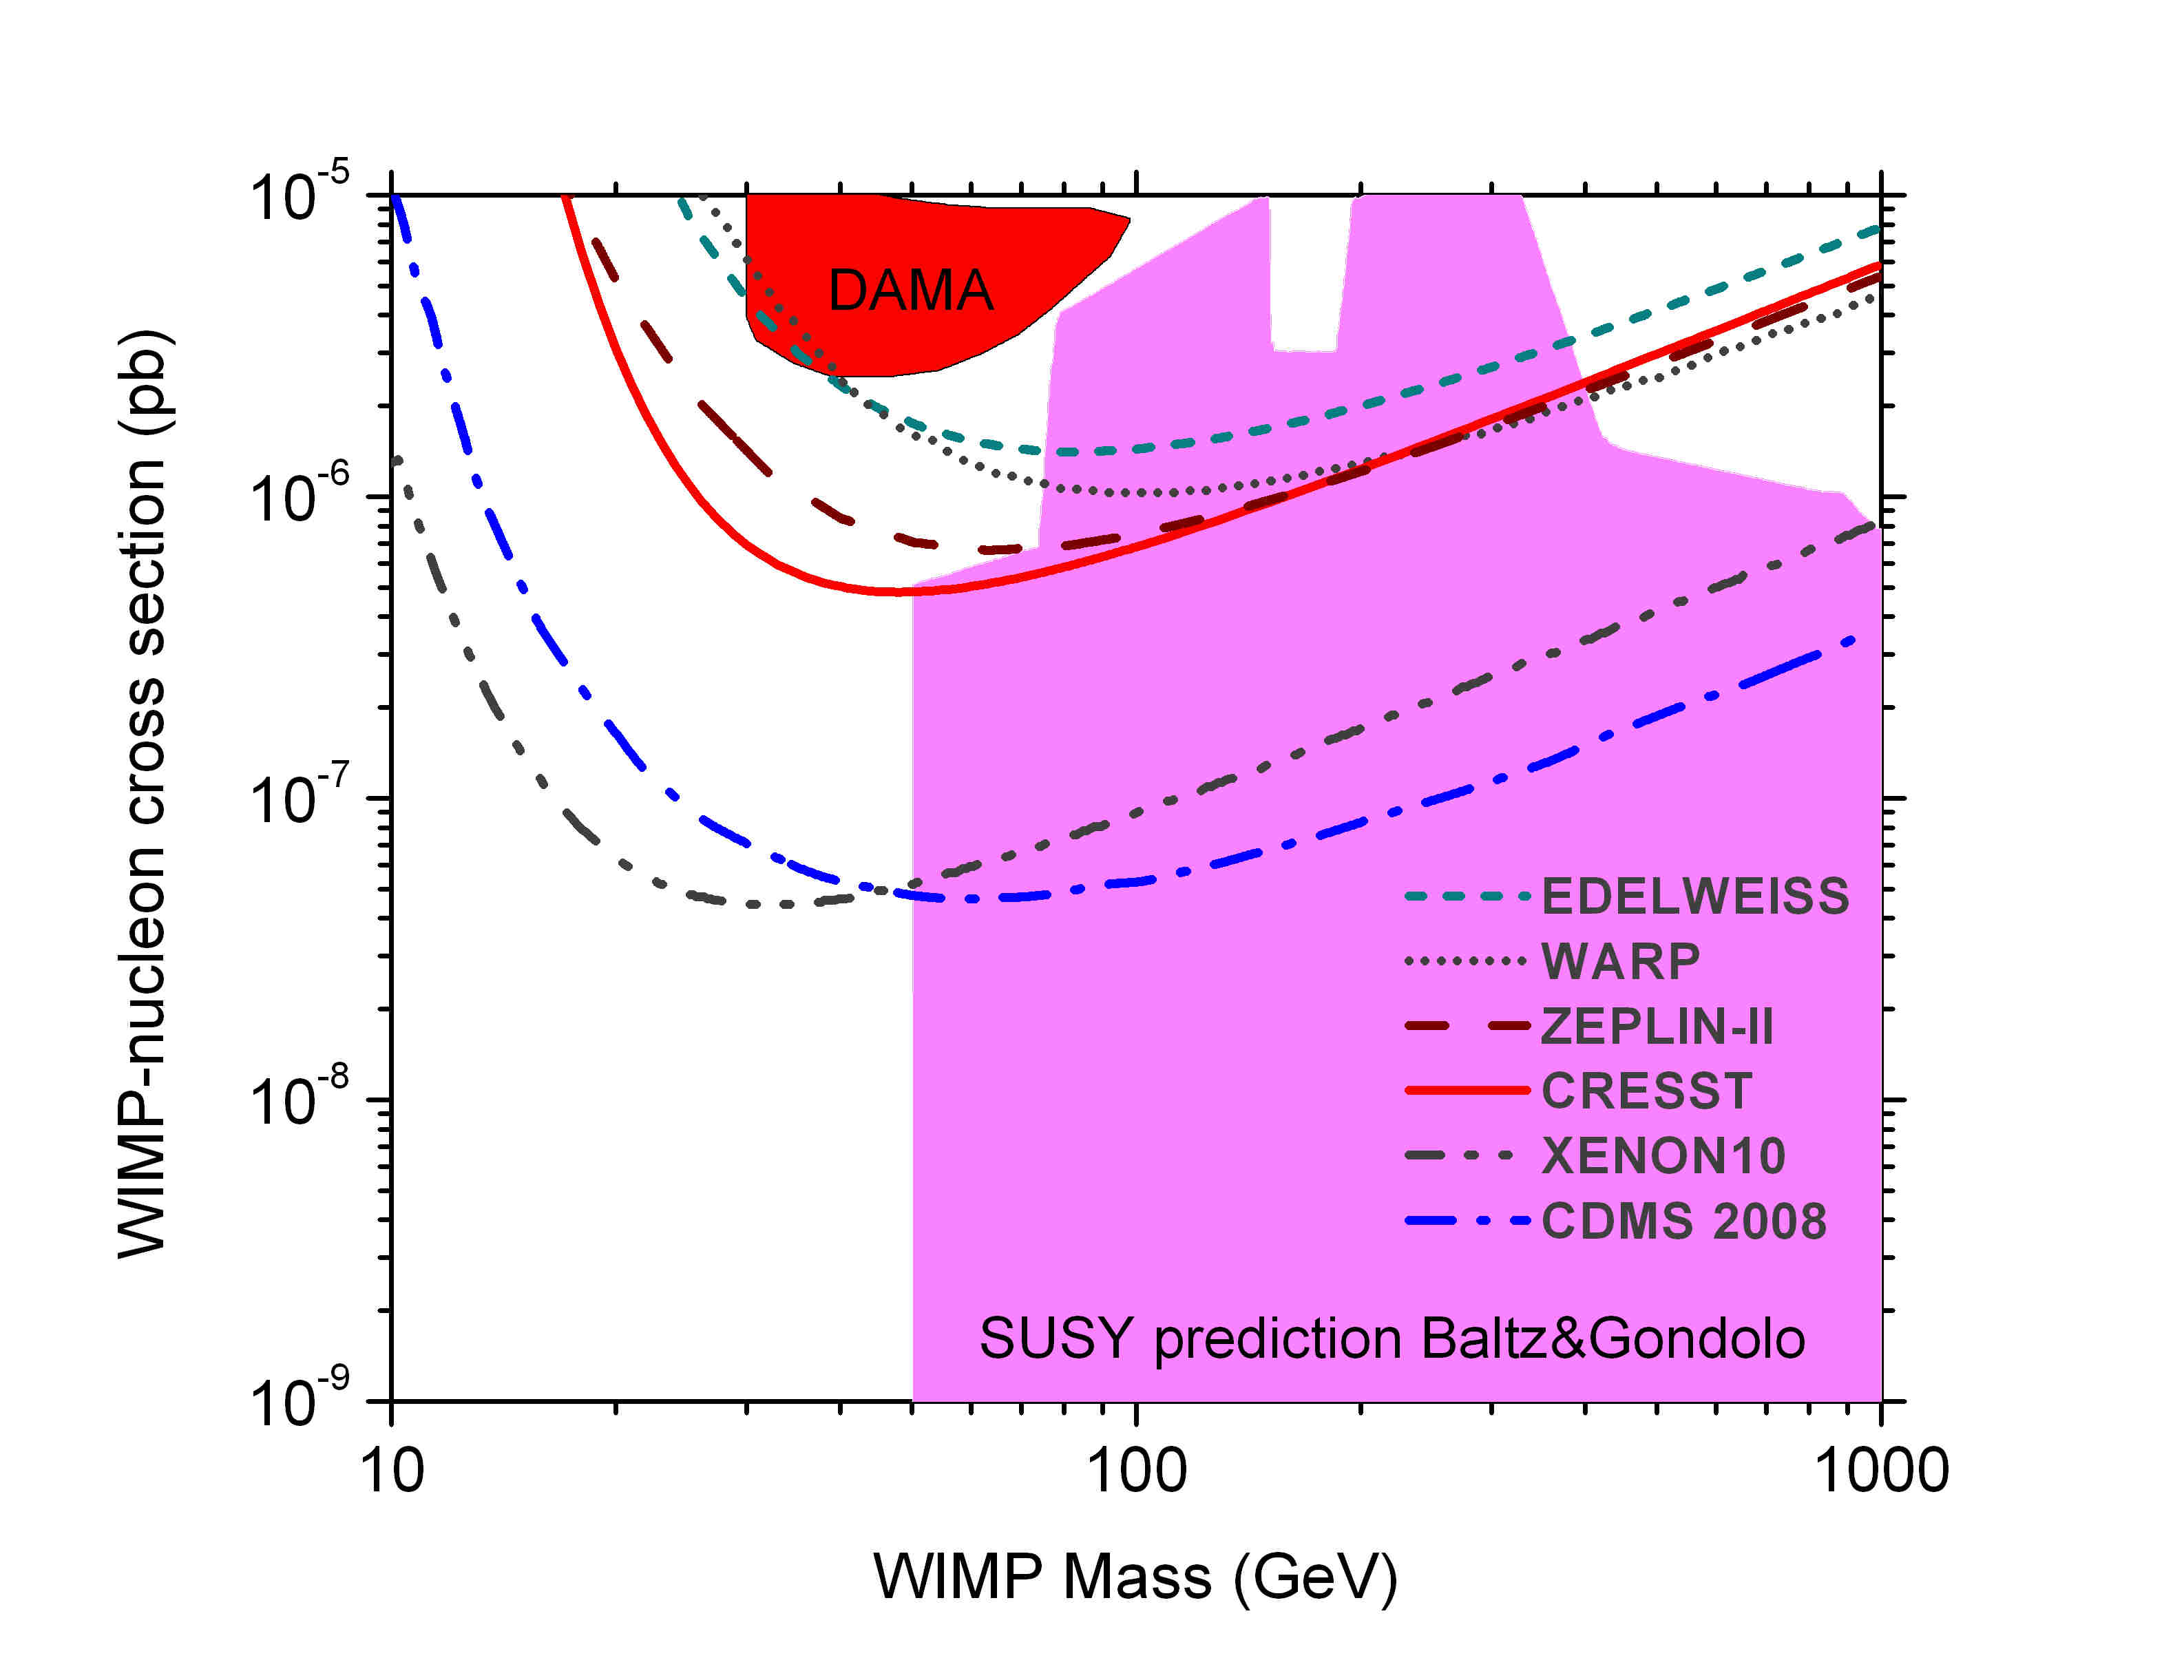
Three candidate events (heavy black dots) are observed in Fig. 8 for the “tungsten recoils” acceptance region. The individual events are at 16.89 keV (Verena/SOS21) and at 18.03 keV and 33.09 keV (Zora/SOS23). The corresponding rate is 0.063 per kg-day. From this rate we can derive a limit on the coherent spin-independent WIMP-nucleon scattering cross section. Using standard assumptions on the dark matter halo [24, 25] (WIMP mass density of ), an upper limit for the coherent or spin-independent WIMP-nucleon scattering cross-section may be obtained using the maximum energy gap method [26]. This limit is plotted as the red curve in Fig. 9. The minimum of the curve, for a WIMP mass of 50 GeV, is at .
7 Backgrounds
To judge the improvement with respect to our previous setup of Ref. [7] we take the “all nuclear recoils” region and reset the low energy boundary of the acceptance region to 12 keV as it was there. In this acceptance region the earlier work had 16 events, for a rate of 0.87 per kg-day. As noted in Ref. [7], this rate was compatible with the estimates of [33] for neutron background. The present commissioning run has 4 events in the same acceptance region, for a rate of 0.083 per kg-day, so we may say there is a factor improvement. We attribute this to the presence of the neutron shield.
On the other hand, according to the arguments in section 5 the “tungsten recoils” should be insensitive to neutron background. Indeed, the three events here from 48 kg-days are quite compatible with the zero events from 10 kg-days in Ref. [7]; the present rate of 0.063 per kg-day predicts only 0.6 events for 10 kg-days. The fact that the neutron shield appears to have a great effect on “all nuclear recoils” but little effect on “tungsten recoils” supports our argument that the light yield successfully distinguishes tungsten and other nuclear recoils.
The question arises, however, as to the nature of the few observed tungsten or nuclear recoil candidates. One possibility is evidently remaining neutrons. However with many absorption lengths for the shield very few should penetrate and indeed simulations [34] would give a rate of only per kg-day, much less than the few events. A possible point here is that during the run a weak spot in the neutron shielding above the muon veto was identified and patched only after data taking was completed.
Another possible source for neutrons are some non-operational modules which were present during the run. These can act as non-vetoable neutron sources for the operational modules. However an estimate for the background events from an inactive detector module is well below per kg-day.
Apart from neutrons, another possibility arises from incomplete coverage of the inner surfaces of the detector module with scintillator, which could lead to unvetoed nuclear recoils from surface -decays as discussed in section 3.1. In further work it is intended to paint some possibly uncovered areas with scintillating material.
Concerning muons, estimates [34] of muon-induced neutrons in the setup result in only per kg-day. No muon signals were found in coincidence with nuclear recoil events.
There thus appears to be no conclusive explanation for the few candidate events from conventional radioactive or particle sources. We hope to clarify some of these points in further work.
8 Conclusions
CRESST-II successfully completed its commissioning run in 2007. New elements of the apparatus were successfully installed and operated. A neutron test demonstrated the ability to detect nuclear recoils with a light yield consistent with that found from quenching factor studies, supporting the principle of identifying the recoil nucleus via the light yield.
Data were taken with two detector modules for a total of 48 kg-days. Three candidate events of uncertain origin are present in the acceptance region for tungsten recoils, yielding a rate of 0.063 per kg-day. A factor improved performance is found with respect to previous work for the “all nuclear recoils” acceptance region.
A limit on coherent WIMP-nucleon scattering, is obtained, which at its lowest value, for GeV, is .
9 Acknowledgements
This article is dedicated to the memory of our friend and colleague Wolfgang Westphal, who significantly contributed to the success of CRESST.
This work was partially supported by funds of the DFG (SFB 375, Transregio 27:“Neutrinos and Beyond”), the Munich Cluster of Excellence (“Origin and Structure of the Universe”), the EU networks for Cryogenic Detectors (ERB-FMRXCT980167) and for Applied Cryogenic Detectors (HPRN- CT2002-00322), and the Maier-Leibnitz-Laboratorium (Garching). We also thank Hans Ulrich Friebel for valuable technical support.
Support was provided by the Science and Technology Facilities Council.
References
- [1] G. Bertone, D. Hooper, and J. Silk, Phys. Rep. 405 (2005) 279.
- [2] E. Komatsu et al., (2008) arXiv:0803.0547v1 [astro-ph].
- [3] R. Sanders and S. McGaugh, Ann. Rev. Astron. Astrophys. 40 (2002) 263.
- [4] D. Clowe et al., Astrophysical Journal 648 (2006) L109.
- [5] R. Trotta, R. Ruiz de Austri and L. Roszkowski, New Astronomy Reviews 51 (2007) 316.
- [6] R. Trotta, R. Ruiz de Austri and L. Roszkowski, JHEP 07 (2007) 075.
- [7] G. Angloher et al., Astropart. Phys. 23 (2005) 325.
- [8] G. Angloher et al., Astropart. Phys. 18, (2002) 43.
- [9] B. Majorovits et al., submitted to Applied Radiation and Isotopes (2008).
- [10] S. Henry et al, The 66-channel SQUID readout for CRESST-II. J. Inst. 2 (2007) P11003.
- [11] B. Majorovits et al., Rev. Sci. Instruments 78 (2007) 073301.
- [12] P. F. Smith, Astropart. Phys. 8 (1997) 27 gives, in Table 2, the capture range for MeV neutrons in various substances. In materials it is 4.3 cm.
- [13] D. Nicolodi, Bachelor thesis, Universita’ degli Studi di Trento, Italy (2005).
- [14] P. Meunier et al, Appl. Phys. Let. 75 (1999) 1335.
- [15] W. Westphal et al., J. Low Temp. Phys., 151 (2008) 824.
- [16] M. Moszynski et al., Nuc. Inst. Meth. A 533 (2005) 578, Fig 12. A review of scintillator non-proportionality for photons and electrons can be found in W. W. Moses et al., IEEE Trans. Nuc. Sci. 55 (2008) 1049.
- [17] I. Bavykina et al., Astropart. Phys. 28 (2007) 489, arXiv:0707.0766.
- [18] V. B. Mikhailik and H. Kraus, J. Phys. D 39 (2006) 1181.
- [19] J. Ninković et al., Nuc. Inst. Meth. A 564 (2006) 567.
- [20] T. Jagemann et al., Astropart. Phys. 26 (2006) 269.
- [21] C. Coppi et al., Nuc. Inst. Meth. A 559 (2006) 396
- [22] H. Wulandari, private communication. The dominance of oxygen recoils above 10 keV is principally due to kinematics; the test neutrons have MeV energy and the recoil energy of a nucleus is .
- [23] R. H. Helm, Phys. Rev. 104 (1956) 1466.
- [24] F. Donato, N. Fornengo and S. Scopel, Astropart. Phys. 9 (1998) 247.
- [25] J. D. Lewin and P. F. Smith, Astropart. Phys. 6 (1996) 87.
- [26] S. Yellin, Phys. Rev. D 66 (2002) 032005.
- [27] Z. Ahmed et al, arXiv:0802.3530v2 [astro-ph].
- [28] J. Angle et al., Phys. Rev. Lett. 100, (2008) 021303.
- [29] P.Benetti et al., arXiv:astro-ph/0701286v2.
- [30] V. Sanglard et al., Phys.Rev. D71 (2005) 122002.
- [31] G. J. Alner et al., Astropart. Phys. 28 (2007) 287.
- [32] E. A. Baltz and P. Gondolo: Physical Review D 67 (2003) 063503.
- [33] H. Wulandari et al., (2003) arXiv:hep-ex/0401032.
- [34] H. Wulandari, J. Jochum, W. Rau, F.von Feilitzsch, Astropart. Phys. 22 (2004) 313, hep-ex/0312050v2.