The Signature of the Ice Line and Modest Type I Migration in the Observed Exoplanet Mass-Semimajor Axis Distribution
Abstract
Existing exoplanet radial velocity surveys are complete in the planetary mass-semimajor axis () plane over the range 0.1 AU 2.0 AU where . We marginalize over mass in this complete domain of parameter space and demonstrate that the observed distribution is inconsistent with models of planet formation that use the full Type I migration rate derived from a linear theory and that do not include the effect of the ice line on the disk surface density profile. However, the efficiency of Type I migration can be suppressed by both nonlinear feedback and the barriers introduced by local maxima in the disk pressure distribution, and we confirm that the synthesized distribution is compatible with the observed data if we account for both retention of protoplanetary embryos near the ice line and an order-of-magnitude reduction in the efficiency of Type I migration. The validity of these assumption can be checked because they also predict a population of short-period rocky planets with a range of masses comparable to that of the Earth as well as a “desert” in the distribution centered around and AU. We show that the expected “desert” in the plane will be discernible by a radial velocity survey with 1 m s-1 precision and radial velocity observations of program stars.
1 Introduction
Over 200 planets with reliable mass () and semimajor axis () measurements have been discovered around nearby FGK stars in the past decade. At the same time, attempts to build a comprehensive deterministic theory of planet formation have lead to the development of population synthesis models based on the sequential accretion scenario. In Ida & Lin (2004), two of us studied the growth of planetesimals into dynamically isolated embryos as well as their tidal interactions with their parent disks. Using the observed ranges of disk mass, size, and accretion rate we showed that a fraction of embryos evolve into cores with more than a few Earth masses (), accrete massive envelopes, open up gaps near their orbits, and attain asymptotic masses comparable to that of Jupiter. In some massive and persistent disks, the newly formed gas giant planets may migrate toward the proximity of their host stars. In the end these simulations produced the distribution of dynamical and structural properties of planets. Presently, the observed sample of extrasolar planetary properties has become large enough to enable direct comparisons between the theoretically predicted and observed distributions that not only delineate the dominant physical mechanisms at work in planet formation, but also provide quantitative constraints on the efficiencies of those processes.
In the latest update of the planet formation models two of us have incorporated the effect of Type I migration (Ida & Lin, 2008a). This process is a direct consequence of a protoplanetary core’s tidal interaction with its parent protoplanetary disk. The efficiency of Type I migration was first determined by a linear theory (Goldreich & Tremaine, 1980; Ward, 1986; Tanaka et al., 2002) that neglected the embryo’s perturbation on the surface density distribution of its parent protoplanetary disk. In the environment of a minimum mass nebula though, this efficiency factor would imply that a protoplanetary embryo with mass a fraction of an Earth mass would migrate from AU into its host star before the severe depletion of the disk gas that is known to occur over a time scale of several Myr. Although this critical mass at which Type I migration causes AU-scale migration on the disk depletion time increases with , it is still difficult to retain sufficiently massive cores for the onset of dynamical accretion of gas. This argument implies that gas giants should be very rare (Ida & Lin, 2008a) and this paradox has led to many in-depth analyses of the Type I migration process. Numerical nonlinear simulations of Type I migration were reviewed by Papaloizou & Terquem (2006) and many potential explanations for slow Type I migration are in the literature: intrinsic turbulence in the disk (Laughlin et al., 2004; Nelson & Papaloizou, 2004), self-induced unstable flow (Koller & Li, 2004; Li et al., 2005), nonlinear radiative and hydrodynamic feedback (Masset et al., 2006a), and variation in surface density and temperature gradients (Masset et al., 2006b). Dobbs-Dixon (2007) has shown that in some situations the nonlinear Type I migration rate can be less than 10% of the linear prediction.
Another issue studied by two of us (Ida & Lin, 2008b, IL hereafter) is the critical embryo mass at least a few required by current models for runaway gas accretion. The embryo is limited by its isolation mass , and the solid surface density profile of the minimum mass solar nebula (MMSN) requires that the scales like . On the other hand, the timescale for growth scales with . As a result, after the characteristic gas depletion time the most massive embryos near the ice line have masses . However, since we observe many exoplanets with Jupiter masses at AU, there must be some physical process that is neglected in this simple analysis. Kretke & Lin (2007) outlined one possible solution to this problem in which solids are trapped near regions of the disk where the local pressure requires the gas to rotate with super-Keplarian velocities. When the combined contribution of both Lindblad and corotation resonances are taken into account (Masset et al., 2006b), the migration of protoplanetary cores may be suppressed as well (IL).
In this paper, we utilize the observed data to calibrate the population synthesis models. In §2 we quantitatively show that the existing distribution of exoplanets cannot be explained by models of planet formation that apply the full Type I migration rate predicted from linear theory and that do not include the effects of the ice line. We also point out that the existing observed and synthesized distributions are in agreement with each other if we take into account the effect of an ice line barrier and assume a reduction in the magnitude of Type I migration. In addition, we describe the parameters of a radial velocity survey capable of verifying the existence of “desert” in the diagram predicted by IL. In §3 we consider the implications of these models and suggest methods to test our assumptions. In §4 we summarize our findings.
2 Analysis
We use the ideas presented in Narayan et al. (2005) and the formalism developed in Cumming (2004) to approximately reproduce the result of Cumming et al. (2008) that showed that the current California and Carnegie Planet Search (CCPS) has announced all planets with orbital period days, stellar reflex velocities m s-1, and eccentricities . In particular, we determine which of the simulated exoplanet systems from IL would be detectable by a radial velocity survey with precision and cadence similar to present-day radial velocity surveys like the CCPS and the High Accuracy Radial Velocity Planetary Search Project (HARPS). In this approach, we combine Equation (26) and (30) of Cumming (2004) and declare that all the synthesized planetary systems from IL with mass where
| (1) |
are detectable. In Equation (1), is the number of radial velocity observations, is the RMS of spectrograph precision and stellar jitter, is the inclination of the exoplanet’s orbit, is the orbital period in years, and is the host stellar mass in solar masses. In the limit of large , is the number of independent frequencies searched and is the false alarm probability – the numerical values are correct to order-of-magnitude and in any case they only very weakly influence our estimate of . We note that Equation (1) is formally correct only for single planetary systems in circular orbits; however, Cumming (2004) shows that in the limit of large Equation (1) applies to multiple planet systems and in the case where . Therefore, we set if . We assume a velocity resolution of 1 m s-1.
We then carry out a Monte Carlo simulation in which we assign each of the simulated planetary systems from IL a random host stellar mass, stellar jitter, eccentricity, inclination, and number of radial velocity observations. In this prescription, we use the empirical distributions for host stellar mass, stellar jitter, eccentricity, and number of radial velocity observations given in the updated Butler et al. (2006) catalog111Maintained at http://www.exoplanets.org of all known exoplanets; we use the standard distribution for random inclinations. We compute which planetary systems have and declare that these systems are detectable in this iteration.
We repeat this process 1000 times. We consider all planetary systems that are detectable according to the criterion in 90% of the Monte Carlo iterations robustly detectable. Averaged over host stellar mass, stellar jitter, eccentricity, inclination, and number of radial velocity observations we find that all of the simulated planets from IL in the range 0.1 AU 2.0 AU with
| (2) |
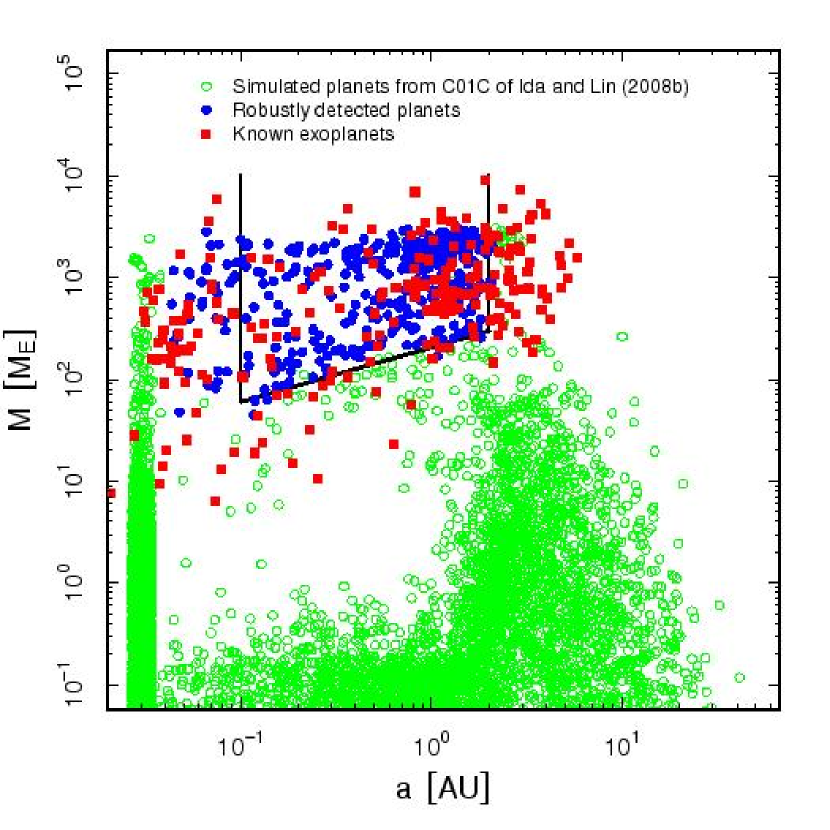
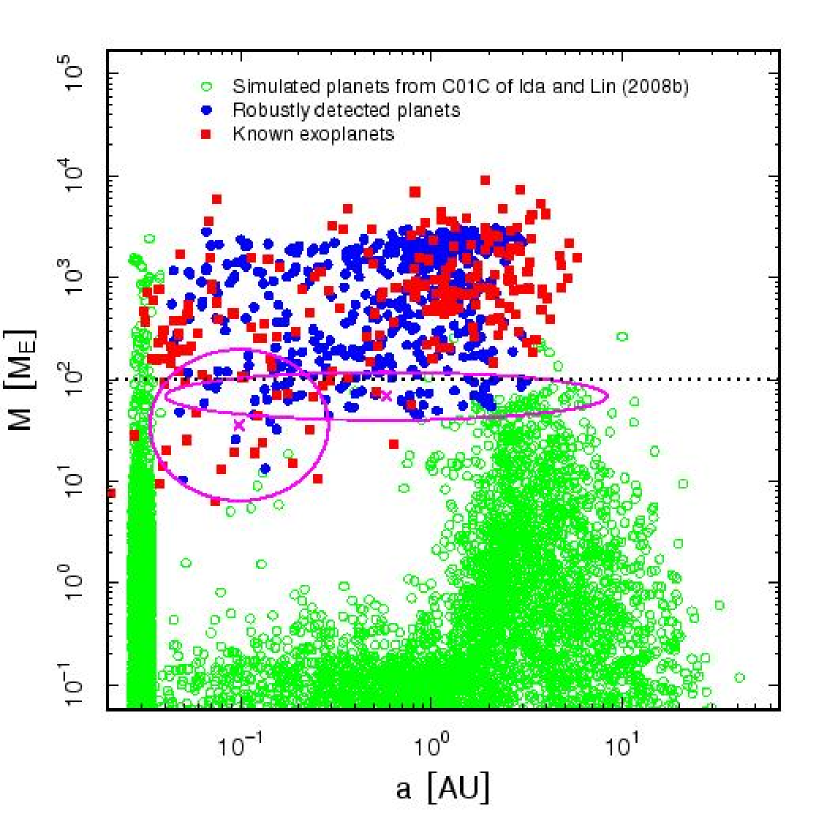
are robustly detectable. We include the results of this calculation in Figure 1. The robustly detectable systems are marked with solid circles and we plot the observed distribution of known planetary systems as the solid squares.
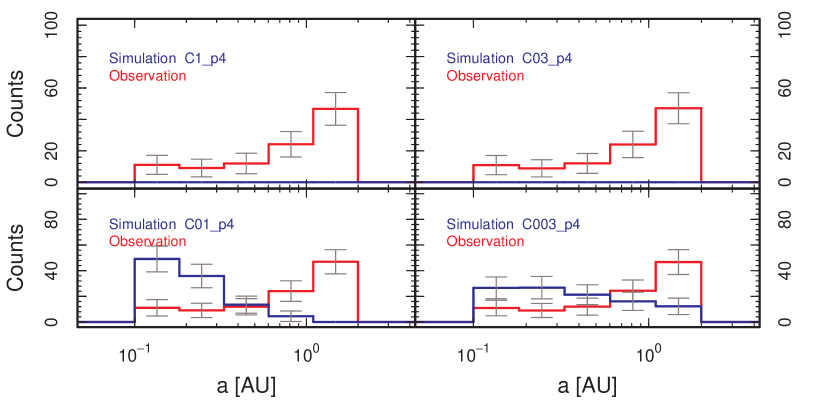
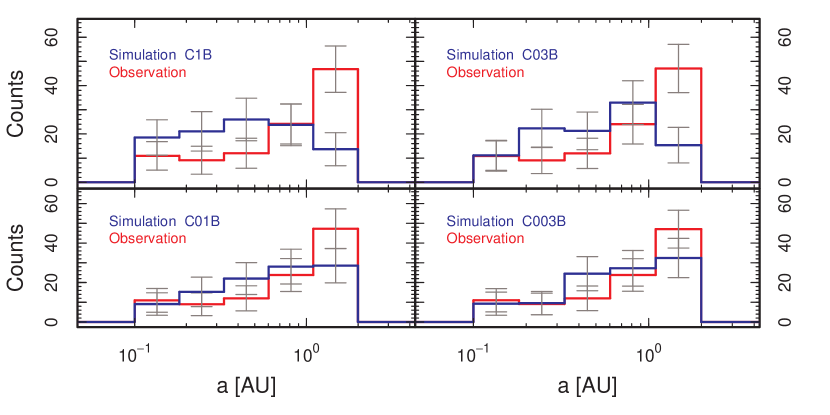
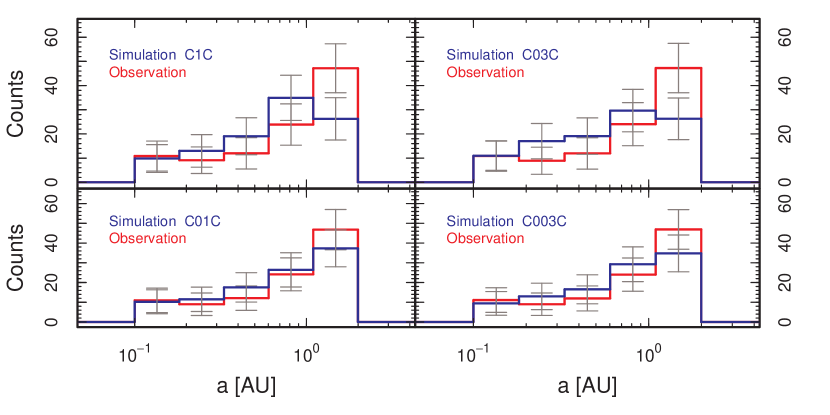
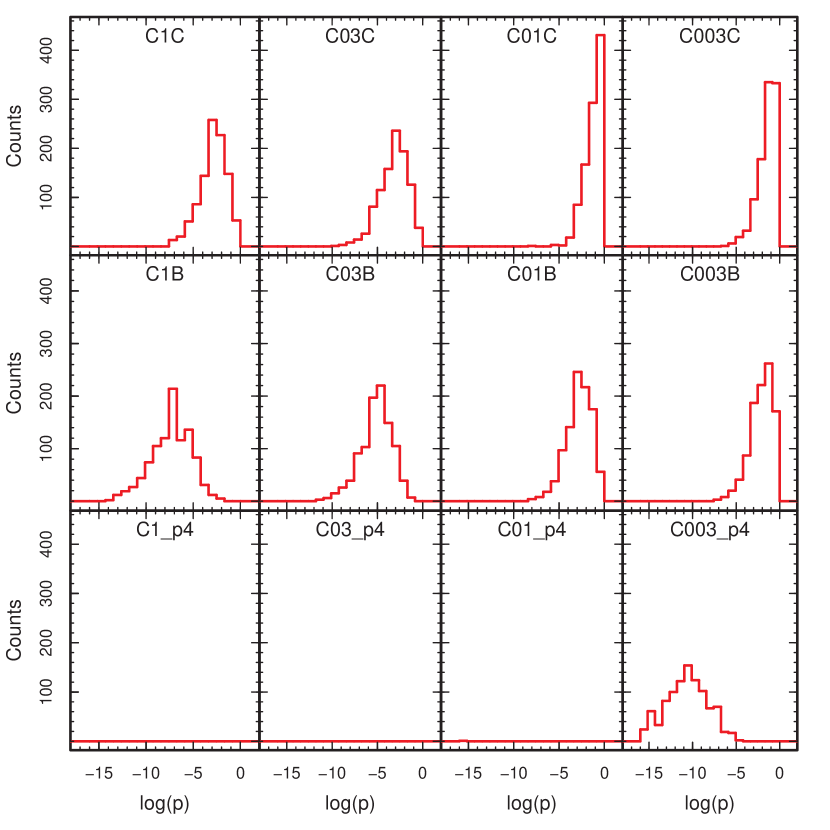
IL generated a set of 12 realizations of the plane under different physical assumptions described in Table 1. One group of models result from disks with the characteristic bump in gas surface density due to the coupling effect of the MRI activity and the ice line and with an enhancement in solid surface density , another group of models has the bump in but not in , and the last group ignores the effects the ice line would have on and . For each group of models, four different parameterizations of the Type I migration rate were used: 100%, 30%, 10%, and 3% of the full rate from linear theory. For each group of models we marginalize the 2D distribution of the simulated exoplanet systems in the complete region over planetary mass, leaving us with 1D distributions in semimajor axis. We plot histograms for each group of models: Figure 2 corresponds to the models that disregard the effects of the ice line on and , Figure 3 corresponds to the models that includes the effect of the ice line on but not , and Figure 4 corresponds to the models that include the effects of the ice line on and .
We determine the model that best matches the observed distribution in the complete region by computing for each model the -value distribution that results from comparing 1000 bootstrap resamplings from that model in the complete region with 1000 resamplings of the observed data in the complete region. We include the results of this calculation in Figure 5 and we also report median -values and 95% intervals in the last three columns of Table 1. We find that only models that include the effects of the ice line on both the gas and solid surface density of the disk and apply a Type I migration rate an order-of-magnitude less than that predicted by linear theory (models C01C and C003C) are consistent with the observed data in the complete region. Models which neglect the presence of the ice-line barrier generally do not yield the observed up-turn in the period distribution of the known planets and are rejected at very high confidence. Models with efficient Type I migration generally under predict the fraction of stars with detectable gas giants, especially for those with outside the ice line. Therefore, we argue that the population synthesis models presented in IL incorporating a Type I migration rate much reduced from linear theory and the effects of the ice line on both the solid and gas surface densities ( and respectively) are at least plausible deterministic models for giant planet formation. We also note that the observed data suggests that the ad hoc prescription for the location of the ice line used by IL underestimates its radius by perhaps even a factor of two.
Furthermore, in the presentation of their population synthesis models IL illustrated the presence of a “desert” in the distribution. This sparsely populated region is depleted due to both Type I migration and runaway gas accretion. For Models C01C and C003C, this “desert” is centered around and AU. We use the same detection strategy described above, only now we model the number of radial velocity observations of each planetary system over a period of about ten years as a Gaussian random variable with mean and standard deviation ; we round each random deviate to the nearest whole number. We then fit a two component Gaussian mixture model to the distribution of all robustly detected planet with mass , and we say the “desert” is detected if the mean vectors of the two Gaussians are offset by more than in and the minor axis of the Gaussian at smaller orbital radius is larger than the minor axis of the Gaussian at larger orbital radius. In other words, if the two components of the mixture model bracket the corner of a region devoid of extrasolar planets – a metaphorical “desert” – we say the “desert” is resolved. We find that when and , the two components of the mixture model bracket a barren region and therefore the “desert” is resolved more than 90% of the time. We illustrate results of our calculation in Figure 6. As a result, a radial velocity campaign with the parameters described above will be able to confirm the fidelity of the models presented in IL.
3 Discussion
The key prediction of IL is that for masses at which the dominant migration mechanism is Type I migration – – there will be a dearth of exoplanets within 1 AU of their host stars, simply because the timescale for Type I migration is so much shorter than the disk dispersal time. Since they are formed interior to the ice line, these planets are likely to be rocky and have mass a few . IL also predict an overdensity of gas giant planets at AU resulting from the ice line. We show in Figure 6 that one can quantitatively detect these features in the observed with a radial velocity survey with 1 m s-1 precision and about 700 radial velocity observations, or about ten years worth of data from the Automated Planet Finder (APF). In future work, we will examine the ability of missions like the Space Interferometry Mission (SIM) to verify the same features in plane.
In addition to the upper and lower bound, the “desert” is also surrounded by populated domains in the distribution. While the ice line provides a strong up-turn at a few AU, the models by IL also imply a large population of short-period rocky planets as a consequence of Type I migration. Despite an order-of-magnitude decrement in the efficiency of Type I migration, the simulated distribution of models C01C and C003C indicate that in the proximity of their host stars, rocky planets with a few are at least an order-of-magnitude more common than close-in gas giants (see Figure 6 of IL). Other authors have already pointed out the observational difficulties inherent in the search for this population of “super-Earths” through radial velocity observations (Narayan et al., 2005). Finally, we note that the models of IL did not include dynamical interactions between planets in multiple planetary systems, and these interactions can broaden the simulated distribution and eccentricity distribution. We will include these effects in future generations of the population synthesis models.
4 Conclusion
We used the fact that existing exoplanet radial velocity surveys are complete in the planetary mass-semimajor axis () plane where 0.1 AU 2.0 AU and is in the range specified by Equation (2) to show that the observed semimajor axis distribution in the complete region cannot be explained by models of planet formation that use the full Type I migration rate predicted by linear theory and that do not include the effects of the ice line. Moreover, we also demonstrated that the expected “desert” in the plane at about and AU predicted by IL will be discernible by a radial velocity survey with 1 m s-1 precision and radial velocity observations of program stars. Such an observational campaign will also verify the predicted inner boundary of the “desert” where we expect a large population of super-Earths have migrated to and halted in the proximity of their host stars.
References
- Butler et al. (2006) Butler, R. P., et al. 2006, ApJ, 646, 505
- Cumming (2004) Cumming, A. 2004, MNRAS, 354, 1165
- Cumming et al. (2008) Cumming, A., Butler, R. P., Marcy, G. W., Vogt, S. S., Wright, J. T., & Fischer, D. A. 2008, PASP, 120, 531
- Dobbs-Dixon (2007) Dobbs-Dixon, I. M. 2007, Ph.D. Thesis
- Goldreich & Tremaine (1980) Goldreich, P., & Tremaine, S. 1980, ApJ, 241, 425
- Ida & Lin (2004) Ida, S., & Lin, D. N. C. 2004, ApJ, 604, 388
- Ida & Lin (2008a) Ida, S., & Lin, D. N. C. 2008, ApJ, 673, 487
- Ida & Lin (2008b) Ida, S., & Lin, D. N. C. 2008, ArXiv e-prints, 802, arXiv:0802.1114
- Laughlin et al. (2004) Laughlin, G., Steinacker, A., & Adams, F. C. 2004, ApJ, 608, 489
- Li et al. (2005) Li, H., Li, S., Koller, J., Wendroff, B. B., Liska, R., Orban, C. M., Liang, E. P. T., & Lin, D. N. C. 2005, ApJ, 624, 1003
- Koller & Li (2004) Koller, J., & Li, H. 2004, The Search for Other Worlds, 713, 63
- Kretke & Lin (2007) Kretke, K. A., & Lin, D. N. C. 2007, ApJ, 664, L55
- Masset et al. (2006a) Masset, F. S., D’Angelo, G., & Kley, W. 2006, ApJ, 652, 730
- Masset et al. (2006b) Masset, F. S., Morbidelli, A., Crida, A., & Ferreira, J. 2006, ApJ, 642, 478
- Narayan et al. (2005) Narayan, R., Cumming, A., & Lin, D. N. C. 2005, ApJ, 620, 1002
- Nelson & Papaloizou (2004) Nelson, R. P., & Papaloizou, J. C. B. 2004, MNRAS, 350, 849
- Papaloizou & Terquem (2006) Papaloizou, J. C. B., & Terquem, C. 2006, Reports of Progress in Physics, 69, 119
- Tanaka et al. (2002) Tanaka, H., Takeuchi, T., & Ward, W. R. 2002, ApJ, 565, 1257
- Ward (1986) Ward, W. R. 1986, Icarus, 67, 164
| Name | aaFrom Ida & Lin (2008b) – equivalent to the fraction of the full Type I migration rate predicted from linear theory applied during the simulation | Enhanced | Enhanced | bbLower bound of an interval centered on median -value which contains 95% of our bootstrap realizations | ccMedian -value of our bootstrap realizations | ddUpper bound of an interval centered on median -value which contains 95% of our bootstrap realizations |
|---|---|---|---|---|---|---|
| C1C | 1 | Yes | Yes | |||
| C03C | 0.3 | Yes | Yes | |||
| C01C | 0.1 | Yes | Yes | |||
| C003C | 0.03 | Yes | Yes | |||
| C1B | 1 | Yes | No | |||
| C03B | 0.3 | Yes | No | |||
| C01B | 0.1 | Yes | No | |||
| C003B | 0.03 | Yes | No | |||
| C1_p4 | 1 | No | No | |||
| C03_p4 | 0.3 | No | No | |||
| C01_p4 | 0.1 | No | No | |||
| C003_p4 | 0.03 | No | No |